Exploring Levulinic Acid Industry Market Ecosystem: Insights to 2033

Levulinic Acid Industry by End-user Industry (Cosmetics and Personal Care, Pharmaceuticals, Polymers and Plasticizers, Fuel and Fuel Additives, Flavors and Fragrances, Other End-user Industries ), by Asia Pacific (China, India, Japan, South Korea, Rest of Asia Pacific), by North America (United States, Canada, Mexico), by Europe (Germany, United Kingdom, France, Italy, Rest of Europe), by South America (Brazil, Argentina, Rest of South America), by Middle East and Africa (Saudi Arabia, South Africa, Rest of Middle East and Africa) Forecast 2025-2033

Aug 11 2025
Base Year: 2024

180 Pages
Main Logo

Exploring Levulinic Acid Industry Market Ecosystem: Insights to 2033


Home
Industries
Chemicals & Materials
sponsor image
sponsor image
sponsor image
sponsor image

Tailored for you

  • In-depth Analysis Tailored to Specified Regions or Segments
  • Company Profiles Customized to User Preferences
  • Comprehensive Insights Focused on Specific Segments or Regions
  • Customized Evaluation of Competitive Landscape to Meet Your Needs
  • Tailored Customization to Address Other Specific Requirements
Ask for customization


Key Insights

The global levulinic acid market is experiencing robust growth, projected to reach a substantial size by 2033. A compound annual growth rate (CAGR) of 6.13% from 2019 to 2024 indicates a consistently expanding market, driven primarily by increasing demand from diverse end-use industries. The cosmetics and personal care sector is a significant consumer, leveraging levulinic acid's properties in skincare and hair care products. Pharmaceuticals also represent a considerable market segment, utilizing levulinic acid as an intermediate in the synthesis of various drugs. The polymers and plasticizers industry benefits from its use as a building block for sustainable materials, further fueling market expansion. Additionally, growing applications in flavors and fragrances and as a fuel additive contribute to the overall market momentum. Regional variations exist, with Asia Pacific, particularly China and India, expected to dominate due to increasing industrialization and rising consumer demand. North America and Europe also contribute significantly to the market share, driven by established industries and stringent regulations promoting sustainable alternatives.
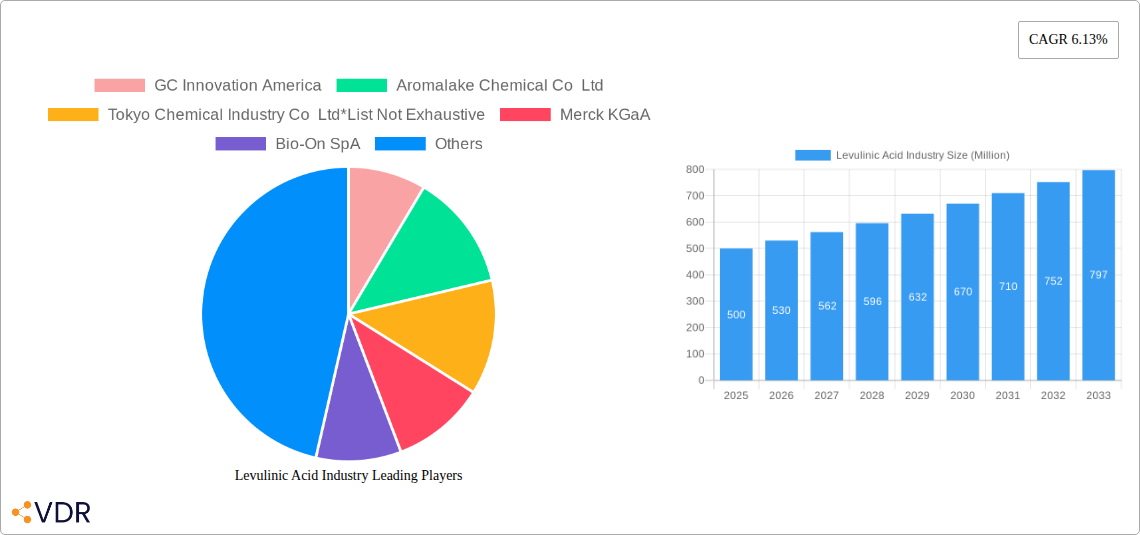
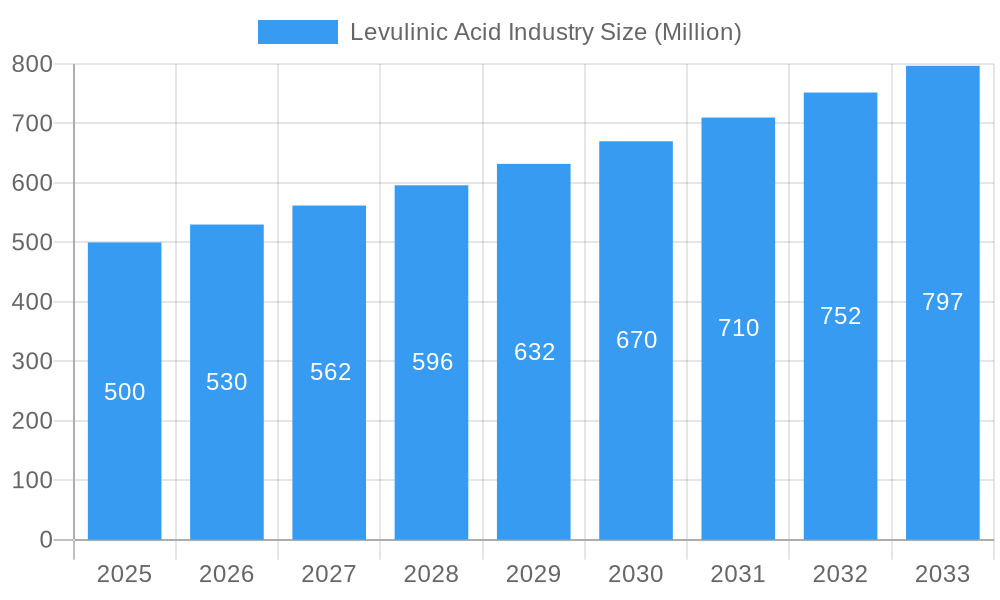
However, market growth may encounter certain challenges. Potential restraints include fluctuations in raw material prices, technological limitations in efficient production, and regulatory hurdles in certain regions impacting the adoption rate of levulinic acid-based products. Nevertheless, ongoing research and development efforts focusing on improved synthesis methods, expanded applications, and the growing awareness of sustainable alternatives are expected to mitigate these challenges. Companies such as GC Innovation America, Aromalake Chemical Co Ltd, and Merck KGaA are key players in this dynamic market, continually innovating to meet the burgeoning demand for levulinic acid and its derivatives across diverse industries. The market is poised for significant expansion over the forecast period, driven by ongoing innovation and a growing emphasis on sustainable chemicals.

Levulinic Acid Industry Research Report - Market Size, Growth & Forecast

Levulinic Acid Industry Market Report: 2019-2033

This comprehensive report provides a detailed analysis of the Levulinic Acid market, encompassing market dynamics, growth trends, regional segmentation, product landscape, key players, and future outlook. The study period covers 2019-2033, with 2025 as the base and estimated year. This report is essential for industry professionals, investors, and researchers seeking a deep understanding of this dynamic market.

Parent Market: Chemical Industry Child Market: Bio-based Chemicals

Levulinic Acid Industry Market Dynamics & Structure

The global levulinic acid market is characterized by moderate concentration, with several key players competing alongside smaller niche producers. Technological innovation, particularly in bio-based production methods, is a significant driver, while stringent regulatory frameworks concerning chemical safety and environmental impact influence market growth. The market faces competition from traditional petroleum-based chemical substitutes, although bio-based levulinic acid's sustainable profile is increasingly attracting customers. End-user demographics are diversifying, with growing demand from the cosmetics, pharmaceuticals, and bioplastics sectors. M&A activity has been relatively limited but is expected to increase as the market matures.

  • Market Concentration: Moderately concentrated, with a few dominant players and numerous smaller firms. xx% market share held by top 5 players (2024).
  • Technological Innovation: Focus on improving bio-based production efficiency and cost-effectiveness.
  • Regulatory Framework: Stringent regulations related to chemical safety and environmental sustainability.
  • Competitive Substitutes: Petroleum-based chemicals pose a competitive threat.
  • End-User Demographics: Growing demand from cosmetics, pharmaceuticals, and polymers sectors.
  • M&A Trends: Relatively low M&A activity, with potential for increased consolidation in the coming years.

Levulinic Acid Industry Growth Trends & Insights

The levulinic acid market experienced steady growth between 2019 and 2024, driven by increasing demand from various end-use sectors. The market size is projected to reach xx Million by 2025 and further expand at a Compound Annual Growth Rate (CAGR) of xx% during the forecast period (2025-2033). This growth is attributed to factors such as rising consumer preference for sustainable and bio-based products, technological advancements in production methods, and supportive government policies promoting bio-based chemicals. Market penetration is expected to increase significantly in emerging economies. Technological disruptions, such as advancements in fermentation technologies and improved catalyst systems, are further accelerating market growth. Shifting consumer behavior towards environmentally friendly products contributes to the increasing adoption rate of levulinic acid and its derivatives.

Levulinic Acid Industry Growth

Dominant Regions, Countries, or Segments in Levulinic Acid Industry

The North American region currently holds a leading position in the levulinic acid market, driven by strong demand from various end-use sectors, particularly in the United States. Europe follows closely, with significant growth potential fueled by government initiatives promoting sustainable chemistry and bio-based materials. Asia-Pacific is also emerging as a key market, benefiting from economic growth and rising demand for bio-based products.

Leading Segments:

  • Pharmaceuticals: Growing applications in drug synthesis and drug delivery systems are driving market expansion.
  • Polymers and Plasticizers: Demand for bio-based polymers and plasticizers is boosting segment growth.
  • Cosmetics and Personal Care: Increasing use in skincare and hair care products contributes to steady growth.

Key Regional Drivers:

  • North America: Strong demand from various industries, supportive government policies.
  • Europe: Government initiatives promoting sustainable chemistry, increasing adoption of bio-based products.
  • Asia-Pacific: Economic growth, rising demand for bio-based products, supportive government policies.

Levulinic Acid Industry Product Landscape

Levulinic acid is primarily available in various grades and purities depending on the end-use applications. Recent innovations focus on developing high-purity levulinic acid for specialized applications, such as pharmaceuticals, and cost-effective production processes using renewable feedstocks. Unique selling propositions include its biodegradability, renewability, and versatility as a building block for various chemicals and materials. Technological advancements in fermentation and catalysis are continuously improving production efficiency and reducing costs.

Key Drivers, Barriers & Challenges in Levulinic Acid Industry

Key Drivers:

  • Increasing demand for sustainable and bio-based products.
  • Growing applications in various end-use sectors.
  • Government support and incentives for bio-based chemicals.
  • Technological advancements in production processes.

Key Challenges:

  • High production costs compared to petroleum-based alternatives.
  • Limited availability of suitable feedstocks in some regions.
  • Stringent regulatory requirements for chemical safety and environmental impact.
  • Competition from established petroleum-based chemical substitutes. This competition impacts market share by approximately xx% annually.

Emerging Opportunities in Levulinic Acid Industry

Emerging opportunities lie in expanding applications in new sectors, such as biofuels and biodegradable plastics. Untapped markets in developing economies present significant growth potential. The development of innovative applications, such as specialized solvents and functional materials, will further drive market expansion. Evolving consumer preferences toward sustainable and environmentally friendly products are fueling increased demand.

Growth Accelerators in the Levulinic Acid Industry Industry

Technological advancements in bio-based production methods, particularly improved fermentation and catalytic processes, are crucial growth accelerators. Strategic partnerships between chemical producers and end-users, along with market expansion into new geographic regions and end-use sectors, will further propel market growth. The development of novel levulinic acid-derived products will open up new market opportunities.

Key Players Shaping the Levulinic Acid Industry Market

  • GC Innovation America
  • Aromalake Chemical Co Ltd
  • Tokyo Chemical Industry Co Ltd
  • Merck KGaA
  • Bio-On SpA
  • Boerchem Pharmtech Co Ltd
  • Alfa Aesar Thermo Fisher Scientific
  • AK Scientific Inc
  • GFBiochemicals Ltd
  • Ascender Chemical Co Ltd
  • Summit Cosmetics Corporation

Notable Milestones in Levulinic Acid Industry Sector

  • June 2022: GFBiochemicals partnered with BTC Europe GmbH (BASF's distribution arm) to distribute bio-based solvents derived from levulinic acid across the European market. This significantly expanded the market reach of GFBiochemicals' products and increased the visibility of bio-based levulinic acid alternatives.

In-Depth Levulinic Acid Industry Market Outlook

The levulinic acid market is poised for significant growth in the coming years, driven by the factors outlined above. The focus on sustainable and bio-based products, coupled with technological advancements, will create numerous strategic opportunities for existing players and new entrants. The increasing demand from diverse sectors promises strong future market potential, particularly in regions with supportive government policies and emerging economies.

Levulinic Acid Industry Segmentation

  • 1. End-user Industry
    • 1.1. Cosmetics and Personal Care
    • 1.2. Pharmaceuticals
    • 1.3. Polymers and Plasticizers
    • 1.4. Fuel and Fuel Additives
    • 1.5. Flavors and Fragrances
    • 1.6. Other End-user Industries

Levulinic Acid Industry Segmentation By Geography

  • 1. Asia Pacific
    • 1.1. China
    • 1.2. India
    • 1.3. Japan
    • 1.4. South Korea
    • 1.5. Rest of Asia Pacific
  • 2. North America
    • 2.1. United States
    • 2.2. Canada
    • 2.3. Mexico
  • 3. Europe
    • 3.1. Germany
    • 3.2. United Kingdom
    • 3.3. France
    • 3.4. Italy
    • 3.5. Rest of Europe
  • 4. South America
    • 4.1. Brazil
    • 4.2. Argentina
    • 4.3. Rest of South America
  • 5. Middle East and Africa
    • 5.1. Saudi Arabia
    • 5.2. South Africa
    • 5.3. Rest of Middle East and Africa
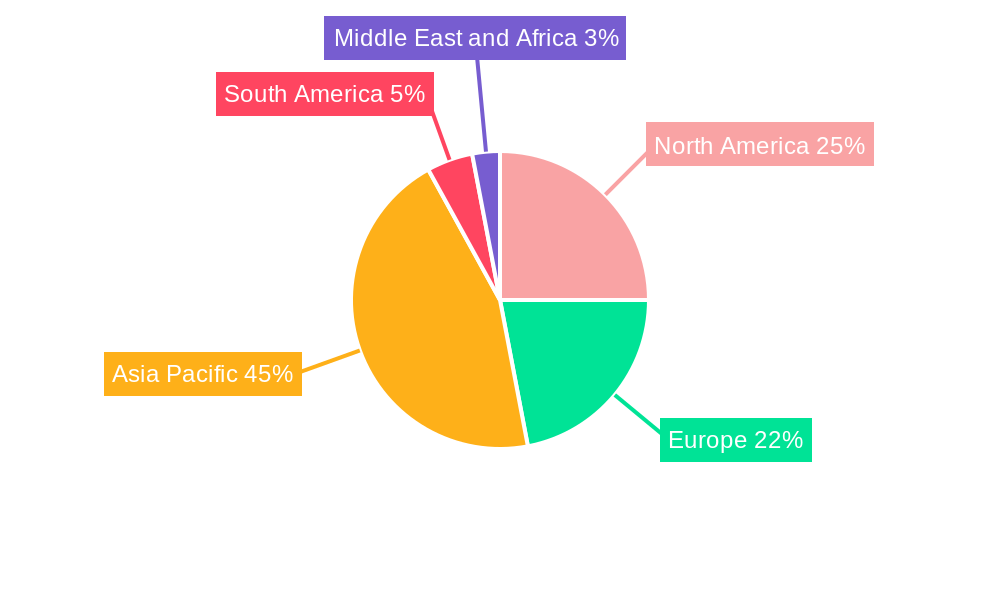
Levulinic Acid Industry Regional Share


Levulinic Acid Industry REPORT HIGHLIGHTS

AspectsDetails
Study Period 2019-2033
Base Year 2024
Estimated Year 2025
Forecast Period2025-2033
Historical Period2019-2024
Growth RateCAGR of 6.13% from 2019-2033
Segmentation
    • By End-user Industry
      • Cosmetics and Personal Care
      • Pharmaceuticals
      • Polymers and Plasticizers
      • Fuel and Fuel Additives
      • Flavors and Fragrances
      • Other End-user Industries
  • By Geography
    • Asia Pacific
      • China
      • India
      • Japan
      • South Korea
      • Rest of Asia Pacific
    • North America
      • United States
      • Canada
      • Mexico
    • Europe
      • Germany
      • United Kingdom
      • France
      • Italy
      • Rest of Europe
    • South America
      • Brazil
      • Argentina
      • Rest of South America
    • Middle East and Africa
      • Saudi Arabia
      • South Africa
      • Rest of Middle East and Africa


Table of Contents

  1. 1. Introduction
    • 1.1. Research Scope
    • 1.2. Market Segmentation
    • 1.3. Research Methodology
    • 1.4. Definitions and Assumptions
  2. 2. Executive Summary
    • 2.1. Introduction
  3. 3. Market Dynamics
    • 3.1. Introduction
      • 3.2. Market Drivers
        • 3.2.1. Increasing Usage as a Substitute for Traditional Fertilizer; Other Drivers
      • 3.3. Market Restrains
        • 3.3.1. Unfavorable Conditions Arising Due to the COVID-19 Impact
      • 3.4. Market Trends
        • 3.4.1. Cosmetics and Personal Care to Dominate the Market
  4. 4. Market Factor Analysis
    • 4.1. Porters Five Forces
    • 4.2. Supply/Value Chain
    • 4.3. PESTEL analysis
    • 4.4. Market Entropy
    • 4.5. Patent/Trademark Analysis
  5. 5. Global Levulinic Acid Industry Analysis, Insights and Forecast, 2019-2031
    • 5.1. Market Analysis, Insights and Forecast - by End-user Industry
      • 5.1.1. Cosmetics and Personal Care
      • 5.1.2. Pharmaceuticals
      • 5.1.3. Polymers and Plasticizers
      • 5.1.4. Fuel and Fuel Additives
      • 5.1.5. Flavors and Fragrances
      • 5.1.6. Other End-user Industries
    • 5.2. Market Analysis, Insights and Forecast - by Region
      • 5.2.1. Asia Pacific
      • 5.2.2. North America
      • 5.2.3. Europe
      • 5.2.4. South America
      • 5.2.5. Middle East and Africa
  6. 6. Asia Pacific Levulinic Acid Industry Analysis, Insights and Forecast, 2019-2031
    • 6.1. Market Analysis, Insights and Forecast - by End-user Industry
      • 6.1.1. Cosmetics and Personal Care
      • 6.1.2. Pharmaceuticals
      • 6.1.3. Polymers and Plasticizers
      • 6.1.4. Fuel and Fuel Additives
      • 6.1.5. Flavors and Fragrances
      • 6.1.6. Other End-user Industries
  7. 7. North America Levulinic Acid Industry Analysis, Insights and Forecast, 2019-2031
    • 7.1. Market Analysis, Insights and Forecast - by End-user Industry
      • 7.1.1. Cosmetics and Personal Care
      • 7.1.2. Pharmaceuticals
      • 7.1.3. Polymers and Plasticizers
      • 7.1.4. Fuel and Fuel Additives
      • 7.1.5. Flavors and Fragrances
      • 7.1.6. Other End-user Industries
  8. 8. Europe Levulinic Acid Industry Analysis, Insights and Forecast, 2019-2031
    • 8.1. Market Analysis, Insights and Forecast - by End-user Industry
      • 8.1.1. Cosmetics and Personal Care
      • 8.1.2. Pharmaceuticals
      • 8.1.3. Polymers and Plasticizers
      • 8.1.4. Fuel and Fuel Additives
      • 8.1.5. Flavors and Fragrances
      • 8.1.6. Other End-user Industries
  9. 9. South America Levulinic Acid Industry Analysis, Insights and Forecast, 2019-2031
    • 9.1. Market Analysis, Insights and Forecast - by End-user Industry
      • 9.1.1. Cosmetics and Personal Care
      • 9.1.2. Pharmaceuticals
      • 9.1.3. Polymers and Plasticizers
      • 9.1.4. Fuel and Fuel Additives
      • 9.1.5. Flavors and Fragrances
      • 9.1.6. Other End-user Industries
  10. 10. Middle East and Africa Levulinic Acid Industry Analysis, Insights and Forecast, 2019-2031
    • 10.1. Market Analysis, Insights and Forecast - by End-user Industry
      • 10.1.1. Cosmetics and Personal Care
      • 10.1.2. Pharmaceuticals
      • 10.1.3. Polymers and Plasticizers
      • 10.1.4. Fuel and Fuel Additives
      • 10.1.5. Flavors and Fragrances
      • 10.1.6. Other End-user Industries
  11. 11. Asia Pacific Levulinic Acid Industry Analysis, Insights and Forecast, 2019-2031
      • 11.1. Market Analysis, Insights and Forecast - By Country/Sub-region
        • 11.1.1 China
        • 11.1.2 India
        • 11.1.3 Japan
        • 11.1.4 South Korea
        • 11.1.5 Rest of Asia Pacific
  12. 12. North America Levulinic Acid Industry Analysis, Insights and Forecast, 2019-2031
      • 12.1. Market Analysis, Insights and Forecast - By Country/Sub-region
        • 12.1.1 United States
        • 12.1.2 Canada
        • 12.1.3 Mexico
  13. 13. Europe Levulinic Acid Industry Analysis, Insights and Forecast, 2019-2031
      • 13.1. Market Analysis, Insights and Forecast - By Country/Sub-region
        • 13.1.1 Germany
        • 13.1.2 United Kingdom
        • 13.1.3 France
        • 13.1.4 Italy
        • 13.1.5 Rest of Europe
  14. 14. South America Levulinic Acid Industry Analysis, Insights and Forecast, 2019-2031
      • 14.1. Market Analysis, Insights and Forecast - By Country/Sub-region
        • 14.1.1 Brazil
        • 14.1.2 Argentina
        • 14.1.3 Rest of South America
  15. 15. Middle East and Africa Levulinic Acid Industry Analysis, Insights and Forecast, 2019-2031
      • 15.1. Market Analysis, Insights and Forecast - By Country/Sub-region
        • 15.1.1 Saudi Arabia
        • 15.1.2 South Africa
        • 15.1.3 Rest of Middle East and Africa
  16. 16. Competitive Analysis
    • 16.1. Global Market Share Analysis 2024
      • 16.2. Company Profiles
        • 16.2.1 GC Innovation America
          • 16.2.1.1. Overview
          • 16.2.1.2. Products
          • 16.2.1.3. SWOT Analysis
          • 16.2.1.4. Recent Developments
          • 16.2.1.5. Financials (Based on Availability)
        • 16.2.2 Aromalake Chemical Co Ltd
          • 16.2.2.1. Overview
          • 16.2.2.2. Products
          • 16.2.2.3. SWOT Analysis
          • 16.2.2.4. Recent Developments
          • 16.2.2.5. Financials (Based on Availability)
        • 16.2.3 Tokyo Chemical Industry Co Ltd*List Not Exhaustive
          • 16.2.3.1. Overview
          • 16.2.3.2. Products
          • 16.2.3.3. SWOT Analysis
          • 16.2.3.4. Recent Developments
          • 16.2.3.5. Financials (Based on Availability)
        • 16.2.4 Merck KGaA
          • 16.2.4.1. Overview
          • 16.2.4.2. Products
          • 16.2.4.3. SWOT Analysis
          • 16.2.4.4. Recent Developments
          • 16.2.4.5. Financials (Based on Availability)
        • 16.2.5 Bio-On SpA
          • 16.2.5.1. Overview
          • 16.2.5.2. Products
          • 16.2.5.3. SWOT Analysis
          • 16.2.5.4. Recent Developments
          • 16.2.5.5. Financials (Based on Availability)
        • 16.2.6 Boerchem Pharmtech Co Ltd
          • 16.2.6.1. Overview
          • 16.2.6.2. Products
          • 16.2.6.3. SWOT Analysis
          • 16.2.6.4. Recent Developments
          • 16.2.6.5. Financials (Based on Availability)
        • 16.2.7 Alfa Aesar Thermo Fisher Scientific
          • 16.2.7.1. Overview
          • 16.2.7.2. Products
          • 16.2.7.3. SWOT Analysis
          • 16.2.7.4. Recent Developments
          • 16.2.7.5. Financials (Based on Availability)
        • 16.2.8 AK Scientific Inc
          • 16.2.8.1. Overview
          • 16.2.8.2. Products
          • 16.2.8.3. SWOT Analysis
          • 16.2.8.4. Recent Developments
          • 16.2.8.5. Financials (Based on Availability)
        • 16.2.9 GFBiochemicals Ltd
          • 16.2.9.1. Overview
          • 16.2.9.2. Products
          • 16.2.9.3. SWOT Analysis
          • 16.2.9.4. Recent Developments
          • 16.2.9.5. Financials (Based on Availability)
        • 16.2.10 Ascender Chemical Co Ltd
          • 16.2.10.1. Overview
          • 16.2.10.2. Products
          • 16.2.10.3. SWOT Analysis
          • 16.2.10.4. Recent Developments
          • 16.2.10.5. Financials (Based on Availability)
        • 16.2.11 Summit Cosmetics Corporation
          • 16.2.11.1. Overview
          • 16.2.11.2. Products
          • 16.2.11.3. SWOT Analysis
          • 16.2.11.4. Recent Developments
          • 16.2.11.5. Financials (Based on Availability)

List of Figures

  1. Figure 1: Global Levulinic Acid Industry Revenue Breakdown (Million, %) by Region 2024 & 2032
  2. Figure 2: Global Levulinic Acid Industry Volume Breakdown (kilotons, %) by Region 2024 & 2032
  3. Figure 3: Asia Pacific Levulinic Acid Industry Revenue (Million), by Country 2024 & 2032
  4. Figure 4: Asia Pacific Levulinic Acid Industry Volume (kilotons), by Country 2024 & 2032
  5. Figure 5: Asia Pacific Levulinic Acid Industry Revenue Share (%), by Country 2024 & 2032
  6. Figure 6: Asia Pacific Levulinic Acid Industry Volume Share (%), by Country 2024 & 2032
  7. Figure 7: North America Levulinic Acid Industry Revenue (Million), by Country 2024 & 2032
  8. Figure 8: North America Levulinic Acid Industry Volume (kilotons), by Country 2024 & 2032
  9. Figure 9: North America Levulinic Acid Industry Revenue Share (%), by Country 2024 & 2032
  10. Figure 10: North America Levulinic Acid Industry Volume Share (%), by Country 2024 & 2032
  11. Figure 11: Europe Levulinic Acid Industry Revenue (Million), by Country 2024 & 2032
  12. Figure 12: Europe Levulinic Acid Industry Volume (kilotons), by Country 2024 & 2032
  13. Figure 13: Europe Levulinic Acid Industry Revenue Share (%), by Country 2024 & 2032
  14. Figure 14: Europe Levulinic Acid Industry Volume Share (%), by Country 2024 & 2032
  15. Figure 15: South America Levulinic Acid Industry Revenue (Million), by Country 2024 & 2032
  16. Figure 16: South America Levulinic Acid Industry Volume (kilotons), by Country 2024 & 2032
  17. Figure 17: South America Levulinic Acid Industry Revenue Share (%), by Country 2024 & 2032
  18. Figure 18: South America Levulinic Acid Industry Volume Share (%), by Country 2024 & 2032
  19. Figure 19: Middle East and Africa Levulinic Acid Industry Revenue (Million), by Country 2024 & 2032
  20. Figure 20: Middle East and Africa Levulinic Acid Industry Volume (kilotons), by Country 2024 & 2032
  21. Figure 21: Middle East and Africa Levulinic Acid Industry Revenue Share (%), by Country 2024 & 2032
  22. Figure 22: Middle East and Africa Levulinic Acid Industry Volume Share (%), by Country 2024 & 2032
  23. Figure 23: Asia Pacific Levulinic Acid Industry Revenue (Million), by End-user Industry 2024 & 2032
  24. Figure 24: Asia Pacific Levulinic Acid Industry Volume (kilotons), by End-user Industry 2024 & 2032
  25. Figure 25: Asia Pacific Levulinic Acid Industry Revenue Share (%), by End-user Industry 2024 & 2032
  26. Figure 26: Asia Pacific Levulinic Acid Industry Volume Share (%), by End-user Industry 2024 & 2032
  27. Figure 27: Asia Pacific Levulinic Acid Industry Revenue (Million), by Country 2024 & 2032
  28. Figure 28: Asia Pacific Levulinic Acid Industry Volume (kilotons), by Country 2024 & 2032
  29. Figure 29: Asia Pacific Levulinic Acid Industry Revenue Share (%), by Country 2024 & 2032
  30. Figure 30: Asia Pacific Levulinic Acid Industry Volume Share (%), by Country 2024 & 2032
  31. Figure 31: North America Levulinic Acid Industry Revenue (Million), by End-user Industry 2024 & 2032
  32. Figure 32: North America Levulinic Acid Industry Volume (kilotons), by End-user Industry 2024 & 2032
  33. Figure 33: North America Levulinic Acid Industry Revenue Share (%), by End-user Industry 2024 & 2032
  34. Figure 34: North America Levulinic Acid Industry Volume Share (%), by End-user Industry 2024 & 2032
  35. Figure 35: North America Levulinic Acid Industry Revenue (Million), by Country 2024 & 2032
  36. Figure 36: North America Levulinic Acid Industry Volume (kilotons), by Country 2024 & 2032
  37. Figure 37: North America Levulinic Acid Industry Revenue Share (%), by Country 2024 & 2032
  38. Figure 38: North America Levulinic Acid Industry Volume Share (%), by Country 2024 & 2032
  39. Figure 39: Europe Levulinic Acid Industry Revenue (Million), by End-user Industry 2024 & 2032
  40. Figure 40: Europe Levulinic Acid Industry Volume (kilotons), by End-user Industry 2024 & 2032
  41. Figure 41: Europe Levulinic Acid Industry Revenue Share (%), by End-user Industry 2024 & 2032
  42. Figure 42: Europe Levulinic Acid Industry Volume Share (%), by End-user Industry 2024 & 2032
  43. Figure 43: Europe Levulinic Acid Industry Revenue (Million), by Country 2024 & 2032
  44. Figure 44: Europe Levulinic Acid Industry Volume (kilotons), by Country 2024 & 2032
  45. Figure 45: Europe Levulinic Acid Industry Revenue Share (%), by Country 2024 & 2032
  46. Figure 46: Europe Levulinic Acid Industry Volume Share (%), by Country 2024 & 2032
  47. Figure 47: South America Levulinic Acid Industry Revenue (Million), by End-user Industry 2024 & 2032
  48. Figure 48: South America Levulinic Acid Industry Volume (kilotons), by End-user Industry 2024 & 2032
  49. Figure 49: South America Levulinic Acid Industry Revenue Share (%), by End-user Industry 2024 & 2032
  50. Figure 50: South America Levulinic Acid Industry Volume Share (%), by End-user Industry 2024 & 2032
  51. Figure 51: South America Levulinic Acid Industry Revenue (Million), by Country 2024 & 2032
  52. Figure 52: South America Levulinic Acid Industry Volume (kilotons), by Country 2024 & 2032
  53. Figure 53: South America Levulinic Acid Industry Revenue Share (%), by Country 2024 & 2032
  54. Figure 54: South America Levulinic Acid Industry Volume Share (%), by Country 2024 & 2032
  55. Figure 55: Middle East and Africa Levulinic Acid Industry Revenue (Million), by End-user Industry 2024 & 2032
  56. Figure 56: Middle East and Africa Levulinic Acid Industry Volume (kilotons), by End-user Industry 2024 & 2032
  57. Figure 57: Middle East and Africa Levulinic Acid Industry Revenue Share (%), by End-user Industry 2024 & 2032
  58. Figure 58: Middle East and Africa Levulinic Acid Industry Volume Share (%), by End-user Industry 2024 & 2032
  59. Figure 59: Middle East and Africa Levulinic Acid Industry Revenue (Million), by Country 2024 & 2032
  60. Figure 60: Middle East and Africa Levulinic Acid Industry Volume (kilotons), by Country 2024 & 2032
  61. Figure 61: Middle East and Africa Levulinic Acid Industry Revenue Share (%), by Country 2024 & 2032
  62. Figure 62: Middle East and Africa Levulinic Acid Industry Volume Share (%), by Country 2024 & 2032

List of Tables

  1. Table 1: Global Levulinic Acid Industry Revenue Million Forecast, by Region 2019 & 2032
  2. Table 2: Global Levulinic Acid Industry Volume kilotons Forecast, by Region 2019 & 2032
  3. Table 3: Global Levulinic Acid Industry Revenue Million Forecast, by End-user Industry 2019 & 2032
  4. Table 4: Global Levulinic Acid Industry Volume kilotons Forecast, by End-user Industry 2019 & 2032
  5. Table 5: Global Levulinic Acid Industry Revenue Million Forecast, by Region 2019 & 2032
  6. Table 6: Global Levulinic Acid Industry Volume kilotons Forecast, by Region 2019 & 2032
  7. Table 7: Global Levulinic Acid Industry Revenue Million Forecast, by Country 2019 & 2032
  8. Table 8: Global Levulinic Acid Industry Volume kilotons Forecast, by Country 2019 & 2032
  9. Table 9: China Levulinic Acid Industry Revenue (Million) Forecast, by Application 2019 & 2032
  10. Table 10: China Levulinic Acid Industry Volume (kilotons) Forecast, by Application 2019 & 2032
  11. Table 11: India Levulinic Acid Industry Revenue (Million) Forecast, by Application 2019 & 2032
  12. Table 12: India Levulinic Acid Industry Volume (kilotons) Forecast, by Application 2019 & 2032
  13. Table 13: Japan Levulinic Acid Industry Revenue (Million) Forecast, by Application 2019 & 2032
  14. Table 14: Japan Levulinic Acid Industry Volume (kilotons) Forecast, by Application 2019 & 2032
  15. Table 15: South Korea Levulinic Acid Industry Revenue (Million) Forecast, by Application 2019 & 2032
  16. Table 16: South Korea Levulinic Acid Industry Volume (kilotons) Forecast, by Application 2019 & 2032
  17. Table 17: Rest of Asia Pacific Levulinic Acid Industry Revenue (Million) Forecast, by Application 2019 & 2032
  18. Table 18: Rest of Asia Pacific Levulinic Acid Industry Volume (kilotons) Forecast, by Application 2019 & 2032
  19. Table 19: Global Levulinic Acid Industry Revenue Million Forecast, by Country 2019 & 2032
  20. Table 20: Global Levulinic Acid Industry Volume kilotons Forecast, by Country 2019 & 2032
  21. Table 21: United States Levulinic Acid Industry Revenue (Million) Forecast, by Application 2019 & 2032
  22. Table 22: United States Levulinic Acid Industry Volume (kilotons) Forecast, by Application 2019 & 2032
  23. Table 23: Canada Levulinic Acid Industry Revenue (Million) Forecast, by Application 2019 & 2032
  24. Table 24: Canada Levulinic Acid Industry Volume (kilotons) Forecast, by Application 2019 & 2032
  25. Table 25: Mexico Levulinic Acid Industry Revenue (Million) Forecast, by Application 2019 & 2032
  26. Table 26: Mexico Levulinic Acid Industry Volume (kilotons) Forecast, by Application 2019 & 2032
  27. Table 27: Global Levulinic Acid Industry Revenue Million Forecast, by Country 2019 & 2032
  28. Table 28: Global Levulinic Acid Industry Volume kilotons Forecast, by Country 2019 & 2032
  29. Table 29: Germany Levulinic Acid Industry Revenue (Million) Forecast, by Application 2019 & 2032
  30. Table 30: Germany Levulinic Acid Industry Volume (kilotons) Forecast, by Application 2019 & 2032
  31. Table 31: United Kingdom Levulinic Acid Industry Revenue (Million) Forecast, by Application 2019 & 2032
  32. Table 32: United Kingdom Levulinic Acid Industry Volume (kilotons) Forecast, by Application 2019 & 2032
  33. Table 33: France Levulinic Acid Industry Revenue (Million) Forecast, by Application 2019 & 2032
  34. Table 34: France Levulinic Acid Industry Volume (kilotons) Forecast, by Application 2019 & 2032
  35. Table 35: Italy Levulinic Acid Industry Revenue (Million) Forecast, by Application 2019 & 2032
  36. Table 36: Italy Levulinic Acid Industry Volume (kilotons) Forecast, by Application 2019 & 2032
  37. Table 37: Rest of Europe Levulinic Acid Industry Revenue (Million) Forecast, by Application 2019 & 2032
  38. Table 38: Rest of Europe Levulinic Acid Industry Volume (kilotons) Forecast, by Application 2019 & 2032
  39. Table 39: Global Levulinic Acid Industry Revenue Million Forecast, by Country 2019 & 2032
  40. Table 40: Global Levulinic Acid Industry Volume kilotons Forecast, by Country 2019 & 2032
  41. Table 41: Brazil Levulinic Acid Industry Revenue (Million) Forecast, by Application 2019 & 2032
  42. Table 42: Brazil Levulinic Acid Industry Volume (kilotons) Forecast, by Application 2019 & 2032
  43. Table 43: Argentina Levulinic Acid Industry Revenue (Million) Forecast, by Application 2019 & 2032
  44. Table 44: Argentina Levulinic Acid Industry Volume (kilotons) Forecast, by Application 2019 & 2032
  45. Table 45: Rest of South America Levulinic Acid Industry Revenue (Million) Forecast, by Application 2019 & 2032
  46. Table 46: Rest of South America Levulinic Acid Industry Volume (kilotons) Forecast, by Application 2019 & 2032
  47. Table 47: Global Levulinic Acid Industry Revenue Million Forecast, by Country 2019 & 2032
  48. Table 48: Global Levulinic Acid Industry Volume kilotons Forecast, by Country 2019 & 2032
  49. Table 49: Saudi Arabia Levulinic Acid Industry Revenue (Million) Forecast, by Application 2019 & 2032
  50. Table 50: Saudi Arabia Levulinic Acid Industry Volume (kilotons) Forecast, by Application 2019 & 2032
  51. Table 51: South Africa Levulinic Acid Industry Revenue (Million) Forecast, by Application 2019 & 2032
  52. Table 52: South Africa Levulinic Acid Industry Volume (kilotons) Forecast, by Application 2019 & 2032
  53. Table 53: Rest of Middle East and Africa Levulinic Acid Industry Revenue (Million) Forecast, by Application 2019 & 2032
  54. Table 54: Rest of Middle East and Africa Levulinic Acid Industry Volume (kilotons) Forecast, by Application 2019 & 2032
  55. Table 55: Global Levulinic Acid Industry Revenue Million Forecast, by End-user Industry 2019 & 2032
  56. Table 56: Global Levulinic Acid Industry Volume kilotons Forecast, by End-user Industry 2019 & 2032
  57. Table 57: Global Levulinic Acid Industry Revenue Million Forecast, by Country 2019 & 2032
  58. Table 58: Global Levulinic Acid Industry Volume kilotons Forecast, by Country 2019 & 2032
  59. Table 59: China Levulinic Acid Industry Revenue (Million) Forecast, by Application 2019 & 2032
  60. Table 60: China Levulinic Acid Industry Volume (kilotons) Forecast, by Application 2019 & 2032
  61. Table 61: India Levulinic Acid Industry Revenue (Million) Forecast, by Application 2019 & 2032
  62. Table 62: India Levulinic Acid Industry Volume (kilotons) Forecast, by Application 2019 & 2032
  63. Table 63: Japan Levulinic Acid Industry Revenue (Million) Forecast, by Application 2019 & 2032
  64. Table 64: Japan Levulinic Acid Industry Volume (kilotons) Forecast, by Application 2019 & 2032
  65. Table 65: South Korea Levulinic Acid Industry Revenue (Million) Forecast, by Application 2019 & 2032
  66. Table 66: South Korea Levulinic Acid Industry Volume (kilotons) Forecast, by Application 2019 & 2032
  67. Table 67: Rest of Asia Pacific Levulinic Acid Industry Revenue (Million) Forecast, by Application 2019 & 2032
  68. Table 68: Rest of Asia Pacific Levulinic Acid Industry Volume (kilotons) Forecast, by Application 2019 & 2032
  69. Table 69: Global Levulinic Acid Industry Revenue Million Forecast, by End-user Industry 2019 & 2032
  70. Table 70: Global Levulinic Acid Industry Volume kilotons Forecast, by End-user Industry 2019 & 2032
  71. Table 71: Global Levulinic Acid Industry Revenue Million Forecast, by Country 2019 & 2032
  72. Table 72: Global Levulinic Acid Industry Volume kilotons Forecast, by Country 2019 & 2032
  73. Table 73: United States Levulinic Acid Industry Revenue (Million) Forecast, by Application 2019 & 2032
  74. Table 74: United States Levulinic Acid Industry Volume (kilotons) Forecast, by Application 2019 & 2032
  75. Table 75: Canada Levulinic Acid Industry Revenue (Million) Forecast, by Application 2019 & 2032
  76. Table 76: Canada Levulinic Acid Industry Volume (kilotons) Forecast, by Application 2019 & 2032
  77. Table 77: Mexico Levulinic Acid Industry Revenue (Million) Forecast, by Application 2019 & 2032
  78. Table 78: Mexico Levulinic Acid Industry Volume (kilotons) Forecast, by Application 2019 & 2032
  79. Table 79: Global Levulinic Acid Industry Revenue Million Forecast, by End-user Industry 2019 & 2032
  80. Table 80: Global Levulinic Acid Industry Volume kilotons Forecast, by End-user Industry 2019 & 2032
  81. Table 81: Global Levulinic Acid Industry Revenue Million Forecast, by Country 2019 & 2032
  82. Table 82: Global Levulinic Acid Industry Volume kilotons Forecast, by Country 2019 & 2032
  83. Table 83: Germany Levulinic Acid Industry Revenue (Million) Forecast, by Application 2019 & 2032
  84. Table 84: Germany Levulinic Acid Industry Volume (kilotons) Forecast, by Application 2019 & 2032
  85. Table 85: United Kingdom Levulinic Acid Industry Revenue (Million) Forecast, by Application 2019 & 2032
  86. Table 86: United Kingdom Levulinic Acid Industry Volume (kilotons) Forecast, by Application 2019 & 2032
  87. Table 87: France Levulinic Acid Industry Revenue (Million) Forecast, by Application 2019 & 2032
  88. Table 88: France Levulinic Acid Industry Volume (kilotons) Forecast, by Application 2019 & 2032
  89. Table 89: Italy Levulinic Acid Industry Revenue (Million) Forecast, by Application 2019 & 2032
  90. Table 90: Italy Levulinic Acid Industry Volume (kilotons) Forecast, by Application 2019 & 2032
  91. Table 91: Rest of Europe Levulinic Acid Industry Revenue (Million) Forecast, by Application 2019 & 2032
  92. Table 92: Rest of Europe Levulinic Acid Industry Volume (kilotons) Forecast, by Application 2019 & 2032
  93. Table 93: Global Levulinic Acid Industry Revenue Million Forecast, by End-user Industry 2019 & 2032
  94. Table 94: Global Levulinic Acid Industry Volume kilotons Forecast, by End-user Industry 2019 & 2032
  95. Table 95: Global Levulinic Acid Industry Revenue Million Forecast, by Country 2019 & 2032
  96. Table 96: Global Levulinic Acid Industry Volume kilotons Forecast, by Country 2019 & 2032
  97. Table 97: Brazil Levulinic Acid Industry Revenue (Million) Forecast, by Application 2019 & 2032
  98. Table 98: Brazil Levulinic Acid Industry Volume (kilotons) Forecast, by Application 2019 & 2032
  99. Table 99: Argentina Levulinic Acid Industry Revenue (Million) Forecast, by Application 2019 & 2032
  100. Table 100: Argentina Levulinic Acid Industry Volume (kilotons) Forecast, by Application 2019 & 2032
  101. Table 101: Rest of South America Levulinic Acid Industry Revenue (Million) Forecast, by Application 2019 & 2032
  102. Table 102: Rest of South America Levulinic Acid Industry Volume (kilotons) Forecast, by Application 2019 & 2032
  103. Table 103: Global Levulinic Acid Industry Revenue Million Forecast, by End-user Industry 2019 & 2032
  104. Table 104: Global Levulinic Acid Industry Volume kilotons Forecast, by End-user Industry 2019 & 2032
  105. Table 105: Global Levulinic Acid Industry Revenue Million Forecast, by Country 2019 & 2032
  106. Table 106: Global Levulinic Acid Industry Volume kilotons Forecast, by Country 2019 & 2032
  107. Table 107: Saudi Arabia Levulinic Acid Industry Revenue (Million) Forecast, by Application 2019 & 2032
  108. Table 108: Saudi Arabia Levulinic Acid Industry Volume (kilotons) Forecast, by Application 2019 & 2032
  109. Table 109: South Africa Levulinic Acid Industry Revenue (Million) Forecast, by Application 2019 & 2032
  110. Table 110: South Africa Levulinic Acid Industry Volume (kilotons) Forecast, by Application 2019 & 2032
  111. Table 111: Rest of Middle East and Africa Levulinic Acid Industry Revenue (Million) Forecast, by Application 2019 & 2032
  112. Table 112: Rest of Middle East and Africa Levulinic Acid Industry Volume (kilotons) Forecast, by Application 2019 & 2032


Frequently Asked Questions

1. What is the projected Compound Annual Growth Rate (CAGR) of the Levulinic Acid Industry?

The projected CAGR is approximately 6.13%.

2. Which companies are prominent players in the Levulinic Acid Industry?

Key companies in the market include GC Innovation America, Aromalake Chemical Co Ltd, Tokyo Chemical Industry Co Ltd*List Not Exhaustive, Merck KGaA, Bio-On SpA, Boerchem Pharmtech Co Ltd, Alfa Aesar Thermo Fisher Scientific, AK Scientific Inc, GFBiochemicals Ltd, Ascender Chemical Co Ltd, Summit Cosmetics Corporation.

3. What are the main segments of the Levulinic Acid Industry?

The market segments include End-user Industry.

4. Can you provide details about the market size?

The market size is estimated to be USD XX Million as of 2022.

5. What are some drivers contributing to market growth?

Increasing Usage as a Substitute for Traditional Fertilizer; Other Drivers.

6. What are the notable trends driving market growth?

Cosmetics and Personal Care to Dominate the Market.

7. Are there any restraints impacting market growth?

Unfavorable Conditions Arising Due to the COVID-19 Impact.

8. Can you provide examples of recent developments in the market?

June 2022: GFBiochemicals agreed with German chemical giant BASF's European distribution organization, BTC Europe GmbH, on distributing biobased and biodegradable solvents derived from levulinic acid for the European market.

9. What pricing options are available for accessing the report?

Pricing options include single-user, multi-user, and enterprise licenses priced at USD 4750, USD 5250, and USD 8750 respectively.

10. Is the market size provided in terms of value or volume?

The market size is provided in terms of value, measured in Million and volume, measured in kilotons.

11. Are there any specific market keywords associated with the report?

Yes, the market keyword associated with the report is "Levulinic Acid Industry," which aids in identifying and referencing the specific market segment covered.

12. How do I determine which pricing option suits my needs best?

The pricing options vary based on user requirements and access needs. Individual users may opt for single-user licenses, while businesses requiring broader access may choose multi-user or enterprise licenses for cost-effective access to the report.

13. Are there any additional resources or data provided in the Levulinic Acid Industry report?

While the report offers comprehensive insights, it's advisable to review the specific contents or supplementary materials provided to ascertain if additional resources or data are available.

14. How can I stay updated on further developments or reports in the Levulinic Acid Industry?

To stay informed about further developments, trends, and reports in the Levulinic Acid Industry, consider subscribing to industry newsletters, following relevant companies and organizations, or regularly checking reputable industry news sources and publications.


Methodology

Step 1 - Identification of Relevant Samples Size from Population Database

Step Chart
Bar Chart
Method Chart

Step 2 - Approaches for Defining Global Market Size (Value, Volume* & Price*)

Approach Chart
Top-down and bottom-up approaches are used to validate the global market size and estimate the market size for manufactures, regional segments, product, and application.

Note*: In applicable scenarios

Step 3 - Data Sources

Primary Research

  • Web Analytics
  • Survey Reports
  • Research Institute
  • Latest Research Reports
  • Opinion Leaders

Secondary Research

  • Annual Reports
  • White Paper
  • Latest Press Release
  • Industry Association
  • Paid Database
  • Investor Presentations
Analyst Chart

Step 4 - Data Triangulation

Involves using different sources of information in order to increase the validity of a study

These sources are likely to be stakeholders in a program - participants, other researchers, program staff, other community members, and so on.

Then we put all data in single framework & apply various statistical tools to find out the dynamic on the market.

During the analysis stage, feedback from the stakeholder groups would be compared to determine areas of agreement as well as areas of divergence

Additionally, after gathering mixed and scattered data from a wide range of sources, data is triangulated and correlated to come up with estimated figures which are further validated through primary mediums or industry experts, opinion leaders.

About Visionary Data Reports

Visionary Data Reports provides future-focused market research, advanced analytics, and strategic insights for technology, healthcare, green energy, and finance. Our reports help you anticipate trends, innovate, and lead in your industry. Our expert team combines primary research, data science, and industry knowledge to deliver actionable intelligence. We offer syndicated reports, custom analytics, and consulting services tailored to your business needs. At Visionary Data Reports, we are committed to quality, transparency, and client satisfaction. Every report is rigorously validated to ensure accuracy and relevance. Our global perspective and forward-thinking approach help you understand both current and emerging market dynamics.

Stay ahead with Visionary Data Reports. Subscribe to our newsletter for the latest insights and research highlights, and follow us on social media for real-time updates. Visionary Data Reports – Your Guide to Tomorrow’s Opportunities.

  • Home
  • About Us
  • Industries
    • Aerospace & Defense
    • Agriculture
    • Animal Nutrition & Wellness
    • Automotive
    • Chemicals & Materials
    • Consumer Goods and Services
    • Energy & Power
    • Financial Services and Investment Intelligence
    • Food & Beverage
    • Home and Property Improvement
    • Hospitality and Tourism
    • Logistics
    • Manufacturing Products and Services
    • Packaging
    • Professional and Commercial Services
    • Real Estate and Construction
    • Retail
    • Technology, Media and Telecom
    • Healthcare
  • Services
  • Contact
Main Logo
  • Home
  • About Us
  • Industries
    • Aerospace & Defense
    • Agriculture
    • Animal Nutrition & Wellness
    • Automotive
    • Chemicals & Materials
    • Consumer Goods and Services
    • Energy & Power
    • Financial Services and Investment Intelligence
    • Food & Beverage
    • Home and Property Improvement
    • Hospitality and Tourism
    • Logistics
    • Manufacturing Products and Services
    • Packaging
    • Professional and Commercial Services
    • Real Estate and Construction
    • Retail
    • Technology, Media and Telecom
    • Healthcare
  • Services
  • Contact
+17162654855
[email protected]

+17162654855

[email protected]

artwork spiralartwork spiralRelated Reports
artwork underline

Exploring Growth Patterns in Aerospace Coatings Market Market

Explore the dynamic Aerospace Coatings Market, driven by growing aviation demand and advanced technologies. Discover market size, CAGR trends, key players, and regional insights for 2025-2033.

September 2025
Base Year: 2024
No Of Pages: 180
Price: $4750

Asia-Pacific Construction Chemicals Market 2025-2033 Market Analysis: Trends, Dynamics, and Growth Opportunities

The size of the Asia-Pacific Construction Chemicals Market market was valued at USD XX Million in 2024 and is projected to reach USD XXX Million by 2033, with an expected CAGR of 4.00">> 4.00% during the forecast period.

September 2025
Base Year: 2024
No Of Pages: 140
Price: $3800

Vinyl Acetate Industry Drivers of Growth: Opportunities to 2033

Explore the dynamic Vinyl Acetate market's projected growth, driven by solar, automotive, and construction sectors. Discover key trends, restraints, and regional opportunities, with a focus on Polyvinyl Acetate, Polyvinyl Alcohol, and EVA.

September 2025
Base Year: 2024
No Of Pages: 180
Price: $4750

C9 Resin Market CAGR Growth Drivers and Trends: Forecasts 2025-2033

Explore the dynamic C9 Resin Market, with a projected market size of $11.65 billion in 2025 and a strong CAGR of 6.5% through 2033. Discover growth drivers, regional trends, and key applications in adhesives, coatings, and more.

September 2025
Base Year: 2024
No Of Pages: 180
Price: $4750

Copper Magnet Wire Market Strategic Insights for 2025 and Forecasts to 2033: Market Trends

The Copper Magnet Wire Market is booming, projected to exceed a 5% CAGR through 2033, driven by electric vehicles and renewable energy. Discover key trends, regional insights, and leading companies shaping this dynamic industry. Explore the market analysis now!

August 2025
Base Year: 2024
No Of Pages: 150
Price: $4750

Bio Acetic Acid Industry Market Outlook and Strategic Insights

Discover the booming bio-acetic acid market! This in-depth analysis reveals a $220.6M (2025) market projected for significant growth (CAGR >4%) driven by sustainability and diverse applications. Explore key trends, regional insights, and leading companies shaping this dynamic industry.

August 2025
Base Year: 2024
No Of Pages: 180
Price: $4750

Qatar Passenger Vehicle Lubricant Market Market Predictions and Opportunities 2025-2033

Discover the growth potential of the Qatar passenger vehicle lubricant market. This in-depth analysis reveals market size, CAGR (4.04%), key drivers, trends, and restraints impacting engine oils, greases, hydraulic fluids, and transmission oils. Leading companies and regional insights are included. Project your business strategies with our 2019-2033 forecast.

August 2025
Base Year: 2024
No Of Pages: 197
Price: $3800

Singapore Automotive Lubricants Industry Analysis 2025 and Forecasts 2033: Unveiling Growth Opportunities

Discover the booming Singapore automotive lubricants market! This in-depth analysis reveals a CAGR of 4.14%, driven by increasing vehicle ownership and advanced technologies. Explore market size, key players (ExxonMobil, Shell, FUCHS, etc.), and future trends shaping this dynamic sector from 2025-2033.

August 2025
Base Year: 2024
No Of Pages: 180
Price: $3800

Saturated Polyester Resins Market Projected to Grow at XX CAGR: Insights and Forecasts 2025-2033

The saturated polyester resins market is booming, projected to reach $7.39 billion by 2033 with a 4.24% CAGR. Driven by automotive, packaging, and industrial coatings demand, this market analysis explores key trends, restraints, and leading companies like Evonik and Arkema. Discover regional market shares and future growth projections.

August 2025
Base Year: 2024
No Of Pages: 150
Price: $4750

Middle-East and Africa Sodium Sulfide Industry Market Drivers and Challenges: Trends 2025-2033

Discover the booming Middle East & Africa sodium sulfide market! Our in-depth analysis reveals a CAGR exceeding 1.5%, driven by water treatment, pulp & paper, and textile industries. Explore key trends, restraints, and leading players shaping this dynamic sector.

August 2025
Base Year: 2024
No Of Pages: 140
Price: $4750

South Africa Protective Coatings Market Market Dynamics: Drivers and Barriers to Growth 2025-2033

Discover the booming South African protective coatings market! Our in-depth analysis reveals a $123.67M market in 2025, projected for strong growth driven by infrastructure, mining, and oil & gas. Explore market trends, segmentation (acrylic, epoxy, waterborne coatings etc.), key players, and future forecasts to 2033.

August 2025
Base Year: 2024
No Of Pages: 180
Price: $3800

Unlocking Insights for Marble Market Growth Strategies

Discover the booming global marble market! This comprehensive analysis reveals a $20.81B market in 2025, projected to grow at a 4.61% CAGR through 2033. Learn about key drivers, trends, restraints, leading companies (Antolini, Levantina), and regional market shares. Explore the opportunities and challenges in this lucrative sector.

August 2025
Base Year: 2024
No Of Pages: 234
Price: $4750

Automotive Plastics Industry Market Analysis and Growth Roadmap

Discover the booming automotive plastics market, projected to reach \$XXX million by 2033 with a CAGR exceeding 10%. Explore key drivers, trends, and regional insights, including the impact of EVs and sustainable materials. Learn about leading players like BASF, LANXESS, and ExxonMobil.

August 2025
Base Year: 2024
No Of Pages: 234
Price: $4750

Consumer Trends Driving India Passenger Vehicles Lubricants Market Market Growth

Discover the booming India Passenger Vehicles Lubricants Market! This in-depth analysis reveals a CAGR of 6.14% driven by rising vehicle sales and demand for high-performance lubricants. Learn about key players, market trends, and future growth projections.

August 2025
Base Year: 2024
No Of Pages: 197
Price: $3800

Exploring Battery Anode Materials Market Market Ecosystem: Insights to 2033

Discover the booming Battery Anode Materials market analysis! Explore key trends, drivers, restraints, and regional growth projections for 2025-2033, featuring insights on lithium, silicon, graphite, and leading companies. Learn about the significant CAGR and potential for investment in this rapidly expanding sector.

August 2025
Base Year: 2024
No Of Pages: 234
Price: $4750

Glass Insulation Market Market Report: Strategic Insights

Discover the booming glass insulation market! Learn about its 6%+ CAGR, key drivers like energy efficiency regulations, leading companies like Saint-Gobain & PPG Industries, and future trends shaping this multi-billion dollar industry through 2033. Get insights into market size, segmentation, and regional growth projections.

August 2025
Base Year: 2024
No Of Pages: 234
Price: $4750

Emerging Trends in Europe Insulated Concrete Form (ICF) Market: A Technology Perspective 2025-2033

The European Insulated Concrete Form (ICF) market is booming, projected to exceed €1.5 billion by 2033, driven by energy efficiency demands and sustainable construction trends. This analysis explores market size, growth drivers, key players, and regional trends across Germany, UK, France, and other European nations. Discover the latest insights into ICF materials, applications, and future opportunities.

August 2025
Base Year: 2024
No Of Pages: 180
Price: $4750

TPS Industry Market Expansion: Growth Outlook 2025-2033

Discover the booming thermoplastic starch (TPS) market! This comprehensive analysis reveals a 7.39% CAGR, driven by eco-conscious consumers and sustainable packaging needs. Explore market size, regional trends, key players (Kuraray, Rodenburg), and future projections through 2033. Learn about extrusion molding, injection molding, and applications in bags, films, and 3D printing.

August 2025
Base Year: 2024
No Of Pages: 150
Price: $4750

Advanced Carbon Products Industry Planning for the Future: Key Trends 2025-2033

Discover the booming advanced carbon products market! This comprehensive analysis reveals a 9.82% CAGR, driven by aerospace, automotive, and electronics demands. Explore market size, segmentation, key players, and future trends in carbon fibers, graphene, and more. Invest in the future of materials science.

August 2025
Base Year: 2024
No Of Pages: 180
Price: $4750

Speciality Chemicals Market: Harnessing Emerging Innovations for Growth 2025-2033

The global specialty chemicals market is booming, projected to reach [estimated 2033 value based on CAGR] by 2033. Driven by construction, electronics, and sustainable solutions, this market analysis reveals key trends, segments (water treatment, adhesives, plastics, etc.), leading companies, and regional growth. Discover insights into CAGR, market size, and future projections.

August 2025
Base Year: 2024
No Of Pages: 150
Price: $4750

United States Commercial Vehicles Lubricants Market Insightful Analysis: Trends, Competitor Dynamics, and Opportunities 2025-2033

Discover the latest insights into the booming US Commercial Vehicles Lubricants Market. This comprehensive analysis reveals market size, growth projections (2025-2033), key players (ExxonMobil, Castrol, Shell, etc.), and emerging trends in engine oils, greases, and other lubricants for commercial vehicles. Learn about market drivers, restraints, and regional breakdowns.

August 2025
Base Year: 2024
No Of Pages: 180
Price: $3800

Glass-Ceramics Industry Market Overview: Growth and Insights

Discover the booming glass-ceramics market forecast to 2033! Explore key drivers, trends, and regional analysis revealing a CAGR exceeding 6%. Learn about leading companies and applications in building, electronics, and healthcare. Get insights into market size and segmentation.

August 2025
Base Year: 2024
No Of Pages: 180
Price: $4750

Exploring Regional Dynamics of Primer Market Market 2025-2033

Discover the booming primer market's potential! Our in-depth analysis reveals a $21.34B market in 2025, growing at a 5.91% CAGR until 2033, driven by automotive, construction, and industrial sectors. Explore key trends, leading companies, and regional insights to capitalize on this lucrative opportunity.

August 2025
Base Year: 2024
No Of Pages: 234
Price: $3,950

Future Trends Shaping US Activated Carbon Market Growth

Discover the booming US Activated Carbon Market! This in-depth analysis reveals key trends, growth drivers (water purification, gas purification), and leading companies from 2019-2033, including Cabot, Calgon Carbon, and Kuraray. Learn about market segmentation, regional variations, and future projections for this vital industry.

August 2025
Base Year: 2024
No Of Pages: 197
Price: $3800

Engineered Wood Industry Growth Forecast and Consumer Insights

Discover the booming engineered wood market! Our analysis reveals a CAGR exceeding 5%, driven by sustainable construction and innovative materials. Learn about key players, market trends, and future projections for LVL, OSB, CLT, and more in this comprehensive report.

August 2025
Base Year: 2024
No Of Pages: 234
Price: $4750

Understanding Growth Challenges in Silicone Surfactants Market Market 2025-2033

Discover the booming silicone surfactants market, projected to exceed $3 billion by 2033. Explore key drivers, trends, and leading companies shaping this dynamic industry. Learn about regional growth and market segmentation for informed investment decisions.

August 2025
Base Year: 2024
No Of Pages: 234
Price: $4750

Consumer Behavior and Self-Healing Coatings Market Trends

The self-healing coatings market is booming, projected to reach $2.71B in 2025 with a CAGR exceeding 21%! Discover key trends, drivers, and leading companies shaping this innovative sector across automotive, aerospace, and construction. Explore market segmentation and regional analysis for insightful investment opportunities.

August 2025
Base Year: 2024
No Of Pages: 150
Price: $4750

Silane Industry Charting Growth Trajectories: Analysis and Forecasts 2025-2033

Discover the booming silane market! This comprehensive analysis reveals a $319.39 million market in 2025, projected to grow at a 5.7% CAGR through 2033, driven by construction, automotive, and electronics applications. Explore key trends, restraints, and regional insights for silanes in plastics, rubber, coatings, and more.

August 2025
Base Year: 2024
No Of Pages: 180
Price: $4750

Paints and Protective Coatings in Nigerian Market Competitive Strategies: Trends and Forecasts 2025-2033

Discover the booming Nigerian paints and protective coatings market! This in-depth analysis reveals a CAGR exceeding 4%, driven by infrastructure growth and rising demand. Explore market segmentation, key players (Akzo Nobel, PPG Industries, Berger Paints), and future trends impacting this lucrative sector. Learn how to capitalize on opportunities in this rapidly expanding market.

August 2025
Base Year: 2024
No Of Pages: 180
Price: $3800

Analyzing Consumer Behavior in Pervious Concrete Market Market

Discover the booming pervious concrete market, projected to exceed a CAGR of 6% through 2033. This in-depth analysis explores market drivers, trends, restraints, and key players shaping this sustainable construction material's future. Learn about regional growth, application segments, and investment opportunities in the pervious concrete industry.

August 2025
Base Year: 2024
No Of Pages: 234
Price: $4750

Thermal Spray Equipment Industry Unlocking Growth Opportunities: Analysis and Forecast 2025-2033

The global thermal spray equipment market is booming, projected to reach [estimated 2033 value] by 2033, with a CAGR of 5.11%. Discover key market trends, leading companies, and regional growth opportunities in this in-depth analysis of thermal spray coating systems, dust collection equipment, and more.

August 2025
Base Year: 2024
No Of Pages: 180
Price: $4750

Deep Dive into Europe, Middle-East and Africa Hot-melt Adhesives Market: Comprehensive Growth Analysis 2025-2033

Discover the booming EMEA hot-melt adhesives market! This in-depth analysis reveals a CAGR exceeding 5.5%, driven by construction, packaging, and footwear industries. Learn about key trends, major players like Huntsman and Henkel, and future growth projections for 2025-2033.

August 2025
Base Year: 2024
No Of Pages: 234
Price: $4750

Africa Engineering Plastics Market Market Dynamics and Growth Analysis

The Africa Engineering Plastics Market is booming, projected to reach $3.5 billion by 2033 with a 7% CAGR. Driven by infrastructure development and automotive growth, this report analyzes market trends, key players (Covestro, Indorama), and regional opportunities in North and Sub-Saharan Africa.

August 2025
Base Year: 2024
No Of Pages: 197
Price: $3800

South America Polyurethane (PU) Hot-melt Adhesives Market Market’s Growth Catalysts

Discover the booming South American Polyurethane (PU) Hot-melt Adhesives market! This in-depth analysis reveals a CAGR exceeding 6%, driven by packaging, automotive, and healthcare growth. Explore market trends, key players (Henkel, 3M, BASF), and regional breakdowns (Brazil, Argentina). Learn about the future of PU hot-melt adhesives in South America.

August 2025
Base Year: 2024
No Of Pages: 234
Price: $4750

Strategic Insights into Cooling Water Treatment Chemicals Market Market Trends

The Cooling Water Treatment Chemicals market is booming, projected to reach \$18.8B by 2033 with a CAGR of 5.8%. This in-depth analysis explores market drivers, trends, restraints, and key players like Ecolab and Kemira across key regions including North America, Europe, and Asia-Pacific. Learn more about this lucrative market opportunity.

August 2025
Base Year: 2024
No Of Pages: 180
Price: $3,950

5-Hydroxytryptophan (5-HTP) Market 2025-2033 Trends: Unveiling Growth Opportunities and Competitor Dynamics

Discover the booming 5-HTP market forecast to 2033! This comprehensive analysis reveals key drivers, trends, and regional breakdowns, including insights into leading companies and applications in dietary supplements, food & beverage, and medical sectors. Learn about the CAGR, market size, and future growth potential of 5-Hydroxytryptophan.

August 2025
Base Year: 2024
No Of Pages: 234
Price: $4750

Superhydrophobic Coating Market Unlocking Growth Potential: Analysis and Forecasts 2025-2033

Discover the booming superhydrophobic coating market! Our in-depth analysis reveals impressive growth projections (2025-2033) driven by innovation in self-cleaning surfaces, anti-icing, and corrosion prevention. Learn about market size, CAGR, regional trends, and key applications in automotive, aerospace, and construction.

August 2025
Base Year: 2024
No Of Pages: 234
Price: $4750

Europe Waterborne Adhesives Industry Market’s Evolution: Key Growth Drivers 2025-2033

Discover the booming European waterborne adhesives market! This in-depth analysis reveals key trends, drivers, and restraints impacting growth through 2033. Explore market size, segmentation (acrylics, PVA, EVA), top players (Henkel, 3M, Sika), and regional insights. Learn how sustainability and construction are shaping this €5B+ market.

August 2025
Base Year: 2024
No Of Pages: 234
Price: $4750

Colombia Automotive Lubricants Industry Competitive Strategies: Trends and Forecasts 2025-2033

Discover the booming Colombian automotive lubricants market! This in-depth analysis reveals a projected CAGR of 4.90% to 2033, driven by rising vehicle sales and demand for high-performance lubricants. Learn about key players, market segmentation, and future growth opportunities in this dynamic sector.

August 2025
Base Year: 2024
No Of Pages: 197
Price: $3800

Hot-melt Adhesives Market in Europe Insightful Market Analysis: Trends and Opportunities 2025-2033

Discover the booming European hot-melt adhesives market! This comprehensive analysis reveals key trends, drivers, and restraints shaping this €2.5 billion market (2025 est.), with a CAGR exceeding 5.5% through 2033. Explore market segmentation, leading companies, and regional growth projections.

August 2025
Base Year: 2024
No Of Pages: 150
Price: $4750

Thermal Barrier Coatings Market in Focus: Growth Trajectories and Strategic Insights 2025-2033

The Thermal Barrier Coatings (TBC) market is booming, projected to reach $1.7 billion by 2033 with a 4.31% CAGR. Driven by aerospace, automotive, and power generation needs, this report analyzes market trends, key players (Honeywell, Saint-Gobain), regional insights, and future growth potential. Discover market segmentation and investment opportunities in TBC technology.

August 2025
Base Year: 2024
No Of Pages: 234
Price: $4750

North America Thermal Spray Equipment Market in Emerging Markets: Analysis and Projections 2025-2033

Discover the booming North American thermal spray equipment market! This comprehensive analysis reveals a CAGR exceeding 7%, driven by aerospace, automotive, and energy sector growth. Explore key trends, leading companies, and future projections for this lucrative industry.

August 2025
Base Year: 2024
No Of Pages: 234
Price: $4750

Growth Strategies in USA Surface Water Treatment Chemicals Industry Market: 2025-2033 Outlook

Discover the booming US surface water treatment chemicals market. Our comprehensive analysis reveals a $3.5 billion market in 2025, projected to reach $5.2 billion by 2033, driven by stringent regulations & technological advancements. Explore key trends and growth forecasts for coagulants, disinfectants, and more.

August 2025
Base Year: 2024
No Of Pages: 120
Price: $3,950

Market Projections for Low VOC Paint Market Industry 2025-2033

Discover the booming low VOC paint market! Explore its $8.84B valuation, 5.60%+ CAGR, key drivers, regional breakdowns (North America, Europe, Asia Pacific), top companies, and future trends in this comprehensive market analysis. Learn about water-borne vs. solvent-borne formulations and the impact of environmental regulations.

August 2025
Base Year: 2024
No Of Pages: 180
Price: $4750

Decorative Laminates Industry Report Probes the XXX Million Size, Share, Growth Report and Future Analysis by 2033

Discover the booming decorative laminates market! Explore key trends, drivers, and restraints shaping this $25 billion+ industry. Learn about leading companies, regional growth projections, and the future of this dynamic sector. Get insights into furniture, flooring, and construction applications.

August 2025
Base Year: 2024
No Of Pages: 234
Price: $4750

Future-Ready Strategies for Paraphenylenediamine Market Market Growth

Discover the latest market trends and growth forecasts for the paraphenylenediamine (PPD) market. This comprehensive analysis covers key drivers, restraints, regional segments (Asia Pacific, North America, Europe), major players (DuPont, LANXESS), and future projections through 2033, highlighting opportunities in dyes, rubber, and aramid fiber applications.

August 2025
Base Year: 2024
No Of Pages: 234
Price: $4750

Consumer Behavior and Calcium Peroxide Industry Trends

Discover the booming Calcium Peroxide market! Explore its $2.36B valuation, 3.64% CAGR, key applications (bleaching, food processing, seed treatment), top players, and regional growth projections to 2033. Gain insights for investment and strategic planning.

August 2025
Base Year: 2024
No Of Pages: 234
Price: $4750

Understanding Growth Challenges in Ultra High Performance Concrete (UHPC) Market Market 2025-2033

The Ultra High Performance Concrete (UHPC) market is booming, projected to reach \$532.55 million in 2025 and grow at a CAGR exceeding 8% through 2033. Discover key drivers, trends, and top companies shaping this dynamic sector. Learn more about UHPC applications in infrastructure and construction.

August 2025
Base Year: 2024
No Of Pages: 234
Price: $4750

Overcoming Challenges in Iran Commercial Vehicle Lubricant Industry Market: Strategic Insights 2025-2033

Discover the growth trajectory of Iran's commercial vehicle lubricant market. Our analysis reveals a steady CAGR of 2.14%, driven by infrastructure development and increased vehicle numbers. Learn about key players, regional trends, and future projections to 2033.

August 2025
Base Year: 2024
No Of Pages: 197
Price: $3800

Drivers of Change in MEA Engineering Plastics Industry Market 2025-2033

Discover the booming MEA Engineering Plastics market! This comprehensive analysis reveals key trends, growth drivers (infrastructure, automotive), restraints, and leading companies from 2019-2033, projecting a CAGR exceeding 5%. Learn about regional market shares in Saudi Arabia, UAE, and beyond. Invest wisely in this high-growth sector.

August 2025
Base Year: 2024
No Of Pages: 234
Price: $4750

Business Address

Head Office

Ansec House 3 rd floor Tank Road, Yerwada, Pune, Maharashtra 411014

Contact Information

Craig Francis

Business Development Head

+17162654855

[email protected]

Secure Payment Partners

payment image
RetailLogisticsPackagingAutomotiveHealthcareAgricultureEnergy & PowerFood & BeverageAerospace & DefenseChemicals & MaterialsHospitality and TourismAnimal Nutrition & WellnessConsumer Goods and ServicesReal Estate and ConstructionHome and Property ImprovementTechnology, Media and TelecomManufacturing Products and ServicesFinancial Services and Investment Intelligence

© 2025 PRDUA Research & Media Private Limited, All rights reserved

Privacy Policy
Terms and Conditions
FAQ