
Key Insights
The global LED television market is experiencing robust growth, projected to reach an estimated market size of $130 billion by 2025. This expansion is fueled by a compound annual growth rate (CAGR) of approximately 8% from 2025 to 2033, indicating sustained demand for advanced display technologies. A key driver is the increasing consumer preference for larger screen sizes, with 55-inch and 65-inch models gaining significant traction due to their immersive viewing experiences, especially with the proliferation of 4K and 8K content. Furthermore, the continuous innovation in LED display technology, including advancements in picture quality, energy efficiency, and smart features, is compelling consumers to upgrade their existing television sets. The residential sector remains the dominant application, driven by home entertainment needs and the growing adoption of smart homes. However, the commercial segment, encompassing hospitality, retail, and public display applications, is also witnessing substantial growth, spurred by the demand for digital signage and interactive displays.
Despite the optimistic outlook, certain factors could temper the market's trajectory. The report identifies supply chain disruptions and the rising cost of raw materials as potential restraints. Fluctuations in the prices of components like LED chips and display panels can impact manufacturing costs and, consequently, retail prices, potentially affecting consumer purchasing power. Moreover, intense competition among major players, including Samsung, LG, Sony, and TCL, is driving down prices for certain models, which, while beneficial for consumers, can put pressure on profit margins for manufacturers. Geographically, the Asia Pacific region, particularly China and India, is expected to lead the market in terms of both production and consumption, owing to a large population, increasing disposable incomes, and a growing middle class with a strong appetite for consumer electronics. North America and Europe will continue to be significant markets, driven by technological adoption and a mature consumer base.
LED Televisions Market Dynamics & Structure
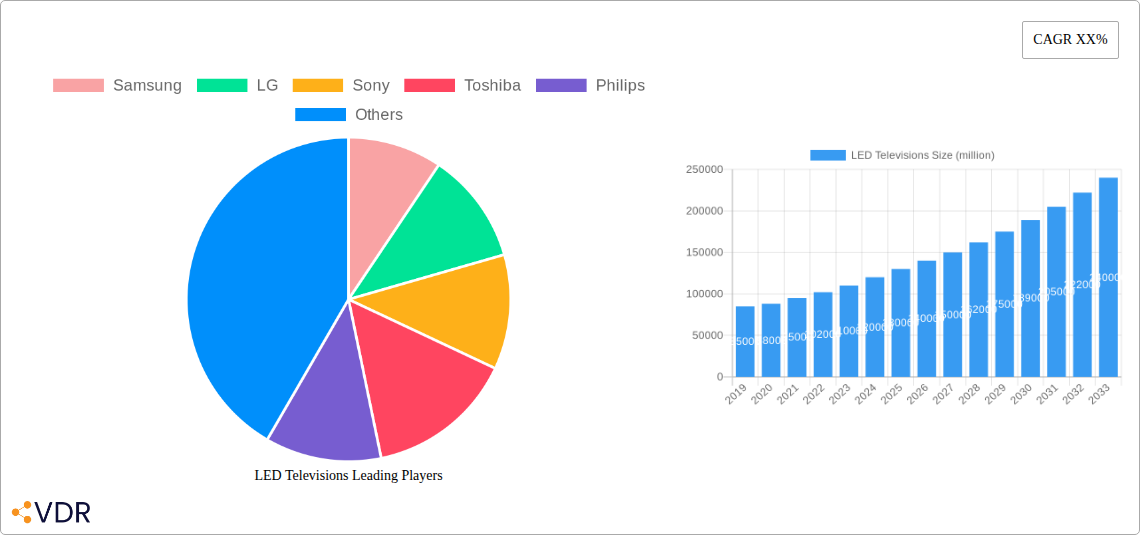
The global LED television market is characterized by a highly competitive landscape dominated by established players such as Samsung, LG, Sony, TCL, and Hisense. Market concentration remains high, with these key companies collectively holding a significant share of the global market. Technological innovation is the primary driver, with continuous advancements in display technology, smart features, and enhanced picture quality fueling consumer demand. The residential segment represents the largest application, driven by increasing disposable incomes and the demand for home entertainment solutions. Regulatory frameworks, primarily focused on energy efficiency standards and product safety, play a crucial role in shaping product development and market entry. Competitive product substitutes, while present in the form of OLED and QLED technologies (often considered advanced LED variants), have not significantly eroded the LED TV market's dominance due to their cost-effectiveness and widespread availability. End-user demographics are shifting towards younger, tech-savvy consumers seeking smart connectivity and immersive viewing experiences. Mergers and acquisitions (M&A) activity, though moderate, has been strategic, aimed at consolidating market share, acquiring new technologies, or expanding geographical reach.
- Market Share Dominance: Top 5 players hold approximately 70% of the global market.
- Technological Innovation Drivers: Mini-LED, Micro-LED advancements, AI picture processing, and enhanced refresh rates.
- Regulatory Focus: Energy efficiency mandates (e.g., Energy Star ratings) and content certification standards.
- Competitive Substitutes: OLED and QLED technologies are advanced segments often considered within the broader LED TV market analysis.
- End-User Demographics: Growing demand from millennials and Gen Z for smart features and content streaming.
- M&A Trends: Strategic acquisitions for patent portfolios and market access in emerging economies.
LED Televisions Growth Trends & Insights
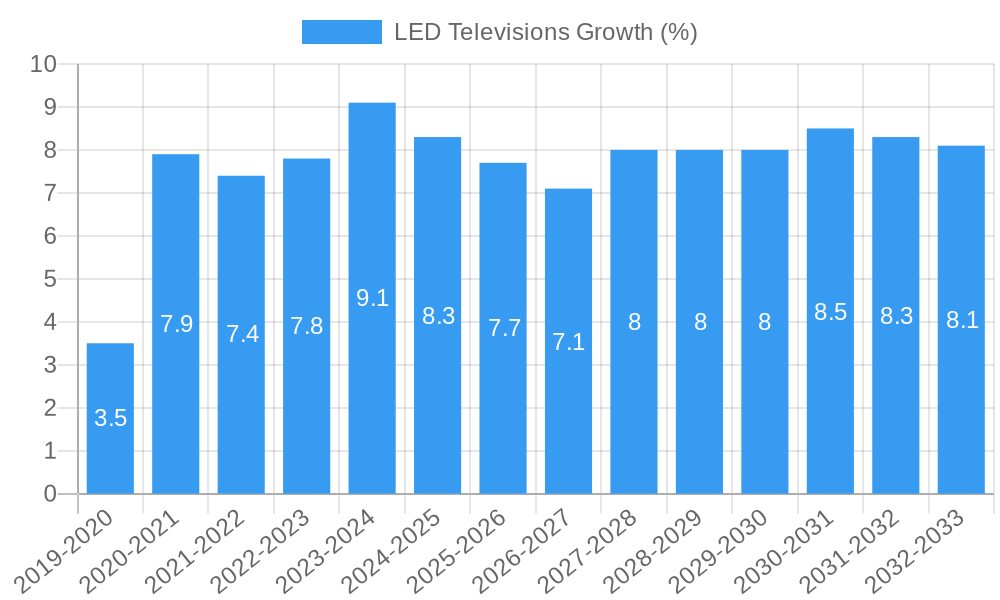
The global LED television market is poised for sustained growth, driven by a confluence of technological advancements, evolving consumer preferences, and increasing adoption across both residential and commercial sectors. The market size is projected to expand from an estimated $110,500 million units in 2025 to reach $135,000 million units by 2033, exhibiting a Compound Annual Growth Rate (CAGR) of approximately 2.5% during the forecast period (2025–2033). This growth trajectory is underpinned by consistent innovation in display technologies. The introduction of Mini-LED and Micro-LED technologies, offering superior brightness, contrast, and color accuracy, is a key catalyst, attracting consumers seeking premium viewing experiences. While these advanced variants might command higher price points, their integration is expanding the overall value of the LED TV market.
Consumer behavior is undergoing a significant shift, with an increasing emphasis on large screen sizes, smart functionalities, and content streaming capabilities. The proliferation of Over-The-Top (OTT) platforms has amplified the demand for televisions that offer seamless connectivity and an immersive viewing experience. Consequently, adoption rates for larger screen sizes, particularly those exceeding 55 inches, are witnessing robust growth. The market penetration of smart TVs, equipped with integrated internet connectivity and application support, has reached saturation levels in developed economies and is rapidly expanding in emerging markets.
Technological disruptions are not limited to picture quality; advancements in sound technology, connectivity standards (like Wi-Fi 6 and HDMI 2.1), and energy efficiency are also shaping consumer purchasing decisions. The study period, encompassing 2019–2033, with a base year of 2025 and a historical perspective from 2019–2024, highlights a resilient market that has navigated supply chain challenges and economic fluctuations. The 2019–2024 historical period saw the market solidify its position through continuous product refreshes and the widespread adoption of 4K technology. The estimated year of 2025 serves as a crucial benchmark, reflecting current market conditions before the forecasted growth phase. The continuous refinement of LED backlighting technology, alongside the increasing adoption of AI-powered image processing, ensures that LED televisions remain a compelling choice for a broad spectrum of consumers.
Dominant Regions, Countries, or Segments in LED Televisions
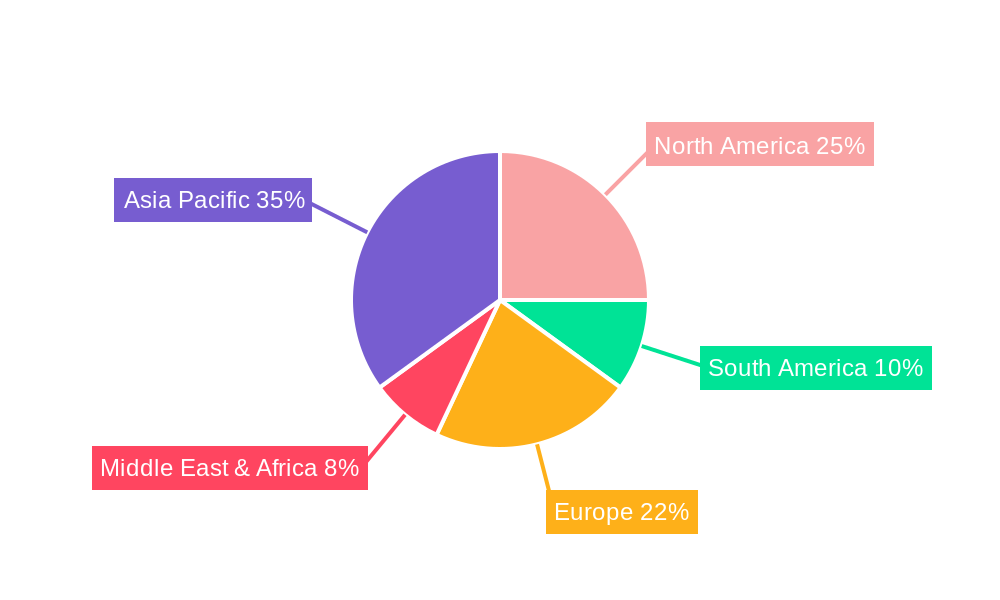
The global LED television market’s dominance is multifaceted, with specific regions, countries, and product segments acting as key growth engines. Asia Pacific consistently emerges as the leading region, driven by its massive population, rapidly growing middle class, and increasing disposable incomes in countries like China, India, and South Korea. These nations are not only significant consumers but also major manufacturing hubs for LED televisions, contributing to competitive pricing and technological advancements. The burgeoning economic development and increasing urbanization across the region fuel the demand for advanced home entertainment solutions, making LED TVs an integral part of modern households.
Within the Application segment, the Residential sector unequivocally dominates the market. This is primarily due to the ubiquitous nature of televisions as a primary source of entertainment in homes worldwide. Factors such as the increasing adoption of smart home technologies, the growing popularity of streaming services, and the desire for immersive viewing experiences for movies, sports, and gaming are propelling demand in this segment. The Commercial application segment, while smaller, is also experiencing steady growth, driven by demand for digital signage, interactive displays in retail spaces, and conferencing solutions in corporate environments. However, the sheer volume of household penetration ensures the residential sector remains the primary growth driver.
In terms of Types, the 55-inch and 65-inch segments are currently exhibiting the most significant growth and are pivotal to market expansion. These larger screen sizes cater to the increasing consumer preference for cinematic experiences at home and are becoming increasingly accessible due to falling prices and advancements in display technology. While smaller screen sizes (45-inch, 50-inch) continue to hold a considerable market share, particularly in price-sensitive markets, the growth trajectory is more pronounced for these larger diagonals. The "Others" category, which includes even larger screen sizes (70 inches and above), is also a rapidly growing niche, catering to high-end consumers and commercial installations. Economic policies promoting domestic manufacturing, coupled with robust retail infrastructure and increasing consumer spending power, are key drivers behind the dominance of Asia Pacific. Furthermore, government initiatives promoting digital literacy and access to technology further bolster the adoption rates of LED televisions across these dominant segments.
LED Televisions Product Landscape
The LED television product landscape is defined by relentless innovation focused on enhancing visual fidelity and user experience. Manufacturers are pushing the boundaries with advanced backlighting technologies like Mini-LED, which allows for more precise local dimming, resulting in deeper blacks and brighter highlights. This translates to superior contrast ratios and a more dynamic picture, ideal for HDR content. Smart functionalities are now standard, with integrated operating systems offering seamless access to streaming apps, web browsing, and voice control. Enhanced refresh rates and response times are crucial for gaming enthusiasts, ensuring smooth motion clarity. Unique selling propositions often revolve around AI-powered picture and sound optimization, energy efficiency, and sleek, minimalist designs that complement modern living spaces. Technological advancements are continuously miniaturizing components and improving pixel density, paving the way for even more immersive and detailed viewing experiences.
Key Drivers, Barriers & Challenges in LED Televisions
Key Drivers:
- Technological Advancements: Continuous improvements in LED backlighting, Quantum Dot technology, and high refresh rates are enhancing picture quality and user experience, driving consumer upgrades.
- Growing Demand for Smart Features: The proliferation of streaming services and the integration of AI and voice control are making smart TVs indispensable for modern households.
- Declining Average Selling Prices (ASPs): Increased competition and manufacturing efficiencies are making larger screen sizes and more advanced features accessible to a broader consumer base.
- Expanding Entertainment Ecosystem: The growth of OTT platforms, gaming, and immersive content creation fuels the demand for high-quality display devices.
- Energy Efficiency Standards: Evolving regulations are pushing manufacturers to develop more energy-efficient LED TVs, appealing to environmentally conscious consumers.
Barriers & Challenges:
- Intense Market Competition: The highly saturated market leads to price wars and shrinking profit margins for manufacturers.
- Supply Chain Disruptions: Geopolitical events, component shortages (especially semiconductors), and logistics issues can impact production and lead to price volatility.
- Maturing Developed Markets: In regions with high penetration rates, growth relies heavily on replacement cycles and premium feature adoption.
- Emergence of Alternative Display Technologies: While LED dominates, advancements in OLED and Micro-LED could eventually pose a more significant challenge to market share in the premium segment.
- Economic Slowdowns: Global economic downturns can reduce consumer discretionary spending, impacting demand for consumer electronics like LED TVs.
Emerging Opportunities in LED Televisions
Emerging opportunities in the LED television sector lie in the continued refinement of display technologies and the expansion into new application areas. The development of even more granular backlighting solutions, such as advanced Micro-LED implementations, promises unparalleled picture quality and opens doors for ultra-premium home cinema experiences. The integration of advanced AI features for personalized content recommendations and intelligent home management systems represents a significant avenue for differentiation. Furthermore, the growing demand for larger screen sizes in both residential and commercial spaces, particularly for digital signage, immersive retail displays, and enhanced meeting room solutions, presents a substantial growth opportunity. The "gamification" of home entertainment, with TVs becoming central hubs for interactive experiences, also offers untapped potential for specialized gaming-focused television models with ultra-low latency and high refresh rates.
Growth Accelerators in the LED Televisions Industry
Several key catalysts are accelerating long-term growth in the LED televisions industry. The relentless pace of technological innovation, particularly in Mini-LED and Micro-LED advancements, is consistently raising the bar for picture quality and creating upgrade cycles. Strategic partnerships between television manufacturers, content providers, and semiconductor companies are crucial for optimizing integrated experiences and driving adoption of new features. Market expansion into emerging economies, where LED TV penetration is still growing, offers a significant runway for volume growth. The increasing affordability of larger screen sizes, driven by manufacturing efficiencies and economies of scale, makes premium viewing experiences accessible to a wider demographic. Furthermore, the growing trend towards home-centric entertainment, amplified by advancements in streaming technology and virtual reality integration, solidifies the television's role as a central entertainment hub.
Key Players Shaping the LED Televisions Market
- Samsung
- LG
- Sony
- Toshiba
- Philips
- Panasonic
- Haier
- Sharp Corporation
- MI
- Vizio
- Hisense
- TCL
Notable Milestones in LED Televisions Sector
- 2019: Introduction of 8K resolution LED TVs by multiple manufacturers, showcasing nascent ultra-high-definition capabilities.
- 2020: Widespread adoption of Wi-Fi 6 and HDMI 2.1 standards in flagship models, enabling faster connectivity and enhanced gaming performance.
- 2021: Significant advancements and increased market availability of Mini-LED backlighting technology, offering improved contrast and brightness.
- 2022: Increased integration of advanced AI picture processing algorithms for enhanced realism and personalized viewing experiences.
- 2023: Continued focus on sustainability with improved energy efficiency ratings and the use of more recyclable materials in product design.
- 2024: Expansion of Micro-LED technology into more accessible (though still premium) consumer models, hinting at future display dominance.
In-Depth LED Televisions Market Outlook
The LED televisions market is poised for robust expansion, driven by ongoing technological innovation and evolving consumer demands for immersive and connected entertainment experiences. Growth accelerators such as the refinement of Mini-LED and Micro-LED technologies, alongside the increasing adoption of smart features and AI-powered functionalities, will continue to fuel upgrade cycles and attract new consumers. Strategic partnerships and market expansion into emerging economies will further bolster market volume. The trend towards larger screen sizes and enhanced gaming capabilities will remain a significant driver, solidifying the LED TV's position as the central hub of the modern home entertainment ecosystem. The market outlook is highly positive, with continuous innovation ensuring the LED television remains a dominant and evolving force in the global consumer electronics landscape.
LED Televisions Segmentation
-
1. Application
- 1.1. Residential
- 1.2. Commercial
- 1.3. Others
-
2. Types
- 2.1. 45 Inches
- 2.2. 50 Inches
- 2.3. 55 Inches
- 2.4. 60 Inches
- 2.5. 65 Inches
- 2.6. Others
LED Televisions Segmentation By Geography
-
1. North America
- 1.1. United States
- 1.2. Canada
- 1.3. Mexico
-
2. South America
- 2.1. Brazil
- 2.2. Argentina
- 2.3. Rest of South America
-
3. Europe
- 3.1. United Kingdom
- 3.2. Germany
- 3.3. France
- 3.4. Italy
- 3.5. Spain
- 3.6. Russia
- 3.7. Benelux
- 3.8. Nordics
- 3.9. Rest of Europe
-
4. Middle East & Africa
- 4.1. Turkey
- 4.2. Israel
- 4.3. GCC
- 4.4. North Africa
- 4.5. South Africa
- 4.6. Rest of Middle East & Africa
-
5. Asia Pacific
- 5.1. China
- 5.2. India
- 5.3. Japan
- 5.4. South Korea
- 5.5. ASEAN
- 5.6. Oceania
- 5.7. Rest of Asia Pacific
LED Televisions REPORT HIGHLIGHTS
| Aspects | Details |
|---|---|
| Study Period | 2019-2033 |
| Base Year | 2024 |
| Estimated Year | 2025 |
| Forecast Period | 2025-2033 |
| Historical Period | 2019-2024 |
| Growth Rate | CAGR of XX% from 2019-2033 |
| Segmentation |
|
Table of Contents
- 1. Introduction
- 1.1. Research Scope
- 1.2. Market Segmentation
- 1.3. Research Methodology
- 1.4. Definitions and Assumptions
- 2. Executive Summary
- 2.1. Introduction
- 3. Market Dynamics
- 3.1. Introduction
- 3.2. Market Drivers
- 3.3. Market Restrains
- 3.4. Market Trends
- 4. Market Factor Analysis
- 4.1. Porters Five Forces
- 4.2. Supply/Value Chain
- 4.3. PESTEL analysis
- 4.4. Market Entropy
- 4.5. Patent/Trademark Analysis
- 5. Global LED Televisions Analysis, Insights and Forecast, 2019-2031
- 5.1. Market Analysis, Insights and Forecast - by Application
- 5.1.1. Residential
- 5.1.2. Commercial
- 5.1.3. Others
- 5.2. Market Analysis, Insights and Forecast - by Types
- 5.2.1. 45 Inches
- 5.2.2. 50 Inches
- 5.2.3. 55 Inches
- 5.2.4. 60 Inches
- 5.2.5. 65 Inches
- 5.2.6. Others
- 5.3. Market Analysis, Insights and Forecast - by Region
- 5.3.1. North America
- 5.3.2. South America
- 5.3.3. Europe
- 5.3.4. Middle East & Africa
- 5.3.5. Asia Pacific
- 5.1. Market Analysis, Insights and Forecast - by Application
- 6. North America LED Televisions Analysis, Insights and Forecast, 2019-2031
- 6.1. Market Analysis, Insights and Forecast - by Application
- 6.1.1. Residential
- 6.1.2. Commercial
- 6.1.3. Others
- 6.2. Market Analysis, Insights and Forecast - by Types
- 6.2.1. 45 Inches
- 6.2.2. 50 Inches
- 6.2.3. 55 Inches
- 6.2.4. 60 Inches
- 6.2.5. 65 Inches
- 6.2.6. Others
- 6.1. Market Analysis, Insights and Forecast - by Application
- 7. South America LED Televisions Analysis, Insights and Forecast, 2019-2031
- 7.1. Market Analysis, Insights and Forecast - by Application
- 7.1.1. Residential
- 7.1.2. Commercial
- 7.1.3. Others
- 7.2. Market Analysis, Insights and Forecast - by Types
- 7.2.1. 45 Inches
- 7.2.2. 50 Inches
- 7.2.3. 55 Inches
- 7.2.4. 60 Inches
- 7.2.5. 65 Inches
- 7.2.6. Others
- 7.1. Market Analysis, Insights and Forecast - by Application
- 8. Europe LED Televisions Analysis, Insights and Forecast, 2019-2031
- 8.1. Market Analysis, Insights and Forecast - by Application
- 8.1.1. Residential
- 8.1.2. Commercial
- 8.1.3. Others
- 8.2. Market Analysis, Insights and Forecast - by Types
- 8.2.1. 45 Inches
- 8.2.2. 50 Inches
- 8.2.3. 55 Inches
- 8.2.4. 60 Inches
- 8.2.5. 65 Inches
- 8.2.6. Others
- 8.1. Market Analysis, Insights and Forecast - by Application
- 9. Middle East & Africa LED Televisions Analysis, Insights and Forecast, 2019-2031
- 9.1. Market Analysis, Insights and Forecast - by Application
- 9.1.1. Residential
- 9.1.2. Commercial
- 9.1.3. Others
- 9.2. Market Analysis, Insights and Forecast - by Types
- 9.2.1. 45 Inches
- 9.2.2. 50 Inches
- 9.2.3. 55 Inches
- 9.2.4. 60 Inches
- 9.2.5. 65 Inches
- 9.2.6. Others
- 9.1. Market Analysis, Insights and Forecast - by Application
- 10. Asia Pacific LED Televisions Analysis, Insights and Forecast, 2019-2031
- 10.1. Market Analysis, Insights and Forecast - by Application
- 10.1.1. Residential
- 10.1.2. Commercial
- 10.1.3. Others
- 10.2. Market Analysis, Insights and Forecast - by Types
- 10.2.1. 45 Inches
- 10.2.2. 50 Inches
- 10.2.3. 55 Inches
- 10.2.4. 60 Inches
- 10.2.5. 65 Inches
- 10.2.6. Others
- 10.1. Market Analysis, Insights and Forecast - by Application
- 11. Competitive Analysis
- 11.1. Global Market Share Analysis 2024
- 11.2. Company Profiles
- 11.2.1 Samsung
- 11.2.1.1. Overview
- 11.2.1.2. Products
- 11.2.1.3. SWOT Analysis
- 11.2.1.4. Recent Developments
- 11.2.1.5. Financials (Based on Availability)
- 11.2.2 LG
- 11.2.2.1. Overview
- 11.2.2.2. Products
- 11.2.2.3. SWOT Analysis
- 11.2.2.4. Recent Developments
- 11.2.2.5. Financials (Based on Availability)
- 11.2.3 Sony
- 11.2.3.1. Overview
- 11.2.3.2. Products
- 11.2.3.3. SWOT Analysis
- 11.2.3.4. Recent Developments
- 11.2.3.5. Financials (Based on Availability)
- 11.2.4 Toshiba
- 11.2.4.1. Overview
- 11.2.4.2. Products
- 11.2.4.3. SWOT Analysis
- 11.2.4.4. Recent Developments
- 11.2.4.5. Financials (Based on Availability)
- 11.2.5 Philips
- 11.2.5.1. Overview
- 11.2.5.2. Products
- 11.2.5.3. SWOT Analysis
- 11.2.5.4. Recent Developments
- 11.2.5.5. Financials (Based on Availability)
- 11.2.6 Panasonic
- 11.2.6.1. Overview
- 11.2.6.2. Products
- 11.2.6.3. SWOT Analysis
- 11.2.6.4. Recent Developments
- 11.2.6.5. Financials (Based on Availability)
- 11.2.7 Haier
- 11.2.7.1. Overview
- 11.2.7.2. Products
- 11.2.7.3. SWOT Analysis
- 11.2.7.4. Recent Developments
- 11.2.7.5. Financials (Based on Availability)
- 11.2.8 Sharp Corporation
- 11.2.8.1. Overview
- 11.2.8.2. Products
- 11.2.8.3. SWOT Analysis
- 11.2.8.4. Recent Developments
- 11.2.8.5. Financials (Based on Availability)
- 11.2.9 MI
- 11.2.9.1. Overview
- 11.2.9.2. Products
- 11.2.9.3. SWOT Analysis
- 11.2.9.4. Recent Developments
- 11.2.9.5. Financials (Based on Availability)
- 11.2.10 Vizio
- 11.2.10.1. Overview
- 11.2.10.2. Products
- 11.2.10.3. SWOT Analysis
- 11.2.10.4. Recent Developments
- 11.2.10.5. Financials (Based on Availability)
- 11.2.11 Hisense
- 11.2.11.1. Overview
- 11.2.11.2. Products
- 11.2.11.3. SWOT Analysis
- 11.2.11.4. Recent Developments
- 11.2.11.5. Financials (Based on Availability)
- 11.2.12 TCL
- 11.2.12.1. Overview
- 11.2.12.2. Products
- 11.2.12.3. SWOT Analysis
- 11.2.12.4. Recent Developments
- 11.2.12.5. Financials (Based on Availability)
- 11.2.1 Samsung
List of Figures
- Figure 1: Global LED Televisions Revenue Breakdown (million, %) by Region 2024 & 2032
- Figure 2: Global LED Televisions Volume Breakdown (K, %) by Region 2024 & 2032
- Figure 3: North America LED Televisions Revenue (million), by Application 2024 & 2032
- Figure 4: North America LED Televisions Volume (K), by Application 2024 & 2032
- Figure 5: North America LED Televisions Revenue Share (%), by Application 2024 & 2032
- Figure 6: North America LED Televisions Volume Share (%), by Application 2024 & 2032
- Figure 7: North America LED Televisions Revenue (million), by Types 2024 & 2032
- Figure 8: North America LED Televisions Volume (K), by Types 2024 & 2032
- Figure 9: North America LED Televisions Revenue Share (%), by Types 2024 & 2032
- Figure 10: North America LED Televisions Volume Share (%), by Types 2024 & 2032
- Figure 11: North America LED Televisions Revenue (million), by Country 2024 & 2032
- Figure 12: North America LED Televisions Volume (K), by Country 2024 & 2032
- Figure 13: North America LED Televisions Revenue Share (%), by Country 2024 & 2032
- Figure 14: North America LED Televisions Volume Share (%), by Country 2024 & 2032
- Figure 15: South America LED Televisions Revenue (million), by Application 2024 & 2032
- Figure 16: South America LED Televisions Volume (K), by Application 2024 & 2032
- Figure 17: South America LED Televisions Revenue Share (%), by Application 2024 & 2032
- Figure 18: South America LED Televisions Volume Share (%), by Application 2024 & 2032
- Figure 19: South America LED Televisions Revenue (million), by Types 2024 & 2032
- Figure 20: South America LED Televisions Volume (K), by Types 2024 & 2032
- Figure 21: South America LED Televisions Revenue Share (%), by Types 2024 & 2032
- Figure 22: South America LED Televisions Volume Share (%), by Types 2024 & 2032
- Figure 23: South America LED Televisions Revenue (million), by Country 2024 & 2032
- Figure 24: South America LED Televisions Volume (K), by Country 2024 & 2032
- Figure 25: South America LED Televisions Revenue Share (%), by Country 2024 & 2032
- Figure 26: South America LED Televisions Volume Share (%), by Country 2024 & 2032
- Figure 27: Europe LED Televisions Revenue (million), by Application 2024 & 2032
- Figure 28: Europe LED Televisions Volume (K), by Application 2024 & 2032
- Figure 29: Europe LED Televisions Revenue Share (%), by Application 2024 & 2032
- Figure 30: Europe LED Televisions Volume Share (%), by Application 2024 & 2032
- Figure 31: Europe LED Televisions Revenue (million), by Types 2024 & 2032
- Figure 32: Europe LED Televisions Volume (K), by Types 2024 & 2032
- Figure 33: Europe LED Televisions Revenue Share (%), by Types 2024 & 2032
- Figure 34: Europe LED Televisions Volume Share (%), by Types 2024 & 2032
- Figure 35: Europe LED Televisions Revenue (million), by Country 2024 & 2032
- Figure 36: Europe LED Televisions Volume (K), by Country 2024 & 2032
- Figure 37: Europe LED Televisions Revenue Share (%), by Country 2024 & 2032
- Figure 38: Europe LED Televisions Volume Share (%), by Country 2024 & 2032
- Figure 39: Middle East & Africa LED Televisions Revenue (million), by Application 2024 & 2032
- Figure 40: Middle East & Africa LED Televisions Volume (K), by Application 2024 & 2032
- Figure 41: Middle East & Africa LED Televisions Revenue Share (%), by Application 2024 & 2032
- Figure 42: Middle East & Africa LED Televisions Volume Share (%), by Application 2024 & 2032
- Figure 43: Middle East & Africa LED Televisions Revenue (million), by Types 2024 & 2032
- Figure 44: Middle East & Africa LED Televisions Volume (K), by Types 2024 & 2032
- Figure 45: Middle East & Africa LED Televisions Revenue Share (%), by Types 2024 & 2032
- Figure 46: Middle East & Africa LED Televisions Volume Share (%), by Types 2024 & 2032
- Figure 47: Middle East & Africa LED Televisions Revenue (million), by Country 2024 & 2032
- Figure 48: Middle East & Africa LED Televisions Volume (K), by Country 2024 & 2032
- Figure 49: Middle East & Africa LED Televisions Revenue Share (%), by Country 2024 & 2032
- Figure 50: Middle East & Africa LED Televisions Volume Share (%), by Country 2024 & 2032
- Figure 51: Asia Pacific LED Televisions Revenue (million), by Application 2024 & 2032
- Figure 52: Asia Pacific LED Televisions Volume (K), by Application 2024 & 2032
- Figure 53: Asia Pacific LED Televisions Revenue Share (%), by Application 2024 & 2032
- Figure 54: Asia Pacific LED Televisions Volume Share (%), by Application 2024 & 2032
- Figure 55: Asia Pacific LED Televisions Revenue (million), by Types 2024 & 2032
- Figure 56: Asia Pacific LED Televisions Volume (K), by Types 2024 & 2032
- Figure 57: Asia Pacific LED Televisions Revenue Share (%), by Types 2024 & 2032
- Figure 58: Asia Pacific LED Televisions Volume Share (%), by Types 2024 & 2032
- Figure 59: Asia Pacific LED Televisions Revenue (million), by Country 2024 & 2032
- Figure 60: Asia Pacific LED Televisions Volume (K), by Country 2024 & 2032
- Figure 61: Asia Pacific LED Televisions Revenue Share (%), by Country 2024 & 2032
- Figure 62: Asia Pacific LED Televisions Volume Share (%), by Country 2024 & 2032
List of Tables
- Table 1: Global LED Televisions Revenue million Forecast, by Region 2019 & 2032
- Table 2: Global LED Televisions Volume K Forecast, by Region 2019 & 2032
- Table 3: Global LED Televisions Revenue million Forecast, by Application 2019 & 2032
- Table 4: Global LED Televisions Volume K Forecast, by Application 2019 & 2032
- Table 5: Global LED Televisions Revenue million Forecast, by Types 2019 & 2032
- Table 6: Global LED Televisions Volume K Forecast, by Types 2019 & 2032
- Table 7: Global LED Televisions Revenue million Forecast, by Region 2019 & 2032
- Table 8: Global LED Televisions Volume K Forecast, by Region 2019 & 2032
- Table 9: Global LED Televisions Revenue million Forecast, by Application 2019 & 2032
- Table 10: Global LED Televisions Volume K Forecast, by Application 2019 & 2032
- Table 11: Global LED Televisions Revenue million Forecast, by Types 2019 & 2032
- Table 12: Global LED Televisions Volume K Forecast, by Types 2019 & 2032
- Table 13: Global LED Televisions Revenue million Forecast, by Country 2019 & 2032
- Table 14: Global LED Televisions Volume K Forecast, by Country 2019 & 2032
- Table 15: United States LED Televisions Revenue (million) Forecast, by Application 2019 & 2032
- Table 16: United States LED Televisions Volume (K) Forecast, by Application 2019 & 2032
- Table 17: Canada LED Televisions Revenue (million) Forecast, by Application 2019 & 2032
- Table 18: Canada LED Televisions Volume (K) Forecast, by Application 2019 & 2032
- Table 19: Mexico LED Televisions Revenue (million) Forecast, by Application 2019 & 2032
- Table 20: Mexico LED Televisions Volume (K) Forecast, by Application 2019 & 2032
- Table 21: Global LED Televisions Revenue million Forecast, by Application 2019 & 2032
- Table 22: Global LED Televisions Volume K Forecast, by Application 2019 & 2032
- Table 23: Global LED Televisions Revenue million Forecast, by Types 2019 & 2032
- Table 24: Global LED Televisions Volume K Forecast, by Types 2019 & 2032
- Table 25: Global LED Televisions Revenue million Forecast, by Country 2019 & 2032
- Table 26: Global LED Televisions Volume K Forecast, by Country 2019 & 2032
- Table 27: Brazil LED Televisions Revenue (million) Forecast, by Application 2019 & 2032
- Table 28: Brazil LED Televisions Volume (K) Forecast, by Application 2019 & 2032
- Table 29: Argentina LED Televisions Revenue (million) Forecast, by Application 2019 & 2032
- Table 30: Argentina LED Televisions Volume (K) Forecast, by Application 2019 & 2032
- Table 31: Rest of South America LED Televisions Revenue (million) Forecast, by Application 2019 & 2032
- Table 32: Rest of South America LED Televisions Volume (K) Forecast, by Application 2019 & 2032
- Table 33: Global LED Televisions Revenue million Forecast, by Application 2019 & 2032
- Table 34: Global LED Televisions Volume K Forecast, by Application 2019 & 2032
- Table 35: Global LED Televisions Revenue million Forecast, by Types 2019 & 2032
- Table 36: Global LED Televisions Volume K Forecast, by Types 2019 & 2032
- Table 37: Global LED Televisions Revenue million Forecast, by Country 2019 & 2032
- Table 38: Global LED Televisions Volume K Forecast, by Country 2019 & 2032
- Table 39: United Kingdom LED Televisions Revenue (million) Forecast, by Application 2019 & 2032
- Table 40: United Kingdom LED Televisions Volume (K) Forecast, by Application 2019 & 2032
- Table 41: Germany LED Televisions Revenue (million) Forecast, by Application 2019 & 2032
- Table 42: Germany LED Televisions Volume (K) Forecast, by Application 2019 & 2032
- Table 43: France LED Televisions Revenue (million) Forecast, by Application 2019 & 2032
- Table 44: France LED Televisions Volume (K) Forecast, by Application 2019 & 2032
- Table 45: Italy LED Televisions Revenue (million) Forecast, by Application 2019 & 2032
- Table 46: Italy LED Televisions Volume (K) Forecast, by Application 2019 & 2032
- Table 47: Spain LED Televisions Revenue (million) Forecast, by Application 2019 & 2032
- Table 48: Spain LED Televisions Volume (K) Forecast, by Application 2019 & 2032
- Table 49: Russia LED Televisions Revenue (million) Forecast, by Application 2019 & 2032
- Table 50: Russia LED Televisions Volume (K) Forecast, by Application 2019 & 2032
- Table 51: Benelux LED Televisions Revenue (million) Forecast, by Application 2019 & 2032
- Table 52: Benelux LED Televisions Volume (K) Forecast, by Application 2019 & 2032
- Table 53: Nordics LED Televisions Revenue (million) Forecast, by Application 2019 & 2032
- Table 54: Nordics LED Televisions Volume (K) Forecast, by Application 2019 & 2032
- Table 55: Rest of Europe LED Televisions Revenue (million) Forecast, by Application 2019 & 2032
- Table 56: Rest of Europe LED Televisions Volume (K) Forecast, by Application 2019 & 2032
- Table 57: Global LED Televisions Revenue million Forecast, by Application 2019 & 2032
- Table 58: Global LED Televisions Volume K Forecast, by Application 2019 & 2032
- Table 59: Global LED Televisions Revenue million Forecast, by Types 2019 & 2032
- Table 60: Global LED Televisions Volume K Forecast, by Types 2019 & 2032
- Table 61: Global LED Televisions Revenue million Forecast, by Country 2019 & 2032
- Table 62: Global LED Televisions Volume K Forecast, by Country 2019 & 2032
- Table 63: Turkey LED Televisions Revenue (million) Forecast, by Application 2019 & 2032
- Table 64: Turkey LED Televisions Volume (K) Forecast, by Application 2019 & 2032
- Table 65: Israel LED Televisions Revenue (million) Forecast, by Application 2019 & 2032
- Table 66: Israel LED Televisions Volume (K) Forecast, by Application 2019 & 2032
- Table 67: GCC LED Televisions Revenue (million) Forecast, by Application 2019 & 2032
- Table 68: GCC LED Televisions Volume (K) Forecast, by Application 2019 & 2032
- Table 69: North Africa LED Televisions Revenue (million) Forecast, by Application 2019 & 2032
- Table 70: North Africa LED Televisions Volume (K) Forecast, by Application 2019 & 2032
- Table 71: South Africa LED Televisions Revenue (million) Forecast, by Application 2019 & 2032
- Table 72: South Africa LED Televisions Volume (K) Forecast, by Application 2019 & 2032
- Table 73: Rest of Middle East & Africa LED Televisions Revenue (million) Forecast, by Application 2019 & 2032
- Table 74: Rest of Middle East & Africa LED Televisions Volume (K) Forecast, by Application 2019 & 2032
- Table 75: Global LED Televisions Revenue million Forecast, by Application 2019 & 2032
- Table 76: Global LED Televisions Volume K Forecast, by Application 2019 & 2032
- Table 77: Global LED Televisions Revenue million Forecast, by Types 2019 & 2032
- Table 78: Global LED Televisions Volume K Forecast, by Types 2019 & 2032
- Table 79: Global LED Televisions Revenue million Forecast, by Country 2019 & 2032
- Table 80: Global LED Televisions Volume K Forecast, by Country 2019 & 2032
- Table 81: China LED Televisions Revenue (million) Forecast, by Application 2019 & 2032
- Table 82: China LED Televisions Volume (K) Forecast, by Application 2019 & 2032
- Table 83: India LED Televisions Revenue (million) Forecast, by Application 2019 & 2032
- Table 84: India LED Televisions Volume (K) Forecast, by Application 2019 & 2032
- Table 85: Japan LED Televisions Revenue (million) Forecast, by Application 2019 & 2032
- Table 86: Japan LED Televisions Volume (K) Forecast, by Application 2019 & 2032
- Table 87: South Korea LED Televisions Revenue (million) Forecast, by Application 2019 & 2032
- Table 88: South Korea LED Televisions Volume (K) Forecast, by Application 2019 & 2032
- Table 89: ASEAN LED Televisions Revenue (million) Forecast, by Application 2019 & 2032
- Table 90: ASEAN LED Televisions Volume (K) Forecast, by Application 2019 & 2032
- Table 91: Oceania LED Televisions Revenue (million) Forecast, by Application 2019 & 2032
- Table 92: Oceania LED Televisions Volume (K) Forecast, by Application 2019 & 2032
- Table 93: Rest of Asia Pacific LED Televisions Revenue (million) Forecast, by Application 2019 & 2032
- Table 94: Rest of Asia Pacific LED Televisions Volume (K) Forecast, by Application 2019 & 2032
Frequently Asked Questions
1. What is the projected Compound Annual Growth Rate (CAGR) of the LED Televisions?
The projected CAGR is approximately XX%.
2. Which companies are prominent players in the LED Televisions?
Key companies in the market include Samsung, LG, Sony, Toshiba, Philips, Panasonic, Haier, Sharp Corporation, MI, Vizio, Hisense, TCL.
3. What are the main segments of the LED Televisions?
The market segments include Application, Types.
4. Can you provide details about the market size?
The market size is estimated to be USD XXX million as of 2022.
5. What are some drivers contributing to market growth?
N/A
6. What are the notable trends driving market growth?
N/A
7. Are there any restraints impacting market growth?
N/A
8. Can you provide examples of recent developments in the market?
N/A
9. What pricing options are available for accessing the report?
Pricing options include single-user, multi-user, and enterprise licenses priced at USD 3350.00, USD 5025.00, and USD 6700.00 respectively.
10. Is the market size provided in terms of value or volume?
The market size is provided in terms of value, measured in million and volume, measured in K.
11. Are there any specific market keywords associated with the report?
Yes, the market keyword associated with the report is "LED Televisions," which aids in identifying and referencing the specific market segment covered.
12. How do I determine which pricing option suits my needs best?
The pricing options vary based on user requirements and access needs. Individual users may opt for single-user licenses, while businesses requiring broader access may choose multi-user or enterprise licenses for cost-effective access to the report.
13. Are there any additional resources or data provided in the LED Televisions report?
While the report offers comprehensive insights, it's advisable to review the specific contents or supplementary materials provided to ascertain if additional resources or data are available.
14. How can I stay updated on further developments or reports in the LED Televisions?
To stay informed about further developments, trends, and reports in the LED Televisions, consider subscribing to industry newsletters, following relevant companies and organizations, or regularly checking reputable industry news sources and publications.
Methodology
Step 1 - Identification of Relevant Samples Size from Population Database


Step 2 - Approaches for Defining Global Market Size (Value, Volume* & Price*)

Note*: In applicable scenarios
Step 3 - Data Sources
Primary Research
- Web Analytics
- Survey Reports
- Research Institute
- Latest Research Reports
- Opinion Leaders
Secondary Research
- Annual Reports
- White Paper
- Latest Press Release
- Industry Association
- Paid Database
- Investor Presentations

Step 4 - Data Triangulation
Involves using different sources of information in order to increase the validity of a study
These sources are likely to be stakeholders in a program - participants, other researchers, program staff, other community members, and so on.
Then we put all data in single framework & apply various statistical tools to find out the dynamic on the market.
During the analysis stage, feedback from the stakeholder groups would be compared to determine areas of agreement as well as areas of divergence


