

Key Insights
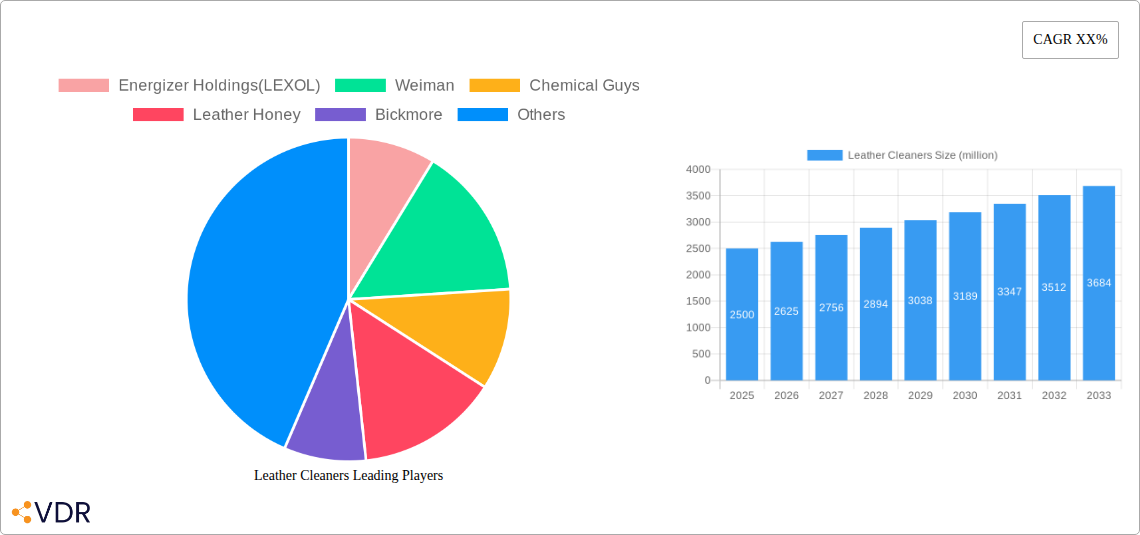
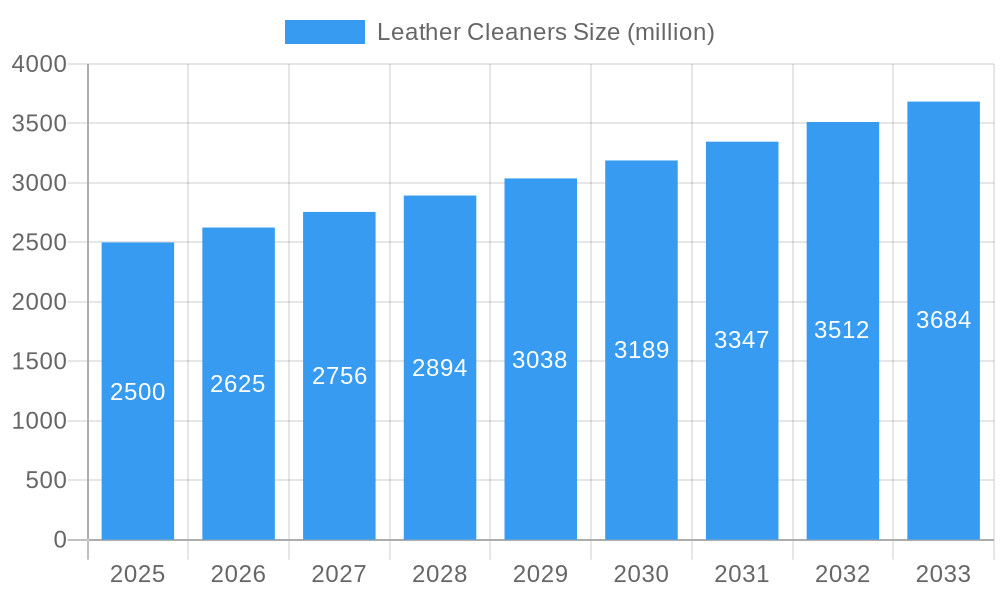
The leather cleaner market, valued at approximately $2.5 billion in 2025, is experiencing robust growth, projected to reach $3.5 billion by 2033. This signifies a Compound Annual Growth Rate (CAGR) of approximately 5%, driven primarily by increasing consumer disposable incomes, a rising demand for luxury goods and vehicles featuring leather interiors, and a growing awareness of proper leather care among consumers. Key application segments include car interiors and household leather goods, reflecting the widespread use of leather in both personal and professional settings. The market is segmented by product type, with leather care liniment, leather cleaners, and water protectants leading the way. The substantial presence of established brands like Energizer Holdings (LEXOL), Weiman, and Meguiar's, alongside smaller specialized players, indicates a competitive landscape characterized by both brand loyalty and the emergence of innovative product formulations. Geographic growth is expected across all regions, with North America and Europe currently holding significant market shares, while emerging markets in Asia-Pacific are poised for rapid expansion due to increasing vehicle ownership and rising middle classes.
Leather Cleaners Market Size (In Billion)
The restraints on market growth primarily involve the fluctuating prices of raw materials used in leather cleaner production, as well as concerns about the environmental impact of certain chemical components. However, the industry is actively addressing these challenges through the development of eco-friendly and sustainable alternatives. The ongoing trend towards personalization and specialized leather care solutions creates opportunities for niche players to cater to specific consumer needs. This includes products formulated for different types of leather (e.g., suede, full-grain) or designed for specific applications (e.g., automotive, furniture). Further growth is likely to be fueled by the expansion of e-commerce channels, providing broader access to a wider range of products and facilitating direct-to-consumer sales. The continued emphasis on product innovation, coupled with targeted marketing efforts, will be pivotal for market participants to capitalize on the growing demand for high-quality leather cleaning and care solutions.
Leather Cleaners Company Market Share
Leather Cleaners Market Report: 2019-2033
This comprehensive report provides an in-depth analysis of the global leather cleaners market, encompassing market dynamics, growth trends, regional dominance, product landscape, key players, and future outlook. The study period covers 2019-2033, with 2025 serving as the base and estimated year. The forecast period spans 2025-2033, and the historical period encompasses 2019-2024. This report is invaluable for industry professionals, investors, and anyone seeking a thorough understanding of this dynamic market valued at xx million units in 2025.
Leather Cleaners Market Dynamics & Structure
The leather cleaners market is characterized by moderate concentration, with key players like Energizer Holdings (LEXOL), Weiman, and Meguiar's holding significant shares. Technological innovation, particularly in eco-friendly formulations and application methods, is a major driver. Stringent regulatory frameworks concerning volatile organic compounds (VOCs) and hazardous materials influence product development. Competitive substitutes, such as wipes and sprays, continuously challenge traditional leather cleaners. End-user demographics, with a rising affluent class and increased car ownership, fuel demand. M&A activity in the sector remains relatively low, with xx major deals recorded between 2019 and 2024, indicating a preference for organic growth.
- Market Concentration: Moderately concentrated, with top 5 players holding approximately xx% market share in 2025.
- Technological Innovation: Focus on sustainable, biodegradable, and high-performance formulations.
- Regulatory Framework: Stricter VOC and chemical regulations driving innovation in safer alternatives.
- Competitive Substitutes: Growth of wipes and spray cleaners poses a competitive challenge.
- End-User Demographics: Increasing car ownership and disposable income boost market demand.
- M&A Activity: Low M&A activity, with xx deals recorded during 2019-2024.
Leather Cleaners Growth Trends & Insights
The global leather cleaners market exhibits a steady growth trajectory, expanding from xx million units in 2019 to an estimated xx million units in 2025, demonstrating a CAGR of xx% during the historical period. This growth is attributed to several factors including rising disposable incomes, increasing vehicle ownership, particularly in developing economies, and heightened consumer awareness regarding leather care. Technological disruptions, such as the introduction of innovative cleaning agents and application technologies, are further fueling market expansion. Changing consumer preferences towards convenience and eco-friendly products also influence market trends. Market penetration for specialized leather cleaners remains relatively low, suggesting significant growth potential in untapped segments.
Dominant Regions, Countries, or Segments in Leather Cleaners
North America holds the largest market share in the leather cleaners market in 2025, driven by high car ownership rates and a strong focus on automotive detailing. Within North America, the United States dominates, fueled by a robust automotive industry and a large consumer base. The Car Interior application segment holds the largest share, reflecting the significant demand for cleaning and maintaining leather car interiors. The Leather Cleaner type accounts for the highest volume of sales, exceeding xx million units in 2025 due to its widespread application and affordability.
- Key Drivers for North America: High car ownership rates, strong automotive aftermarket, and high consumer spending.
- Dominance Factors for Car Interior Application: Extensive usage in automotive interiors and rising demand for car detailing.
- Growth Potential for Leather Cleaner Type: Wide applicability, established consumer base, and relatively low cost compared to other types.
Leather Cleaners Product Landscape
The leather cleaners market features a diverse range of products, including specialized formulations for different leather types and application methods (e.g., sprays, wipes, creams). Recent innovations focus on eco-friendly ingredients, enhanced cleaning power, and protective coatings. Unique selling propositions include improved stain removal, water resistance, and the preservation of leather's natural appearance and suppleness. Technological advancements include the development of nano-based cleaning agents and specialized formulations to address specific leather types and conditions.
Key Drivers, Barriers & Challenges in Leather Cleaners
Key Drivers: Rising disposable incomes, increasing car ownership, growing consumer awareness of leather care, and technological advancements driving innovative product development. The expansion of the automotive industry, particularly in emerging markets, provides strong tailwinds.
Challenges & Restraints: Fluctuating raw material prices can impact production costs and profitability. Stricter environmental regulations in various regions pose a significant challenge. Intense competition from substitute products and established brands necessitates continuous innovation and cost optimization. Supply chain disruptions and increased transportation costs negatively impact profitability.
Emerging Opportunities in Leather Cleaners
Untapped markets in developing economies, particularly in Asia and South America, present significant growth opportunities. The increasing demand for eco-friendly and sustainable products drives opportunities for bio-based and biodegradable cleaners. Specialized formulations for unique leather types (e.g., exotic leathers) and tailored applications (e.g., restoration) represent further growth areas. The integration of smart technologies, such as automated dispensing systems and sensors to optimize cleaning, offers compelling future opportunities.
Growth Accelerators in the Leather Cleaners Industry
Technological breakthroughs in formulation and application technologies are crucial catalysts for growth. Strategic partnerships and collaborations between chemical manufacturers and leather care companies enable the development of innovative products. Expansion into new geographic markets, focusing on regions with rising car ownership and disposable incomes, unlocks substantial growth potential.
Key Players Shaping the Leather Cleaners Market
- Energizer Holdings (LEXOL)
- Weiman
- Chemical Guys
- Leather Honey
- Bickmore
- TriNova
- Cadillac
- Mr. Leather
- Meguiar's
- Aero Cosmetics
- Glacier Car Care
- CarGuys
- Leather-Clean
Notable Milestones in Leather Cleaners Sector
- 2020: Launch of a new biodegradable leather cleaner by Weiman.
- 2022: Meguiar's introduces a line of leather cleaners with enhanced water-resistant properties.
- 2023: Acquisition of a smaller leather care company by Energizer Holdings (LEXOL).
In-Depth Leather Cleaners Market Outlook
The leather cleaners market is poised for sustained growth driven by ongoing technological innovation and expanding consumer demand. Strategic investments in R&D and the development of eco-friendly, high-performance products will be crucial for success. Expanding into emerging markets and leveraging strategic partnerships will further enhance market penetration and drive long-term growth. Opportunities exist to capitalize on increasing consumer awareness regarding leather care and the demand for specialty cleaning solutions.
Leather Cleaners Segmentation
-
1. Application
- 1.1. Car Interior
- 1.2. Household Leather
- 1.3. Others
-
2. Types
- 2.1. Leather Care Liniment
- 2.2. Leather Cleaner
- 2.3. Water Protectant
- 2.4. Others
Leather Cleaners Segmentation By Geography
-
1. North America
- 1.1. United States
- 1.2. Canada
- 1.3. Mexico
-
2. South America
- 2.1. Brazil
- 2.2. Argentina
- 2.3. Rest of South America
-
3. Europe
- 3.1. United Kingdom
- 3.2. Germany
- 3.3. France
- 3.4. Italy
- 3.5. Spain
- 3.6. Russia
- 3.7. Benelux
- 3.8. Nordics
- 3.9. Rest of Europe
-
4. Middle East & Africa
- 4.1. Turkey
- 4.2. Israel
- 4.3. GCC
- 4.4. North Africa
- 4.5. South Africa
- 4.6. Rest of Middle East & Africa
-
5. Asia Pacific
- 5.1. China
- 5.2. India
- 5.3. Japan
- 5.4. South Korea
- 5.5. ASEAN
- 5.6. Oceania
- 5.7. Rest of Asia Pacific

Leather Cleaners Regional Market Share
Geographic Coverage of Leather Cleaners
Leather Cleaners REPORT HIGHLIGHTS
| Aspects | Details |
|---|---|
| Study Period | 2020-2034 |
| Base Year | 2025 |
| Estimated Year | 2026 |
| Forecast Period | 2026-2034 |
| Historical Period | 2020-2025 |
| Growth Rate | CAGR of XX% from 2020-2034 |
| Segmentation |
|
Table of Contents
- 1. Introduction
- 1.1. Research Scope
- 1.2. Market Segmentation
- 1.3. Research Methodology
- 1.4. Definitions and Assumptions
- 2. Executive Summary
- 2.1. Introduction
- 3. Market Dynamics
- 3.1. Introduction
- 3.2. Market Drivers
- 3.3. Market Restrains
- 3.4. Market Trends
- 4. Market Factor Analysis
- 4.1. Porters Five Forces
- 4.2. Supply/Value Chain
- 4.3. PESTEL analysis
- 4.4. Market Entropy
- 4.5. Patent/Trademark Analysis
- 5. Global Leather Cleaners Analysis, Insights and Forecast, 2020-2032
- 5.1. Market Analysis, Insights and Forecast - by Application
- 5.1.1. Car Interior
- 5.1.2. Household Leather
- 5.1.3. Others
- 5.2. Market Analysis, Insights and Forecast - by Types
- 5.2.1. Leather Care Liniment
- 5.2.2. Leather Cleaner
- 5.2.3. Water Protectant
- 5.2.4. Others
- 5.3. Market Analysis, Insights and Forecast - by Region
- 5.3.1. North America
- 5.3.2. South America
- 5.3.3. Europe
- 5.3.4. Middle East & Africa
- 5.3.5. Asia Pacific
- 5.1. Market Analysis, Insights and Forecast - by Application
- 6. North America Leather Cleaners Analysis, Insights and Forecast, 2020-2032
- 6.1. Market Analysis, Insights and Forecast - by Application
- 6.1.1. Car Interior
- 6.1.2. Household Leather
- 6.1.3. Others
- 6.2. Market Analysis, Insights and Forecast - by Types
- 6.2.1. Leather Care Liniment
- 6.2.2. Leather Cleaner
- 6.2.3. Water Protectant
- 6.2.4. Others
- 6.1. Market Analysis, Insights and Forecast - by Application
- 7. South America Leather Cleaners Analysis, Insights and Forecast, 2020-2032
- 7.1. Market Analysis, Insights and Forecast - by Application
- 7.1.1. Car Interior
- 7.1.2. Household Leather
- 7.1.3. Others
- 7.2. Market Analysis, Insights and Forecast - by Types
- 7.2.1. Leather Care Liniment
- 7.2.2. Leather Cleaner
- 7.2.3. Water Protectant
- 7.2.4. Others
- 7.1. Market Analysis, Insights and Forecast - by Application
- 8. Europe Leather Cleaners Analysis, Insights and Forecast, 2020-2032
- 8.1. Market Analysis, Insights and Forecast - by Application
- 8.1.1. Car Interior
- 8.1.2. Household Leather
- 8.1.3. Others
- 8.2. Market Analysis, Insights and Forecast - by Types
- 8.2.1. Leather Care Liniment
- 8.2.2. Leather Cleaner
- 8.2.3. Water Protectant
- 8.2.4. Others
- 8.1. Market Analysis, Insights and Forecast - by Application
- 9. Middle East & Africa Leather Cleaners Analysis, Insights and Forecast, 2020-2032
- 9.1. Market Analysis, Insights and Forecast - by Application
- 9.1.1. Car Interior
- 9.1.2. Household Leather
- 9.1.3. Others
- 9.2. Market Analysis, Insights and Forecast - by Types
- 9.2.1. Leather Care Liniment
- 9.2.2. Leather Cleaner
- 9.2.3. Water Protectant
- 9.2.4. Others
- 9.1. Market Analysis, Insights and Forecast - by Application
- 10. Asia Pacific Leather Cleaners Analysis, Insights and Forecast, 2020-2032
- 10.1. Market Analysis, Insights and Forecast - by Application
- 10.1.1. Car Interior
- 10.1.2. Household Leather
- 10.1.3. Others
- 10.2. Market Analysis, Insights and Forecast - by Types
- 10.2.1. Leather Care Liniment
- 10.2.2. Leather Cleaner
- 10.2.3. Water Protectant
- 10.2.4. Others
- 10.1. Market Analysis, Insights and Forecast - by Application
- 11. Competitive Analysis
- 11.1. Global Market Share Analysis 2025
- 11.2. Company Profiles
- 11.2.1 Energizer Holdings(LEXOL)
- 11.2.1.1. Overview
- 11.2.1.2. Products
- 11.2.1.3. SWOT Analysis
- 11.2.1.4. Recent Developments
- 11.2.1.5. Financials (Based on Availability)
- 11.2.2 Weiman
- 11.2.2.1. Overview
- 11.2.2.2. Products
- 11.2.2.3. SWOT Analysis
- 11.2.2.4. Recent Developments
- 11.2.2.5. Financials (Based on Availability)
- 11.2.3 Chemical Guys
- 11.2.3.1. Overview
- 11.2.3.2. Products
- 11.2.3.3. SWOT Analysis
- 11.2.3.4. Recent Developments
- 11.2.3.5. Financials (Based on Availability)
- 11.2.4 Leather Honey
- 11.2.4.1. Overview
- 11.2.4.2. Products
- 11.2.4.3. SWOT Analysis
- 11.2.4.4. Recent Developments
- 11.2.4.5. Financials (Based on Availability)
- 11.2.5 Bickmore
- 11.2.5.1. Overview
- 11.2.5.2. Products
- 11.2.5.3. SWOT Analysis
- 11.2.5.4. Recent Developments
- 11.2.5.5. Financials (Based on Availability)
- 11.2.6 TriNova
- 11.2.6.1. Overview
- 11.2.6.2. Products
- 11.2.6.3. SWOT Analysis
- 11.2.6.4. Recent Developments
- 11.2.6.5. Financials (Based on Availability)
- 11.2.7 Cadillac
- 11.2.7.1. Overview
- 11.2.7.2. Products
- 11.2.7.3. SWOT Analysis
- 11.2.7.4. Recent Developments
- 11.2.7.5. Financials (Based on Availability)
- 11.2.8 Mr. Leather
- 11.2.8.1. Overview
- 11.2.8.2. Products
- 11.2.8.3. SWOT Analysis
- 11.2.8.4. Recent Developments
- 11.2.8.5. Financials (Based on Availability)
- 11.2.9 Meguiar's
- 11.2.9.1. Overview
- 11.2.9.2. Products
- 11.2.9.3. SWOT Analysis
- 11.2.9.4. Recent Developments
- 11.2.9.5. Financials (Based on Availability)
- 11.2.10 Aero Cosmetics
- 11.2.10.1. Overview
- 11.2.10.2. Products
- 11.2.10.3. SWOT Analysis
- 11.2.10.4. Recent Developments
- 11.2.10.5. Financials (Based on Availability)
- 11.2.11 Glacier Car Care
- 11.2.11.1. Overview
- 11.2.11.2. Products
- 11.2.11.3. SWOT Analysis
- 11.2.11.4. Recent Developments
- 11.2.11.5. Financials (Based on Availability)
- 11.2.12 CarGuys
- 11.2.12.1. Overview
- 11.2.12.2. Products
- 11.2.12.3. SWOT Analysis
- 11.2.12.4. Recent Developments
- 11.2.12.5. Financials (Based on Availability)
- 11.2.13 Leather-Clean
- 11.2.13.1. Overview
- 11.2.13.2. Products
- 11.2.13.3. SWOT Analysis
- 11.2.13.4. Recent Developments
- 11.2.13.5. Financials (Based on Availability)
- 11.2.1 Energizer Holdings(LEXOL)
List of Figures
- Figure 1: Global Leather Cleaners Revenue Breakdown (million, %) by Region 2025 & 2033
- Figure 2: Global Leather Cleaners Volume Breakdown (K, %) by Region 2025 & 2033
- Figure 3: North America Leather Cleaners Revenue (million), by Application 2025 & 2033
- Figure 4: North America Leather Cleaners Volume (K), by Application 2025 & 2033
- Figure 5: North America Leather Cleaners Revenue Share (%), by Application 2025 & 2033
- Figure 6: North America Leather Cleaners Volume Share (%), by Application 2025 & 2033
- Figure 7: North America Leather Cleaners Revenue (million), by Types 2025 & 2033
- Figure 8: North America Leather Cleaners Volume (K), by Types 2025 & 2033
- Figure 9: North America Leather Cleaners Revenue Share (%), by Types 2025 & 2033
- Figure 10: North America Leather Cleaners Volume Share (%), by Types 2025 & 2033
- Figure 11: North America Leather Cleaners Revenue (million), by Country 2025 & 2033
- Figure 12: North America Leather Cleaners Volume (K), by Country 2025 & 2033
- Figure 13: North America Leather Cleaners Revenue Share (%), by Country 2025 & 2033
- Figure 14: North America Leather Cleaners Volume Share (%), by Country 2025 & 2033
- Figure 15: South America Leather Cleaners Revenue (million), by Application 2025 & 2033
- Figure 16: South America Leather Cleaners Volume (K), by Application 2025 & 2033
- Figure 17: South America Leather Cleaners Revenue Share (%), by Application 2025 & 2033
- Figure 18: South America Leather Cleaners Volume Share (%), by Application 2025 & 2033
- Figure 19: South America Leather Cleaners Revenue (million), by Types 2025 & 2033
- Figure 20: South America Leather Cleaners Volume (K), by Types 2025 & 2033
- Figure 21: South America Leather Cleaners Revenue Share (%), by Types 2025 & 2033
- Figure 22: South America Leather Cleaners Volume Share (%), by Types 2025 & 2033
- Figure 23: South America Leather Cleaners Revenue (million), by Country 2025 & 2033
- Figure 24: South America Leather Cleaners Volume (K), by Country 2025 & 2033
- Figure 25: South America Leather Cleaners Revenue Share (%), by Country 2025 & 2033
- Figure 26: South America Leather Cleaners Volume Share (%), by Country 2025 & 2033
- Figure 27: Europe Leather Cleaners Revenue (million), by Application 2025 & 2033
- Figure 28: Europe Leather Cleaners Volume (K), by Application 2025 & 2033
- Figure 29: Europe Leather Cleaners Revenue Share (%), by Application 2025 & 2033
- Figure 30: Europe Leather Cleaners Volume Share (%), by Application 2025 & 2033
- Figure 31: Europe Leather Cleaners Revenue (million), by Types 2025 & 2033
- Figure 32: Europe Leather Cleaners Volume (K), by Types 2025 & 2033
- Figure 33: Europe Leather Cleaners Revenue Share (%), by Types 2025 & 2033
- Figure 34: Europe Leather Cleaners Volume Share (%), by Types 2025 & 2033
- Figure 35: Europe Leather Cleaners Revenue (million), by Country 2025 & 2033
- Figure 36: Europe Leather Cleaners Volume (K), by Country 2025 & 2033
- Figure 37: Europe Leather Cleaners Revenue Share (%), by Country 2025 & 2033
- Figure 38: Europe Leather Cleaners Volume Share (%), by Country 2025 & 2033
- Figure 39: Middle East & Africa Leather Cleaners Revenue (million), by Application 2025 & 2033
- Figure 40: Middle East & Africa Leather Cleaners Volume (K), by Application 2025 & 2033
- Figure 41: Middle East & Africa Leather Cleaners Revenue Share (%), by Application 2025 & 2033
- Figure 42: Middle East & Africa Leather Cleaners Volume Share (%), by Application 2025 & 2033
- Figure 43: Middle East & Africa Leather Cleaners Revenue (million), by Types 2025 & 2033
- Figure 44: Middle East & Africa Leather Cleaners Volume (K), by Types 2025 & 2033
- Figure 45: Middle East & Africa Leather Cleaners Revenue Share (%), by Types 2025 & 2033
- Figure 46: Middle East & Africa Leather Cleaners Volume Share (%), by Types 2025 & 2033
- Figure 47: Middle East & Africa Leather Cleaners Revenue (million), by Country 2025 & 2033
- Figure 48: Middle East & Africa Leather Cleaners Volume (K), by Country 2025 & 2033
- Figure 49: Middle East & Africa Leather Cleaners Revenue Share (%), by Country 2025 & 2033
- Figure 50: Middle East & Africa Leather Cleaners Volume Share (%), by Country 2025 & 2033
- Figure 51: Asia Pacific Leather Cleaners Revenue (million), by Application 2025 & 2033
- Figure 52: Asia Pacific Leather Cleaners Volume (K), by Application 2025 & 2033
- Figure 53: Asia Pacific Leather Cleaners Revenue Share (%), by Application 2025 & 2033
- Figure 54: Asia Pacific Leather Cleaners Volume Share (%), by Application 2025 & 2033
- Figure 55: Asia Pacific Leather Cleaners Revenue (million), by Types 2025 & 2033
- Figure 56: Asia Pacific Leather Cleaners Volume (K), by Types 2025 & 2033
- Figure 57: Asia Pacific Leather Cleaners Revenue Share (%), by Types 2025 & 2033
- Figure 58: Asia Pacific Leather Cleaners Volume Share (%), by Types 2025 & 2033
- Figure 59: Asia Pacific Leather Cleaners Revenue (million), by Country 2025 & 2033
- Figure 60: Asia Pacific Leather Cleaners Volume (K), by Country 2025 & 2033
- Figure 61: Asia Pacific Leather Cleaners Revenue Share (%), by Country 2025 & 2033
- Figure 62: Asia Pacific Leather Cleaners Volume Share (%), by Country 2025 & 2033
List of Tables
- Table 1: Global Leather Cleaners Revenue million Forecast, by Application 2020 & 2033
- Table 2: Global Leather Cleaners Volume K Forecast, by Application 2020 & 2033
- Table 3: Global Leather Cleaners Revenue million Forecast, by Types 2020 & 2033
- Table 4: Global Leather Cleaners Volume K Forecast, by Types 2020 & 2033
- Table 5: Global Leather Cleaners Revenue million Forecast, by Region 2020 & 2033
- Table 6: Global Leather Cleaners Volume K Forecast, by Region 2020 & 2033
- Table 7: Global Leather Cleaners Revenue million Forecast, by Application 2020 & 2033
- Table 8: Global Leather Cleaners Volume K Forecast, by Application 2020 & 2033
- Table 9: Global Leather Cleaners Revenue million Forecast, by Types 2020 & 2033
- Table 10: Global Leather Cleaners Volume K Forecast, by Types 2020 & 2033
- Table 11: Global Leather Cleaners Revenue million Forecast, by Country 2020 & 2033
- Table 12: Global Leather Cleaners Volume K Forecast, by Country 2020 & 2033
- Table 13: United States Leather Cleaners Revenue (million) Forecast, by Application 2020 & 2033
- Table 14: United States Leather Cleaners Volume (K) Forecast, by Application 2020 & 2033
- Table 15: Canada Leather Cleaners Revenue (million) Forecast, by Application 2020 & 2033
- Table 16: Canada Leather Cleaners Volume (K) Forecast, by Application 2020 & 2033
- Table 17: Mexico Leather Cleaners Revenue (million) Forecast, by Application 2020 & 2033
- Table 18: Mexico Leather Cleaners Volume (K) Forecast, by Application 2020 & 2033
- Table 19: Global Leather Cleaners Revenue million Forecast, by Application 2020 & 2033
- Table 20: Global Leather Cleaners Volume K Forecast, by Application 2020 & 2033
- Table 21: Global Leather Cleaners Revenue million Forecast, by Types 2020 & 2033
- Table 22: Global Leather Cleaners Volume K Forecast, by Types 2020 & 2033
- Table 23: Global Leather Cleaners Revenue million Forecast, by Country 2020 & 2033
- Table 24: Global Leather Cleaners Volume K Forecast, by Country 2020 & 2033
- Table 25: Brazil Leather Cleaners Revenue (million) Forecast, by Application 2020 & 2033
- Table 26: Brazil Leather Cleaners Volume (K) Forecast, by Application 2020 & 2033
- Table 27: Argentina Leather Cleaners Revenue (million) Forecast, by Application 2020 & 2033
- Table 28: Argentina Leather Cleaners Volume (K) Forecast, by Application 2020 & 2033
- Table 29: Rest of South America Leather Cleaners Revenue (million) Forecast, by Application 2020 & 2033
- Table 30: Rest of South America Leather Cleaners Volume (K) Forecast, by Application 2020 & 2033
- Table 31: Global Leather Cleaners Revenue million Forecast, by Application 2020 & 2033
- Table 32: Global Leather Cleaners Volume K Forecast, by Application 2020 & 2033
- Table 33: Global Leather Cleaners Revenue million Forecast, by Types 2020 & 2033
- Table 34: Global Leather Cleaners Volume K Forecast, by Types 2020 & 2033
- Table 35: Global Leather Cleaners Revenue million Forecast, by Country 2020 & 2033
- Table 36: Global Leather Cleaners Volume K Forecast, by Country 2020 & 2033
- Table 37: United Kingdom Leather Cleaners Revenue (million) Forecast, by Application 2020 & 2033
- Table 38: United Kingdom Leather Cleaners Volume (K) Forecast, by Application 2020 & 2033
- Table 39: Germany Leather Cleaners Revenue (million) Forecast, by Application 2020 & 2033
- Table 40: Germany Leather Cleaners Volume (K) Forecast, by Application 2020 & 2033
- Table 41: France Leather Cleaners Revenue (million) Forecast, by Application 2020 & 2033
- Table 42: France Leather Cleaners Volume (K) Forecast, by Application 2020 & 2033
- Table 43: Italy Leather Cleaners Revenue (million) Forecast, by Application 2020 & 2033
- Table 44: Italy Leather Cleaners Volume (K) Forecast, by Application 2020 & 2033
- Table 45: Spain Leather Cleaners Revenue (million) Forecast, by Application 2020 & 2033
- Table 46: Spain Leather Cleaners Volume (K) Forecast, by Application 2020 & 2033
- Table 47: Russia Leather Cleaners Revenue (million) Forecast, by Application 2020 & 2033
- Table 48: Russia Leather Cleaners Volume (K) Forecast, by Application 2020 & 2033
- Table 49: Benelux Leather Cleaners Revenue (million) Forecast, by Application 2020 & 2033
- Table 50: Benelux Leather Cleaners Volume (K) Forecast, by Application 2020 & 2033
- Table 51: Nordics Leather Cleaners Revenue (million) Forecast, by Application 2020 & 2033
- Table 52: Nordics Leather Cleaners Volume (K) Forecast, by Application 2020 & 2033
- Table 53: Rest of Europe Leather Cleaners Revenue (million) Forecast, by Application 2020 & 2033
- Table 54: Rest of Europe Leather Cleaners Volume (K) Forecast, by Application 2020 & 2033
- Table 55: Global Leather Cleaners Revenue million Forecast, by Application 2020 & 2033
- Table 56: Global Leather Cleaners Volume K Forecast, by Application 2020 & 2033
- Table 57: Global Leather Cleaners Revenue million Forecast, by Types 2020 & 2033
- Table 58: Global Leather Cleaners Volume K Forecast, by Types 2020 & 2033
- Table 59: Global Leather Cleaners Revenue million Forecast, by Country 2020 & 2033
- Table 60: Global Leather Cleaners Volume K Forecast, by Country 2020 & 2033
- Table 61: Turkey Leather Cleaners Revenue (million) Forecast, by Application 2020 & 2033
- Table 62: Turkey Leather Cleaners Volume (K) Forecast, by Application 2020 & 2033
- Table 63: Israel Leather Cleaners Revenue (million) Forecast, by Application 2020 & 2033
- Table 64: Israel Leather Cleaners Volume (K) Forecast, by Application 2020 & 2033
- Table 65: GCC Leather Cleaners Revenue (million) Forecast, by Application 2020 & 2033
- Table 66: GCC Leather Cleaners Volume (K) Forecast, by Application 2020 & 2033
- Table 67: North Africa Leather Cleaners Revenue (million) Forecast, by Application 2020 & 2033
- Table 68: North Africa Leather Cleaners Volume (K) Forecast, by Application 2020 & 2033
- Table 69: South Africa Leather Cleaners Revenue (million) Forecast, by Application 2020 & 2033
- Table 70: South Africa Leather Cleaners Volume (K) Forecast, by Application 2020 & 2033
- Table 71: Rest of Middle East & Africa Leather Cleaners Revenue (million) Forecast, by Application 2020 & 2033
- Table 72: Rest of Middle East & Africa Leather Cleaners Volume (K) Forecast, by Application 2020 & 2033
- Table 73: Global Leather Cleaners Revenue million Forecast, by Application 2020 & 2033
- Table 74: Global Leather Cleaners Volume K Forecast, by Application 2020 & 2033
- Table 75: Global Leather Cleaners Revenue million Forecast, by Types 2020 & 2033
- Table 76: Global Leather Cleaners Volume K Forecast, by Types 2020 & 2033
- Table 77: Global Leather Cleaners Revenue million Forecast, by Country 2020 & 2033
- Table 78: Global Leather Cleaners Volume K Forecast, by Country 2020 & 2033
- Table 79: China Leather Cleaners Revenue (million) Forecast, by Application 2020 & 2033
- Table 80: China Leather Cleaners Volume (K) Forecast, by Application 2020 & 2033
- Table 81: India Leather Cleaners Revenue (million) Forecast, by Application 2020 & 2033
- Table 82: India Leather Cleaners Volume (K) Forecast, by Application 2020 & 2033
- Table 83: Japan Leather Cleaners Revenue (million) Forecast, by Application 2020 & 2033
- Table 84: Japan Leather Cleaners Volume (K) Forecast, by Application 2020 & 2033
- Table 85: South Korea Leather Cleaners Revenue (million) Forecast, by Application 2020 & 2033
- Table 86: South Korea Leather Cleaners Volume (K) Forecast, by Application 2020 & 2033
- Table 87: ASEAN Leather Cleaners Revenue (million) Forecast, by Application 2020 & 2033
- Table 88: ASEAN Leather Cleaners Volume (K) Forecast, by Application 2020 & 2033
- Table 89: Oceania Leather Cleaners Revenue (million) Forecast, by Application 2020 & 2033
- Table 90: Oceania Leather Cleaners Volume (K) Forecast, by Application 2020 & 2033
- Table 91: Rest of Asia Pacific Leather Cleaners Revenue (million) Forecast, by Application 2020 & 2033
- Table 92: Rest of Asia Pacific Leather Cleaners Volume (K) Forecast, by Application 2020 & 2033
Frequently Asked Questions
1. What is the projected Compound Annual Growth Rate (CAGR) of the Leather Cleaners?
The projected CAGR is approximately XX%.
2. Which companies are prominent players in the Leather Cleaners?
Key companies in the market include Energizer Holdings(LEXOL), Weiman, Chemical Guys, Leather Honey, Bickmore, TriNova, Cadillac, Mr. Leather, Meguiar's, Aero Cosmetics, Glacier Car Care, CarGuys, Leather-Clean.
3. What are the main segments of the Leather Cleaners?
The market segments include Application, Types.
4. Can you provide details about the market size?
The market size is estimated to be USD XXX million as of 2022.
5. What are some drivers contributing to market growth?
N/A
6. What are the notable trends driving market growth?
N/A
7. Are there any restraints impacting market growth?
N/A
8. Can you provide examples of recent developments in the market?
N/A
9. What pricing options are available for accessing the report?
Pricing options include single-user, multi-user, and enterprise licenses priced at USD 3350.00, USD 5025.00, and USD 6700.00 respectively.
10. Is the market size provided in terms of value or volume?
The market size is provided in terms of value, measured in million and volume, measured in K.
11. Are there any specific market keywords associated with the report?
Yes, the market keyword associated with the report is "Leather Cleaners," which aids in identifying and referencing the specific market segment covered.
12. How do I determine which pricing option suits my needs best?
The pricing options vary based on user requirements and access needs. Individual users may opt for single-user licenses, while businesses requiring broader access may choose multi-user or enterprise licenses for cost-effective access to the report.
13. Are there any additional resources or data provided in the Leather Cleaners report?
While the report offers comprehensive insights, it's advisable to review the specific contents or supplementary materials provided to ascertain if additional resources or data are available.
14. How can I stay updated on further developments or reports in the Leather Cleaners?
To stay informed about further developments, trends, and reports in the Leather Cleaners, consider subscribing to industry newsletters, following relevant companies and organizations, or regularly checking reputable industry news sources and publications.
Methodology
Step 1 - Identification of Relevant Samples Size from Population Database


Step 2 - Approaches for Defining Global Market Size (Value, Volume* & Price*)

Note*: In applicable scenarios
Step 3 - Data Sources
Primary Research
- Web Analytics
- Survey Reports
- Research Institute
- Latest Research Reports
- Opinion Leaders
Secondary Research
- Annual Reports
- White Paper
- Latest Press Release
- Industry Association
- Paid Database
- Investor Presentations

Step 4 - Data Triangulation
Involves using different sources of information in order to increase the validity of a study
These sources are likely to be stakeholders in a program - participants, other researchers, program staff, other community members, and so on.
Then we put all data in single framework & apply various statistical tools to find out the dynamic on the market.
During the analysis stage, feedback from the stakeholder groups would be compared to determine areas of agreement as well as areas of divergence