
Key Insights
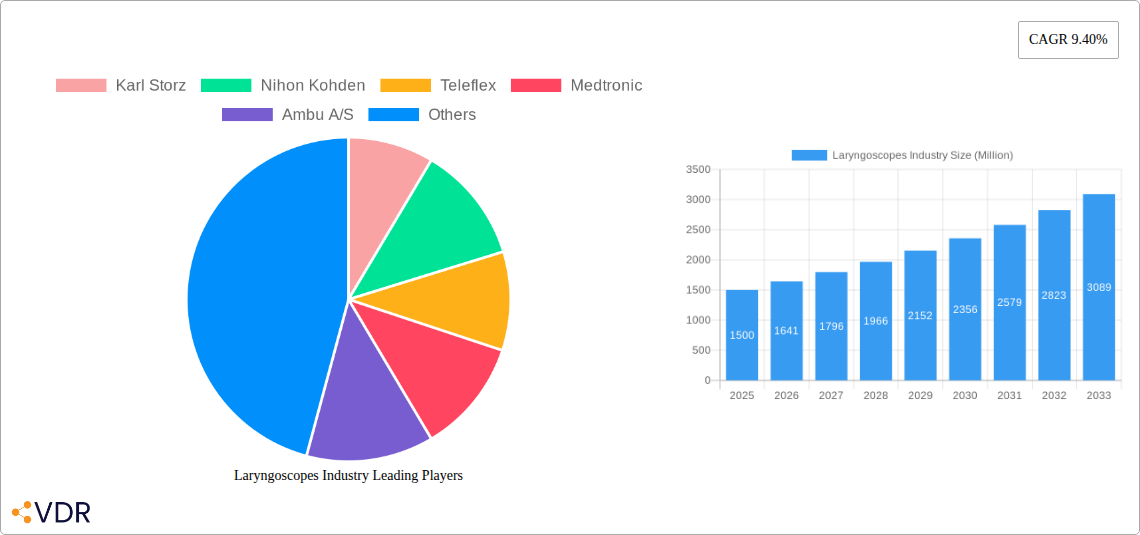
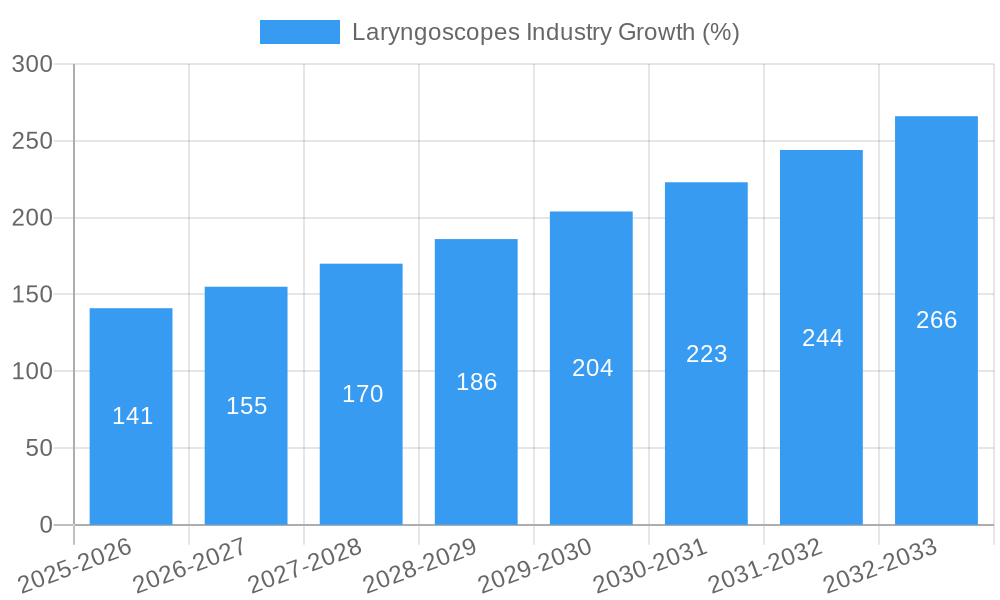
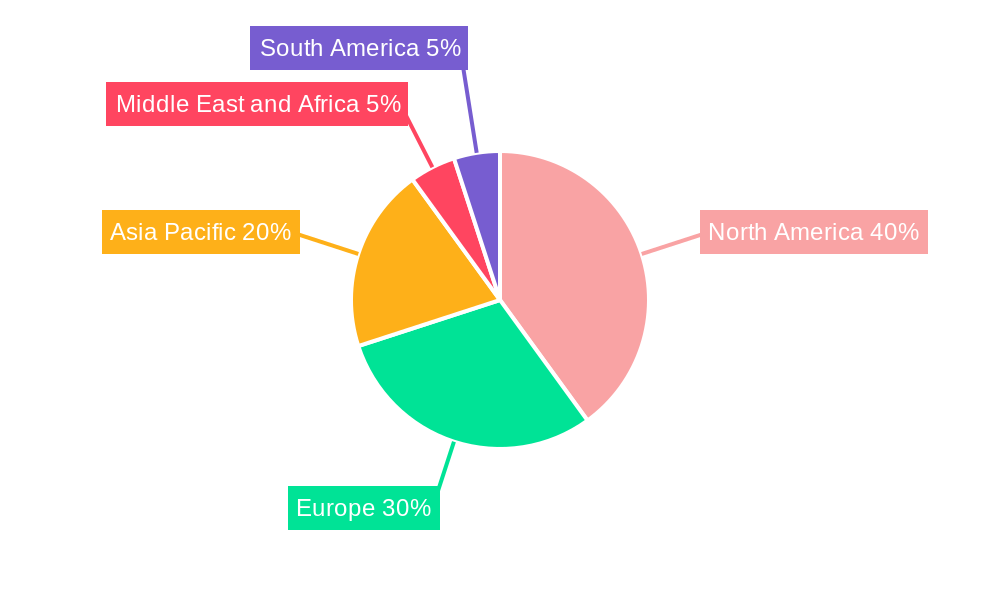
The global laryngoscopes market, valued at approximately $XX million in 2025, is projected to experience robust growth, exhibiting a Compound Annual Growth Rate (CAGR) of 9.40% from 2025 to 2033. This expansion is fueled by several key drivers. The rising prevalence of respiratory illnesses and surgical procedures globally necessitates the increased use of laryngoscopes for airway management. Technological advancements, particularly in video laryngoscopy offering enhanced visualization and improved ease of use, are significantly impacting market growth. Furthermore, the growing adoption of minimally invasive surgical techniques and the increasing preference for disposable laryngoscopes to reduce the risk of cross-contamination are contributing factors. However, market growth faces certain restraints, including the high cost of advanced laryngoscopy systems, especially video laryngoscopes, and the potential for limited reimbursement policies in certain healthcare systems. The market is segmented by end-user (hospitals, clinics, ambulatory surgical centers, and others), type (fiber optic and video laryngoscopes), component (laryngoscope blades, handles, consumables, and accessories), and usability (disposable and reusable). Major players like Karl Storz, Nihon Kohden, Teleflex, Medtronic, and Ambu A/S are actively shaping the market landscape through product innovation and strategic partnerships. The North American region currently holds a significant market share, driven by high healthcare expenditure and technological adoption. However, the Asia-Pacific region is anticipated to witness substantial growth during the forecast period, fueled by rising healthcare infrastructure development and increasing disposable incomes.
The competitive landscape is characterized by the presence of established players and emerging companies. Established players focus on innovation and expansion into new markets, while emerging companies are challenging the market with cost-effective solutions and niche products. The market is expected to see further consolidation through mergers, acquisitions, and strategic alliances. The demand for advanced features such as improved image quality, integrated recording capabilities, and enhanced ergonomics is driving product development in the market. Future growth will likely be influenced by factors such as the development of new materials for laryngoscope blades, integration of artificial intelligence in laryngoscopy systems, and evolving regulatory landscapes. The disposable segment is predicted to experience faster growth due to the increasing focus on infection control and hygiene protocols. Hospitals and clinics remain the dominant end-users, contributing the largest share of market revenue, however the ambulatory surgical centers segment is witnessing significant growth, further driving the demand for laryngoscopes.
Laryngoscopes Industry Market Report: 2019-2033
This comprehensive report provides a detailed analysis of the global laryngoscopes market, encompassing historical data (2019-2024), current estimates (2025), and future projections (2025-2033). It segments the market by end-user (hospitals, clinics, ambulatory surgical centers, other), type (fiber optic laryngoscope, video laryngoscope), component (laryngoscope blades, handle, consumables & accessories), and usability (disposable, reusable), offering a granular understanding of this critical medical device sector. Key players like Karl Storz, Nihon Kohden, Teleflex, and Medtronic are analyzed, revealing market dynamics and growth opportunities.
Laryngoscopes Industry Market Dynamics & Structure
The laryngoscopes market is characterized by a moderately concentrated landscape, with several multinational corporations holding significant market share. Technological innovation, particularly in video laryngoscopy and disposable devices, is a major driver, while regulatory frameworks (e.g., FDA approvals) significantly influence market access. The market faces competition from substitute technologies, albeit limited, and exhibits considerable end-user diversity across healthcare settings. M&A activity has been moderate, with a few significant deals in recent years focusing on expanding product portfolios and geographical reach. Over the study period (2019-2033), the total market value is projected to reach xx Million units.
- Market Concentration: Top 5 players account for approximately xx% of the market share in 2025.
- Technological Innovation: Focus on enhanced visualization, ease of use, and disposability.
- Regulatory Landscape: Stringent regulatory pathways and approvals are crucial for market entry.
- Competitive Substitutes: Limited, primarily involving alternative airway management techniques.
- M&A Activity: xx major acquisitions recorded between 2019 and 2024, primarily focused on geographic expansion and product diversification.
- Innovation Barriers: High R&D costs, stringent regulatory approvals, and intellectual property protection.
Laryngoscopes Industry Growth Trends & Insights
The global laryngoscopes market experienced robust growth between 2019 and 2024, driven by increasing surgical procedures, technological advancements, and rising healthcare expenditure. The market is expected to maintain a healthy Compound Annual Growth Rate (CAGR) of xx% during the forecast period (2025-2033), reaching a market value of xx Million units by 2033. This growth is fueled by the increasing adoption of minimally invasive procedures, the growing prevalence of chronic respiratory diseases, and the rising demand for improved patient outcomes. The shift towards disposable laryngoscopes is also contributing significantly to market expansion. Technological disruptions, such as the introduction of high-definition video laryngoscopes, are further accelerating market growth. Consumer behavior is shifting towards preference for devices with improved ergonomics and ease of use, impacting product design and development.
Dominant Regions, Countries, or Segments in Laryngoscopes Industry
North America and Europe currently dominate the laryngoscopes market, driven by advanced healthcare infrastructure, high adoption rates of minimally invasive procedures, and substantial healthcare spending. However, Asia-Pacific is emerging as a significant growth region due to rising healthcare awareness, increasing disposable incomes, and expanding healthcare infrastructure.
- By End-User: Hospitals currently hold the largest market share, followed by clinics and ambulatory surgical centers.
- By Type: Video laryngoscopes are experiencing faster growth compared to fiber optic laryngoscopes, driven by their improved visualization capabilities.
- By Component: Consumables and accessories represent a significant revenue stream, primarily due to higher replacement rates.
- By Usability: Disposable laryngoscopes are gaining popularity over reusable ones due to infection control concerns and cost-effectiveness in certain situations.
- Key Growth Drivers: Increasing prevalence of chronic diseases, rising surgical procedures, technological advancements (e.g., high-definition video laryngoscopes), and growing preference for disposable devices.
Laryngoscopes Industry Product Landscape
The laryngoscopes market offers a range of products catering to diverse clinical needs, from basic fiber optic laryngoscopes to advanced video laryngoscopes with high-resolution imaging and integrated recording capabilities. Recent innovations focus on improved ergonomics, enhanced visualization, and single-use designs for enhanced infection control. Unique selling propositions often center on image quality, ease of use, disposability, and integrated features such as image storage and analysis. The market continues to see advancements in miniaturization, improved lighting, and integration of smart features.
Key Drivers, Barriers & Challenges in Laryngoscopes Industry
Key Drivers:
- Rising prevalence of respiratory diseases requiring airway management.
- Increasing demand for minimally invasive procedures.
- Technological advancements improving visualization and ease of use.
- Growing preference for disposable devices for infection control.
Key Challenges:
- High initial investment for advanced video laryngoscopes, potentially limiting adoption in resource-constrained settings.
- Stringent regulatory requirements impacting time-to-market for new products.
- Intense competition among established players and emerging companies.
- Supply chain disruptions affecting the availability of raw materials and components. This resulted in a xx% increase in manufacturing costs in 2022.
Emerging Opportunities in Laryngoscopes Industry
- Expanding into emerging markets with increasing healthcare spending.
- Development of innovative laryngoscope designs incorporating AI and machine learning for improved diagnostic capabilities.
- Development of specialized laryngoscopes for specific patient populations (e.g., pediatrics).
- Growing adoption of telehealth and remote patient monitoring creates opportunities for integrating laryngoscopy into virtual care settings.
Growth Accelerators in the Laryngoscopes Industry
Technological advancements, strategic partnerships to expand product portfolios and market reach, and aggressive marketing strategies focused on highlighting the benefits of newer technologies are key catalysts for long-term growth in the laryngoscopes market.
Key Players Shaping the Laryngoscopes Industry Market
- Karl Storz
- Nihon Kohden
- Teleflex
- Medtronic
- Ambu A/S
- Baxter (Hillrom)
- BPL Group (Penlon Ltd)
- Olympus Corporation
- Clarus Medical LLC
- Flexicare Medical Ltd
Notable Milestones in Laryngoscopes Industry Sector
- November 2022: PROACT Medical launched a new line of single-use laryngoscopes in the European market.
- July 2022: Zsquare received FDA clearance for its Zsquare ENT-Flex Rhinolaryngoscope.
In-Depth Laryngoscopes Industry Market Outlook
The laryngoscopes market is poised for continued growth, driven by technological innovation and increasing demand for advanced airway management solutions. Strategic partnerships, product diversification, and expansion into emerging markets present significant opportunities for key players. The focus on disposability and improved visualization will further shape market dynamics in the coming years. The market is expected to witness the introduction of more sophisticated and integrated devices, enhancing diagnostic capabilities and improving patient outcomes.
Laryngoscopes Industry Segmentation
-
1. Type
- 1.1. Fiber Optic Laryngoscope
- 1.2. Video Laryngoscope
-
2. Component
- 2.1. Laryngoscope Blades
- 2.2. Handle
- 2.3. Consumables and Accessories
-
3. Usability
- 3.1. Disposable
- 3.2. Reusable
-
4. End-User
- 4.1. Hospital
- 4.2. Clinics
- 4.3. Ambulatory Surgical Centers
- 4.4. Other End-Users
Laryngoscopes Industry Segmentation By Geography
-
1. North America
- 1.1. United States
- 1.2. Canada
- 1.3. Mexico
-
2. Europe
- 2.1. Germany
- 2.2. United Kingdom
- 2.3. France
- 2.4. Italy
- 2.5. Spain
- 2.6. Rest of Europe
-
3. Asia Pacific
- 3.1. China
- 3.2. Japan
- 3.3. India
- 3.4. Australia
- 3.5. South Korea
- 3.6. Rest of Asia Pacific
-
4. Middle East and Africa
- 4.1. GCC
- 4.2. South Africa
- 4.3. Rest of Middle East and Africa
-
5. South America
- 5.1. Brazil
- 5.2. Argentina
- 5.3. Rest of South America
Laryngoscopes Industry REPORT HIGHLIGHTS
| Aspects | Details |
|---|---|
| Study Period | 2019-2033 |
| Base Year | 2024 |
| Estimated Year | 2025 |
| Forecast Period | 2025-2033 |
| Historical Period | 2019-2024 |
| Growth Rate | CAGR of 9.40% from 2019-2033 |
| Segmentation |
|
Table of Contents
- 1. Introduction
- 1.1. Research Scope
- 1.2. Market Segmentation
- 1.3. Research Methodology
- 1.4. Definitions and Assumptions
- 2. Executive Summary
- 2.1. Introduction
- 3. Market Dynamics
- 3.1. Introduction
- 3.2. Market Drivers
- 3.2.1. Increasing Prevalence of Laryngeal Disease and Rise in the Use of Laryngoscopes in Airway Management; Introduction of Technologically Advanced Products
- 3.3. Market Restrains
- 3.3.1. Injuries Associated with the Use of Laryngoscopes
- 3.4. Market Trends
- 3.4.1. Video Laryngoscope Segment is Expected to Witness Growth Over the Forecast Period
- 4. Market Factor Analysis
- 4.1. Porters Five Forces
- 4.2. Supply/Value Chain
- 4.3. PESTEL analysis
- 4.4. Market Entropy
- 4.5. Patent/Trademark Analysis
- 5. Global Laryngoscopes Industry Analysis, Insights and Forecast, 2019-2031
- 5.1. Market Analysis, Insights and Forecast - by Type
- 5.1.1. Fiber Optic Laryngoscope
- 5.1.2. Video Laryngoscope
- 5.2. Market Analysis, Insights and Forecast - by Component
- 5.2.1. Laryngoscope Blades
- 5.2.2. Handle
- 5.2.3. Consumables and Accessories
- 5.3. Market Analysis, Insights and Forecast - by Usability
- 5.3.1. Disposable
- 5.3.2. Reusable
- 5.4. Market Analysis, Insights and Forecast - by End-User
- 5.4.1. Hospital
- 5.4.2. Clinics
- 5.4.3. Ambulatory Surgical Centers
- 5.4.4. Other End-Users
- 5.5. Market Analysis, Insights and Forecast - by Region
- 5.5.1. North America
- 5.5.2. Europe
- 5.5.3. Asia Pacific
- 5.5.4. Middle East and Africa
- 5.5.5. South America
- 5.1. Market Analysis, Insights and Forecast - by Type
- 6. North America Laryngoscopes Industry Analysis, Insights and Forecast, 2019-2031
- 6.1. Market Analysis, Insights and Forecast - by Type
- 6.1.1. Fiber Optic Laryngoscope
- 6.1.2. Video Laryngoscope
- 6.2. Market Analysis, Insights and Forecast - by Component
- 6.2.1. Laryngoscope Blades
- 6.2.2. Handle
- 6.2.3. Consumables and Accessories
- 6.3. Market Analysis, Insights and Forecast - by Usability
- 6.3.1. Disposable
- 6.3.2. Reusable
- 6.4. Market Analysis, Insights and Forecast - by End-User
- 6.4.1. Hospital
- 6.4.2. Clinics
- 6.4.3. Ambulatory Surgical Centers
- 6.4.4. Other End-Users
- 6.1. Market Analysis, Insights and Forecast - by Type
- 7. Europe Laryngoscopes Industry Analysis, Insights and Forecast, 2019-2031
- 7.1. Market Analysis, Insights and Forecast - by Type
- 7.1.1. Fiber Optic Laryngoscope
- 7.1.2. Video Laryngoscope
- 7.2. Market Analysis, Insights and Forecast - by Component
- 7.2.1. Laryngoscope Blades
- 7.2.2. Handle
- 7.2.3. Consumables and Accessories
- 7.3. Market Analysis, Insights and Forecast - by Usability
- 7.3.1. Disposable
- 7.3.2. Reusable
- 7.4. Market Analysis, Insights and Forecast - by End-User
- 7.4.1. Hospital
- 7.4.2. Clinics
- 7.4.3. Ambulatory Surgical Centers
- 7.4.4. Other End-Users
- 7.1. Market Analysis, Insights and Forecast - by Type
- 8. Asia Pacific Laryngoscopes Industry Analysis, Insights and Forecast, 2019-2031
- 8.1. Market Analysis, Insights and Forecast - by Type
- 8.1.1. Fiber Optic Laryngoscope
- 8.1.2. Video Laryngoscope
- 8.2. Market Analysis, Insights and Forecast - by Component
- 8.2.1. Laryngoscope Blades
- 8.2.2. Handle
- 8.2.3. Consumables and Accessories
- 8.3. Market Analysis, Insights and Forecast - by Usability
- 8.3.1. Disposable
- 8.3.2. Reusable
- 8.4. Market Analysis, Insights and Forecast - by End-User
- 8.4.1. Hospital
- 8.4.2. Clinics
- 8.4.3. Ambulatory Surgical Centers
- 8.4.4. Other End-Users
- 8.1. Market Analysis, Insights and Forecast - by Type
- 9. Middle East and Africa Laryngoscopes Industry Analysis, Insights and Forecast, 2019-2031
- 9.1. Market Analysis, Insights and Forecast - by Type
- 9.1.1. Fiber Optic Laryngoscope
- 9.1.2. Video Laryngoscope
- 9.2. Market Analysis, Insights and Forecast - by Component
- 9.2.1. Laryngoscope Blades
- 9.2.2. Handle
- 9.2.3. Consumables and Accessories
- 9.3. Market Analysis, Insights and Forecast - by Usability
- 9.3.1. Disposable
- 9.3.2. Reusable
- 9.4. Market Analysis, Insights and Forecast - by End-User
- 9.4.1. Hospital
- 9.4.2. Clinics
- 9.4.3. Ambulatory Surgical Centers
- 9.4.4. Other End-Users
- 9.1. Market Analysis, Insights and Forecast - by Type
- 10. South America Laryngoscopes Industry Analysis, Insights and Forecast, 2019-2031
- 10.1. Market Analysis, Insights and Forecast - by Type
- 10.1.1. Fiber Optic Laryngoscope
- 10.1.2. Video Laryngoscope
- 10.2. Market Analysis, Insights and Forecast - by Component
- 10.2.1. Laryngoscope Blades
- 10.2.2. Handle
- 10.2.3. Consumables and Accessories
- 10.3. Market Analysis, Insights and Forecast - by Usability
- 10.3.1. Disposable
- 10.3.2. Reusable
- 10.4. Market Analysis, Insights and Forecast - by End-User
- 10.4.1. Hospital
- 10.4.2. Clinics
- 10.4.3. Ambulatory Surgical Centers
- 10.4.4. Other End-Users
- 10.1. Market Analysis, Insights and Forecast - by Type
- 11. North America Laryngoscopes Industry Analysis, Insights and Forecast, 2019-2031
- 11.1. Market Analysis, Insights and Forecast - By Country/Sub-region
- 11.1.1. undefined
- 12. Europe Laryngoscopes Industry Analysis, Insights and Forecast, 2019-2031
- 12.1. Market Analysis, Insights and Forecast - By Country/Sub-region
- 12.1.1. undefined
- 13. Asia Pacific Laryngoscopes Industry Analysis, Insights and Forecast, 2019-2031
- 13.1. Market Analysis, Insights and Forecast - By Country/Sub-region
- 13.1.1. undefined
- 14. Middle East and Africa Laryngoscopes Industry Analysis, Insights and Forecast, 2019-2031
- 14.1. Market Analysis, Insights and Forecast - By Country/Sub-region
- 14.1.1. undefined
- 15. South America Laryngoscopes Industry Analysis, Insights and Forecast, 2019-2031
- 15.1. Market Analysis, Insights and Forecast - By Country/Sub-region
- 15.1.1. undefined
- 16. Competitive Analysis
- 16.1. Global Market Share Analysis 2024
- 16.2. Company Profiles
- 16.2.1 Karl Storz
- 16.2.1.1. Overview
- 16.2.1.2. Products
- 16.2.1.3. SWOT Analysis
- 16.2.1.4. Recent Developments
- 16.2.1.5. Financials (Based on Availability)
- 16.2.2 Nihon Kohden
- 16.2.2.1. Overview
- 16.2.2.2. Products
- 16.2.2.3. SWOT Analysis
- 16.2.2.4. Recent Developments
- 16.2.2.5. Financials (Based on Availability)
- 16.2.3 Teleflex
- 16.2.3.1. Overview
- 16.2.3.2. Products
- 16.2.3.3. SWOT Analysis
- 16.2.3.4. Recent Developments
- 16.2.3.5. Financials (Based on Availability)
- 16.2.4 Medtronic
- 16.2.4.1. Overview
- 16.2.4.2. Products
- 16.2.4.3. SWOT Analysis
- 16.2.4.4. Recent Developments
- 16.2.4.5. Financials (Based on Availability)
- 16.2.5 Ambu A/S
- 16.2.5.1. Overview
- 16.2.5.2. Products
- 16.2.5.3. SWOT Analysis
- 16.2.5.4. Recent Developments
- 16.2.5.5. Financials (Based on Availability)
- 16.2.6 Baxter (Hillrom)
- 16.2.6.1. Overview
- 16.2.6.2. Products
- 16.2.6.3. SWOT Analysis
- 16.2.6.4. Recent Developments
- 16.2.6.5. Financials (Based on Availability)
- 16.2.7 BPL Group (Penlon Ltd)
- 16.2.7.1. Overview
- 16.2.7.2. Products
- 16.2.7.3. SWOT Analysis
- 16.2.7.4. Recent Developments
- 16.2.7.5. Financials (Based on Availability)
- 16.2.8 Olympus Corporation
- 16.2.8.1. Overview
- 16.2.8.2. Products
- 16.2.8.3. SWOT Analysis
- 16.2.8.4. Recent Developments
- 16.2.8.5. Financials (Based on Availability)
- 16.2.9 Clarus Medical LLC
- 16.2.9.1. Overview
- 16.2.9.2. Products
- 16.2.9.3. SWOT Analysis
- 16.2.9.4. Recent Developments
- 16.2.9.5. Financials (Based on Availability)
- 16.2.10 Flexicare Medical Ltd
- 16.2.10.1. Overview
- 16.2.10.2. Products
- 16.2.10.3. SWOT Analysis
- 16.2.10.4. Recent Developments
- 16.2.10.5. Financials (Based on Availability)
- 16.2.1 Karl Storz
List of Figures
- Figure 1: Global Laryngoscopes Industry Revenue Breakdown (Million, %) by Region 2024 & 2032
- Figure 2: Global Laryngoscopes Industry Volume Breakdown (K Unit, %) by Region 2024 & 2032
- Figure 3: North America Laryngoscopes Industry Revenue (Million), by Country 2024 & 2032
- Figure 4: North America Laryngoscopes Industry Volume (K Unit), by Country 2024 & 2032
- Figure 5: North America Laryngoscopes Industry Revenue Share (%), by Country 2024 & 2032
- Figure 6: North America Laryngoscopes Industry Volume Share (%), by Country 2024 & 2032
- Figure 7: Europe Laryngoscopes Industry Revenue (Million), by Country 2024 & 2032
- Figure 8: Europe Laryngoscopes Industry Volume (K Unit), by Country 2024 & 2032
- Figure 9: Europe Laryngoscopes Industry Revenue Share (%), by Country 2024 & 2032
- Figure 10: Europe Laryngoscopes Industry Volume Share (%), by Country 2024 & 2032
- Figure 11: Asia Pacific Laryngoscopes Industry Revenue (Million), by Country 2024 & 2032
- Figure 12: Asia Pacific Laryngoscopes Industry Volume (K Unit), by Country 2024 & 2032
- Figure 13: Asia Pacific Laryngoscopes Industry Revenue Share (%), by Country 2024 & 2032
- Figure 14: Asia Pacific Laryngoscopes Industry Volume Share (%), by Country 2024 & 2032
- Figure 15: Middle East and Africa Laryngoscopes Industry Revenue (Million), by Country 2024 & 2032
- Figure 16: Middle East and Africa Laryngoscopes Industry Volume (K Unit), by Country 2024 & 2032
- Figure 17: Middle East and Africa Laryngoscopes Industry Revenue Share (%), by Country 2024 & 2032
- Figure 18: Middle East and Africa Laryngoscopes Industry Volume Share (%), by Country 2024 & 2032
- Figure 19: South America Laryngoscopes Industry Revenue (Million), by Country 2024 & 2032
- Figure 20: South America Laryngoscopes Industry Volume (K Unit), by Country 2024 & 2032
- Figure 21: South America Laryngoscopes Industry Revenue Share (%), by Country 2024 & 2032
- Figure 22: South America Laryngoscopes Industry Volume Share (%), by Country 2024 & 2032
- Figure 23: North America Laryngoscopes Industry Revenue (Million), by Type 2024 & 2032
- Figure 24: North America Laryngoscopes Industry Volume (K Unit), by Type 2024 & 2032
- Figure 25: North America Laryngoscopes Industry Revenue Share (%), by Type 2024 & 2032
- Figure 26: North America Laryngoscopes Industry Volume Share (%), by Type 2024 & 2032
- Figure 27: North America Laryngoscopes Industry Revenue (Million), by Component 2024 & 2032
- Figure 28: North America Laryngoscopes Industry Volume (K Unit), by Component 2024 & 2032
- Figure 29: North America Laryngoscopes Industry Revenue Share (%), by Component 2024 & 2032
- Figure 30: North America Laryngoscopes Industry Volume Share (%), by Component 2024 & 2032
- Figure 31: North America Laryngoscopes Industry Revenue (Million), by Usability 2024 & 2032
- Figure 32: North America Laryngoscopes Industry Volume (K Unit), by Usability 2024 & 2032
- Figure 33: North America Laryngoscopes Industry Revenue Share (%), by Usability 2024 & 2032
- Figure 34: North America Laryngoscopes Industry Volume Share (%), by Usability 2024 & 2032
- Figure 35: North America Laryngoscopes Industry Revenue (Million), by End-User 2024 & 2032
- Figure 36: North America Laryngoscopes Industry Volume (K Unit), by End-User 2024 & 2032
- Figure 37: North America Laryngoscopes Industry Revenue Share (%), by End-User 2024 & 2032
- Figure 38: North America Laryngoscopes Industry Volume Share (%), by End-User 2024 & 2032
- Figure 39: North America Laryngoscopes Industry Revenue (Million), by Country 2024 & 2032
- Figure 40: North America Laryngoscopes Industry Volume (K Unit), by Country 2024 & 2032
- Figure 41: North America Laryngoscopes Industry Revenue Share (%), by Country 2024 & 2032
- Figure 42: North America Laryngoscopes Industry Volume Share (%), by Country 2024 & 2032
- Figure 43: Europe Laryngoscopes Industry Revenue (Million), by Type 2024 & 2032
- Figure 44: Europe Laryngoscopes Industry Volume (K Unit), by Type 2024 & 2032
- Figure 45: Europe Laryngoscopes Industry Revenue Share (%), by Type 2024 & 2032
- Figure 46: Europe Laryngoscopes Industry Volume Share (%), by Type 2024 & 2032
- Figure 47: Europe Laryngoscopes Industry Revenue (Million), by Component 2024 & 2032
- Figure 48: Europe Laryngoscopes Industry Volume (K Unit), by Component 2024 & 2032
- Figure 49: Europe Laryngoscopes Industry Revenue Share (%), by Component 2024 & 2032
- Figure 50: Europe Laryngoscopes Industry Volume Share (%), by Component 2024 & 2032
- Figure 51: Europe Laryngoscopes Industry Revenue (Million), by Usability 2024 & 2032
- Figure 52: Europe Laryngoscopes Industry Volume (K Unit), by Usability 2024 & 2032
- Figure 53: Europe Laryngoscopes Industry Revenue Share (%), by Usability 2024 & 2032
- Figure 54: Europe Laryngoscopes Industry Volume Share (%), by Usability 2024 & 2032
- Figure 55: Europe Laryngoscopes Industry Revenue (Million), by End-User 2024 & 2032
- Figure 56: Europe Laryngoscopes Industry Volume (K Unit), by End-User 2024 & 2032
- Figure 57: Europe Laryngoscopes Industry Revenue Share (%), by End-User 2024 & 2032
- Figure 58: Europe Laryngoscopes Industry Volume Share (%), by End-User 2024 & 2032
- Figure 59: Europe Laryngoscopes Industry Revenue (Million), by Country 2024 & 2032
- Figure 60: Europe Laryngoscopes Industry Volume (K Unit), by Country 2024 & 2032
- Figure 61: Europe Laryngoscopes Industry Revenue Share (%), by Country 2024 & 2032
- Figure 62: Europe Laryngoscopes Industry Volume Share (%), by Country 2024 & 2032
- Figure 63: Asia Pacific Laryngoscopes Industry Revenue (Million), by Type 2024 & 2032
- Figure 64: Asia Pacific Laryngoscopes Industry Volume (K Unit), by Type 2024 & 2032
- Figure 65: Asia Pacific Laryngoscopes Industry Revenue Share (%), by Type 2024 & 2032
- Figure 66: Asia Pacific Laryngoscopes Industry Volume Share (%), by Type 2024 & 2032
- Figure 67: Asia Pacific Laryngoscopes Industry Revenue (Million), by Component 2024 & 2032
- Figure 68: Asia Pacific Laryngoscopes Industry Volume (K Unit), by Component 2024 & 2032
- Figure 69: Asia Pacific Laryngoscopes Industry Revenue Share (%), by Component 2024 & 2032
- Figure 70: Asia Pacific Laryngoscopes Industry Volume Share (%), by Component 2024 & 2032
- Figure 71: Asia Pacific Laryngoscopes Industry Revenue (Million), by Usability 2024 & 2032
- Figure 72: Asia Pacific Laryngoscopes Industry Volume (K Unit), by Usability 2024 & 2032
- Figure 73: Asia Pacific Laryngoscopes Industry Revenue Share (%), by Usability 2024 & 2032
- Figure 74: Asia Pacific Laryngoscopes Industry Volume Share (%), by Usability 2024 & 2032
- Figure 75: Asia Pacific Laryngoscopes Industry Revenue (Million), by End-User 2024 & 2032
- Figure 76: Asia Pacific Laryngoscopes Industry Volume (K Unit), by End-User 2024 & 2032
- Figure 77: Asia Pacific Laryngoscopes Industry Revenue Share (%), by End-User 2024 & 2032
- Figure 78: Asia Pacific Laryngoscopes Industry Volume Share (%), by End-User 2024 & 2032
- Figure 79: Asia Pacific Laryngoscopes Industry Revenue (Million), by Country 2024 & 2032
- Figure 80: Asia Pacific Laryngoscopes Industry Volume (K Unit), by Country 2024 & 2032
- Figure 81: Asia Pacific Laryngoscopes Industry Revenue Share (%), by Country 2024 & 2032
- Figure 82: Asia Pacific Laryngoscopes Industry Volume Share (%), by Country 2024 & 2032
- Figure 83: Middle East and Africa Laryngoscopes Industry Revenue (Million), by Type 2024 & 2032
- Figure 84: Middle East and Africa Laryngoscopes Industry Volume (K Unit), by Type 2024 & 2032
- Figure 85: Middle East and Africa Laryngoscopes Industry Revenue Share (%), by Type 2024 & 2032
- Figure 86: Middle East and Africa Laryngoscopes Industry Volume Share (%), by Type 2024 & 2032
- Figure 87: Middle East and Africa Laryngoscopes Industry Revenue (Million), by Component 2024 & 2032
- Figure 88: Middle East and Africa Laryngoscopes Industry Volume (K Unit), by Component 2024 & 2032
- Figure 89: Middle East and Africa Laryngoscopes Industry Revenue Share (%), by Component 2024 & 2032
- Figure 90: Middle East and Africa Laryngoscopes Industry Volume Share (%), by Component 2024 & 2032
- Figure 91: Middle East and Africa Laryngoscopes Industry Revenue (Million), by Usability 2024 & 2032
- Figure 92: Middle East and Africa Laryngoscopes Industry Volume (K Unit), by Usability 2024 & 2032
- Figure 93: Middle East and Africa Laryngoscopes Industry Revenue Share (%), by Usability 2024 & 2032
- Figure 94: Middle East and Africa Laryngoscopes Industry Volume Share (%), by Usability 2024 & 2032
- Figure 95: Middle East and Africa Laryngoscopes Industry Revenue (Million), by End-User 2024 & 2032
- Figure 96: Middle East and Africa Laryngoscopes Industry Volume (K Unit), by End-User 2024 & 2032
- Figure 97: Middle East and Africa Laryngoscopes Industry Revenue Share (%), by End-User 2024 & 2032
- Figure 98: Middle East and Africa Laryngoscopes Industry Volume Share (%), by End-User 2024 & 2032
- Figure 99: Middle East and Africa Laryngoscopes Industry Revenue (Million), by Country 2024 & 2032
- Figure 100: Middle East and Africa Laryngoscopes Industry Volume (K Unit), by Country 2024 & 2032
- Figure 101: Middle East and Africa Laryngoscopes Industry Revenue Share (%), by Country 2024 & 2032
- Figure 102: Middle East and Africa Laryngoscopes Industry Volume Share (%), by Country 2024 & 2032
- Figure 103: South America Laryngoscopes Industry Revenue (Million), by Type 2024 & 2032
- Figure 104: South America Laryngoscopes Industry Volume (K Unit), by Type 2024 & 2032
- Figure 105: South America Laryngoscopes Industry Revenue Share (%), by Type 2024 & 2032
- Figure 106: South America Laryngoscopes Industry Volume Share (%), by Type 2024 & 2032
- Figure 107: South America Laryngoscopes Industry Revenue (Million), by Component 2024 & 2032
- Figure 108: South America Laryngoscopes Industry Volume (K Unit), by Component 2024 & 2032
- Figure 109: South America Laryngoscopes Industry Revenue Share (%), by Component 2024 & 2032
- Figure 110: South America Laryngoscopes Industry Volume Share (%), by Component 2024 & 2032
- Figure 111: South America Laryngoscopes Industry Revenue (Million), by Usability 2024 & 2032
- Figure 112: South America Laryngoscopes Industry Volume (K Unit), by Usability 2024 & 2032
- Figure 113: South America Laryngoscopes Industry Revenue Share (%), by Usability 2024 & 2032
- Figure 114: South America Laryngoscopes Industry Volume Share (%), by Usability 2024 & 2032
- Figure 115: South America Laryngoscopes Industry Revenue (Million), by End-User 2024 & 2032
- Figure 116: South America Laryngoscopes Industry Volume (K Unit), by End-User 2024 & 2032
- Figure 117: South America Laryngoscopes Industry Revenue Share (%), by End-User 2024 & 2032
- Figure 118: South America Laryngoscopes Industry Volume Share (%), by End-User 2024 & 2032
- Figure 119: South America Laryngoscopes Industry Revenue (Million), by Country 2024 & 2032
- Figure 120: South America Laryngoscopes Industry Volume (K Unit), by Country 2024 & 2032
- Figure 121: South America Laryngoscopes Industry Revenue Share (%), by Country 2024 & 2032
- Figure 122: South America Laryngoscopes Industry Volume Share (%), by Country 2024 & 2032
List of Tables
- Table 1: Global Laryngoscopes Industry Revenue Million Forecast, by Region 2019 & 2032
- Table 2: Global Laryngoscopes Industry Volume K Unit Forecast, by Region 2019 & 2032
- Table 3: Global Laryngoscopes Industry Revenue Million Forecast, by Type 2019 & 2032
- Table 4: Global Laryngoscopes Industry Volume K Unit Forecast, by Type 2019 & 2032
- Table 5: Global Laryngoscopes Industry Revenue Million Forecast, by Component 2019 & 2032
- Table 6: Global Laryngoscopes Industry Volume K Unit Forecast, by Component 2019 & 2032
- Table 7: Global Laryngoscopes Industry Revenue Million Forecast, by Usability 2019 & 2032
- Table 8: Global Laryngoscopes Industry Volume K Unit Forecast, by Usability 2019 & 2032
- Table 9: Global Laryngoscopes Industry Revenue Million Forecast, by End-User 2019 & 2032
- Table 10: Global Laryngoscopes Industry Volume K Unit Forecast, by End-User 2019 & 2032
- Table 11: Global Laryngoscopes Industry Revenue Million Forecast, by Region 2019 & 2032
- Table 12: Global Laryngoscopes Industry Volume K Unit Forecast, by Region 2019 & 2032
- Table 13: Global Laryngoscopes Industry Revenue Million Forecast, by Country 2019 & 2032
- Table 14: Global Laryngoscopes Industry Volume K Unit Forecast, by Country 2019 & 2032
- Table 15: Global Laryngoscopes Industry Revenue Million Forecast, by Country 2019 & 2032
- Table 16: Global Laryngoscopes Industry Volume K Unit Forecast, by Country 2019 & 2032
- Table 17: Global Laryngoscopes Industry Revenue Million Forecast, by Country 2019 & 2032
- Table 18: Global Laryngoscopes Industry Volume K Unit Forecast, by Country 2019 & 2032
- Table 19: Global Laryngoscopes Industry Revenue Million Forecast, by Country 2019 & 2032
- Table 20: Global Laryngoscopes Industry Volume K Unit Forecast, by Country 2019 & 2032
- Table 21: Global Laryngoscopes Industry Revenue Million Forecast, by Country 2019 & 2032
- Table 22: Global Laryngoscopes Industry Volume K Unit Forecast, by Country 2019 & 2032
- Table 23: Global Laryngoscopes Industry Revenue Million Forecast, by Type 2019 & 2032
- Table 24: Global Laryngoscopes Industry Volume K Unit Forecast, by Type 2019 & 2032
- Table 25: Global Laryngoscopes Industry Revenue Million Forecast, by Component 2019 & 2032
- Table 26: Global Laryngoscopes Industry Volume K Unit Forecast, by Component 2019 & 2032
- Table 27: Global Laryngoscopes Industry Revenue Million Forecast, by Usability 2019 & 2032
- Table 28: Global Laryngoscopes Industry Volume K Unit Forecast, by Usability 2019 & 2032
- Table 29: Global Laryngoscopes Industry Revenue Million Forecast, by End-User 2019 & 2032
- Table 30: Global Laryngoscopes Industry Volume K Unit Forecast, by End-User 2019 & 2032
- Table 31: Global Laryngoscopes Industry Revenue Million Forecast, by Country 2019 & 2032
- Table 32: Global Laryngoscopes Industry Volume K Unit Forecast, by Country 2019 & 2032
- Table 33: United States Laryngoscopes Industry Revenue (Million) Forecast, by Application 2019 & 2032
- Table 34: United States Laryngoscopes Industry Volume (K Unit) Forecast, by Application 2019 & 2032
- Table 35: Canada Laryngoscopes Industry Revenue (Million) Forecast, by Application 2019 & 2032
- Table 36: Canada Laryngoscopes Industry Volume (K Unit) Forecast, by Application 2019 & 2032
- Table 37: Mexico Laryngoscopes Industry Revenue (Million) Forecast, by Application 2019 & 2032
- Table 38: Mexico Laryngoscopes Industry Volume (K Unit) Forecast, by Application 2019 & 2032
- Table 39: Global Laryngoscopes Industry Revenue Million Forecast, by Type 2019 & 2032
- Table 40: Global Laryngoscopes Industry Volume K Unit Forecast, by Type 2019 & 2032
- Table 41: Global Laryngoscopes Industry Revenue Million Forecast, by Component 2019 & 2032
- Table 42: Global Laryngoscopes Industry Volume K Unit Forecast, by Component 2019 & 2032
- Table 43: Global Laryngoscopes Industry Revenue Million Forecast, by Usability 2019 & 2032
- Table 44: Global Laryngoscopes Industry Volume K Unit Forecast, by Usability 2019 & 2032
- Table 45: Global Laryngoscopes Industry Revenue Million Forecast, by End-User 2019 & 2032
- Table 46: Global Laryngoscopes Industry Volume K Unit Forecast, by End-User 2019 & 2032
- Table 47: Global Laryngoscopes Industry Revenue Million Forecast, by Country 2019 & 2032
- Table 48: Global Laryngoscopes Industry Volume K Unit Forecast, by Country 2019 & 2032
- Table 49: Germany Laryngoscopes Industry Revenue (Million) Forecast, by Application 2019 & 2032
- Table 50: Germany Laryngoscopes Industry Volume (K Unit) Forecast, by Application 2019 & 2032
- Table 51: United Kingdom Laryngoscopes Industry Revenue (Million) Forecast, by Application 2019 & 2032
- Table 52: United Kingdom Laryngoscopes Industry Volume (K Unit) Forecast, by Application 2019 & 2032
- Table 53: France Laryngoscopes Industry Revenue (Million) Forecast, by Application 2019 & 2032
- Table 54: France Laryngoscopes Industry Volume (K Unit) Forecast, by Application 2019 & 2032
- Table 55: Italy Laryngoscopes Industry Revenue (Million) Forecast, by Application 2019 & 2032
- Table 56: Italy Laryngoscopes Industry Volume (K Unit) Forecast, by Application 2019 & 2032
- Table 57: Spain Laryngoscopes Industry Revenue (Million) Forecast, by Application 2019 & 2032
- Table 58: Spain Laryngoscopes Industry Volume (K Unit) Forecast, by Application 2019 & 2032
- Table 59: Rest of Europe Laryngoscopes Industry Revenue (Million) Forecast, by Application 2019 & 2032
- Table 60: Rest of Europe Laryngoscopes Industry Volume (K Unit) Forecast, by Application 2019 & 2032
- Table 61: Global Laryngoscopes Industry Revenue Million Forecast, by Type 2019 & 2032
- Table 62: Global Laryngoscopes Industry Volume K Unit Forecast, by Type 2019 & 2032
- Table 63: Global Laryngoscopes Industry Revenue Million Forecast, by Component 2019 & 2032
- Table 64: Global Laryngoscopes Industry Volume K Unit Forecast, by Component 2019 & 2032
- Table 65: Global Laryngoscopes Industry Revenue Million Forecast, by Usability 2019 & 2032
- Table 66: Global Laryngoscopes Industry Volume K Unit Forecast, by Usability 2019 & 2032
- Table 67: Global Laryngoscopes Industry Revenue Million Forecast, by End-User 2019 & 2032
- Table 68: Global Laryngoscopes Industry Volume K Unit Forecast, by End-User 2019 & 2032
- Table 69: Global Laryngoscopes Industry Revenue Million Forecast, by Country 2019 & 2032
- Table 70: Global Laryngoscopes Industry Volume K Unit Forecast, by Country 2019 & 2032
- Table 71: China Laryngoscopes Industry Revenue (Million) Forecast, by Application 2019 & 2032
- Table 72: China Laryngoscopes Industry Volume (K Unit) Forecast, by Application 2019 & 2032
- Table 73: Japan Laryngoscopes Industry Revenue (Million) Forecast, by Application 2019 & 2032
- Table 74: Japan Laryngoscopes Industry Volume (K Unit) Forecast, by Application 2019 & 2032
- Table 75: India Laryngoscopes Industry Revenue (Million) Forecast, by Application 2019 & 2032
- Table 76: India Laryngoscopes Industry Volume (K Unit) Forecast, by Application 2019 & 2032
- Table 77: Australia Laryngoscopes Industry Revenue (Million) Forecast, by Application 2019 & 2032
- Table 78: Australia Laryngoscopes Industry Volume (K Unit) Forecast, by Application 2019 & 2032
- Table 79: South Korea Laryngoscopes Industry Revenue (Million) Forecast, by Application 2019 & 2032
- Table 80: South Korea Laryngoscopes Industry Volume (K Unit) Forecast, by Application 2019 & 2032
- Table 81: Rest of Asia Pacific Laryngoscopes Industry Revenue (Million) Forecast, by Application 2019 & 2032
- Table 82: Rest of Asia Pacific Laryngoscopes Industry Volume (K Unit) Forecast, by Application 2019 & 2032
- Table 83: Global Laryngoscopes Industry Revenue Million Forecast, by Type 2019 & 2032
- Table 84: Global Laryngoscopes Industry Volume K Unit Forecast, by Type 2019 & 2032
- Table 85: Global Laryngoscopes Industry Revenue Million Forecast, by Component 2019 & 2032
- Table 86: Global Laryngoscopes Industry Volume K Unit Forecast, by Component 2019 & 2032
- Table 87: Global Laryngoscopes Industry Revenue Million Forecast, by Usability 2019 & 2032
- Table 88: Global Laryngoscopes Industry Volume K Unit Forecast, by Usability 2019 & 2032
- Table 89: Global Laryngoscopes Industry Revenue Million Forecast, by End-User 2019 & 2032
- Table 90: Global Laryngoscopes Industry Volume K Unit Forecast, by End-User 2019 & 2032
- Table 91: Global Laryngoscopes Industry Revenue Million Forecast, by Country 2019 & 2032
- Table 92: Global Laryngoscopes Industry Volume K Unit Forecast, by Country 2019 & 2032
- Table 93: GCC Laryngoscopes Industry Revenue (Million) Forecast, by Application 2019 & 2032
- Table 94: GCC Laryngoscopes Industry Volume (K Unit) Forecast, by Application 2019 & 2032
- Table 95: South Africa Laryngoscopes Industry Revenue (Million) Forecast, by Application 2019 & 2032
- Table 96: South Africa Laryngoscopes Industry Volume (K Unit) Forecast, by Application 2019 & 2032
- Table 97: Rest of Middle East and Africa Laryngoscopes Industry Revenue (Million) Forecast, by Application 2019 & 2032
- Table 98: Rest of Middle East and Africa Laryngoscopes Industry Volume (K Unit) Forecast, by Application 2019 & 2032
- Table 99: Global Laryngoscopes Industry Revenue Million Forecast, by Type 2019 & 2032
- Table 100: Global Laryngoscopes Industry Volume K Unit Forecast, by Type 2019 & 2032
- Table 101: Global Laryngoscopes Industry Revenue Million Forecast, by Component 2019 & 2032
- Table 102: Global Laryngoscopes Industry Volume K Unit Forecast, by Component 2019 & 2032
- Table 103: Global Laryngoscopes Industry Revenue Million Forecast, by Usability 2019 & 2032
- Table 104: Global Laryngoscopes Industry Volume K Unit Forecast, by Usability 2019 & 2032
- Table 105: Global Laryngoscopes Industry Revenue Million Forecast, by End-User 2019 & 2032
- Table 106: Global Laryngoscopes Industry Volume K Unit Forecast, by End-User 2019 & 2032
- Table 107: Global Laryngoscopes Industry Revenue Million Forecast, by Country 2019 & 2032
- Table 108: Global Laryngoscopes Industry Volume K Unit Forecast, by Country 2019 & 2032
- Table 109: Brazil Laryngoscopes Industry Revenue (Million) Forecast, by Application 2019 & 2032
- Table 110: Brazil Laryngoscopes Industry Volume (K Unit) Forecast, by Application 2019 & 2032
- Table 111: Argentina Laryngoscopes Industry Revenue (Million) Forecast, by Application 2019 & 2032
- Table 112: Argentina Laryngoscopes Industry Volume (K Unit) Forecast, by Application 2019 & 2032
- Table 113: Rest of South America Laryngoscopes Industry Revenue (Million) Forecast, by Application 2019 & 2032
- Table 114: Rest of South America Laryngoscopes Industry Volume (K Unit) Forecast, by Application 2019 & 2032
Frequently Asked Questions
1. What is the projected Compound Annual Growth Rate (CAGR) of the Laryngoscopes Industry?
The projected CAGR is approximately 9.40%.
2. Which companies are prominent players in the Laryngoscopes Industry?
Key companies in the market include Karl Storz, Nihon Kohden, Teleflex, Medtronic, Ambu A/S, Baxter (Hillrom), BPL Group (Penlon Ltd), Olympus Corporation, Clarus Medical LLC, Flexicare Medical Ltd.
3. What are the main segments of the Laryngoscopes Industry?
The market segments include Type, Component, Usability, End-User.
4. Can you provide details about the market size?
The market size is estimated to be USD XX Million as of 2022.
5. What are some drivers contributing to market growth?
Increasing Prevalence of Laryngeal Disease and Rise in the Use of Laryngoscopes in Airway Management; Introduction of Technologically Advanced Products.
6. What are the notable trends driving market growth?
Video Laryngoscope Segment is Expected to Witness Growth Over the Forecast Period.
7. Are there any restraints impacting market growth?
Injuries Associated with the Use of Laryngoscopes.
8. Can you provide examples of recent developments in the market?
In November 2022, PROACT Medical launched an innovative new range of gas sampling lines along with their new line of single-use laryngoscopes in the European market.
9. What pricing options are available for accessing the report?
Pricing options include single-user, multi-user, and enterprise licenses priced at USD 4750, USD 5250, and USD 8750 respectively.
10. Is the market size provided in terms of value or volume?
The market size is provided in terms of value, measured in Million and volume, measured in K Unit.
11. Are there any specific market keywords associated with the report?
Yes, the market keyword associated with the report is "Laryngoscopes Industry," which aids in identifying and referencing the specific market segment covered.
12. How do I determine which pricing option suits my needs best?
The pricing options vary based on user requirements and access needs. Individual users may opt for single-user licenses, while businesses requiring broader access may choose multi-user or enterprise licenses for cost-effective access to the report.
13. Are there any additional resources or data provided in the Laryngoscopes Industry report?
While the report offers comprehensive insights, it's advisable to review the specific contents or supplementary materials provided to ascertain if additional resources or data are available.
14. How can I stay updated on further developments or reports in the Laryngoscopes Industry?
To stay informed about further developments, trends, and reports in the Laryngoscopes Industry, consider subscribing to industry newsletters, following relevant companies and organizations, or regularly checking reputable industry news sources and publications.
Methodology
Step 1 - Identification of Relevant Samples Size from Population Database


Step 2 - Approaches for Defining Global Market Size (Value, Volume* & Price*)

Note*: In applicable scenarios
Step 3 - Data Sources
Primary Research
- Web Analytics
- Survey Reports
- Research Institute
- Latest Research Reports
- Opinion Leaders
Secondary Research
- Annual Reports
- White Paper
- Latest Press Release
- Industry Association
- Paid Database
- Investor Presentations

Step 4 - Data Triangulation
Involves using different sources of information in order to increase the validity of a study
These sources are likely to be stakeholders in a program - participants, other researchers, program staff, other community members, and so on.
Then we put all data in single framework & apply various statistical tools to find out the dynamic on the market.
During the analysis stage, feedback from the stakeholder groups would be compared to determine areas of agreement as well as areas of divergence


