

Key Insights
The global lanolin market is projected to reach 445.439 million by 2033, with a compound annual growth rate (CAGR) of 3.22% from the base year 2025. This growth is propelled by increasing demand for natural and sustainable ingredients in cosmetics and personal care, owing to lanolin's emollient and moisturizing properties. The pharmaceutical sector's expanding use of lanolin in ointments and creams for its therapeutic benefits also contributes significantly. Advancements in lanolin processing and refinement are yielding higher-quality products, further fueling market expansion. Key benefiting segments include cosmetics and pharmaceuticals, with Asia-Pacific anticipated to experience substantial regional growth driven by rising consumer spending and a burgeoning personal care market. Potential restraints involve raw material price volatility, availability of high-quality lanolin, and competition from synthetic alternatives. Addressing these challenges necessitates a focus on sustainable sourcing and innovative lanolin-based product development to meet evolving consumer demands.
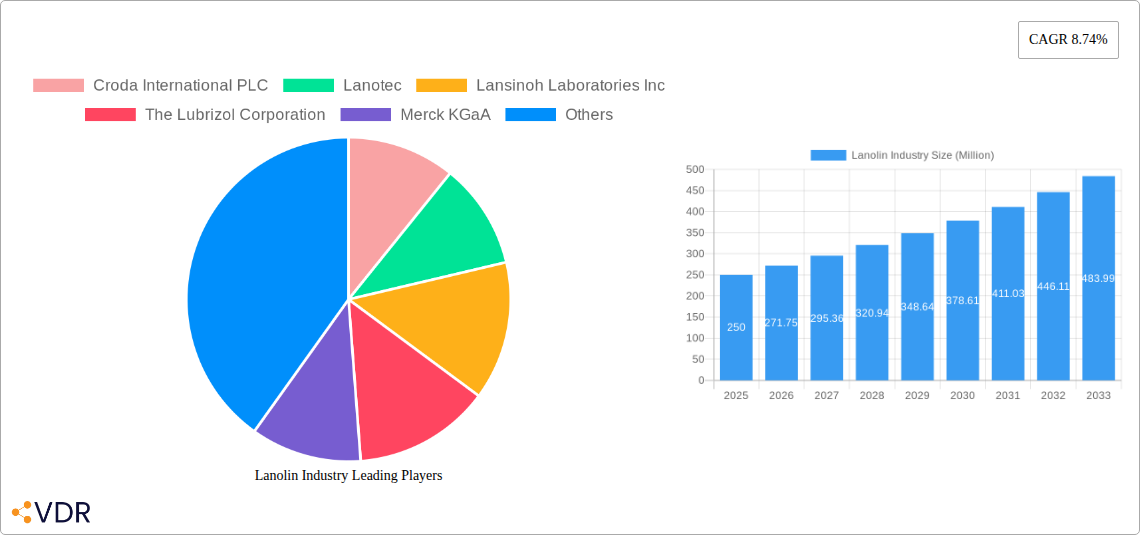
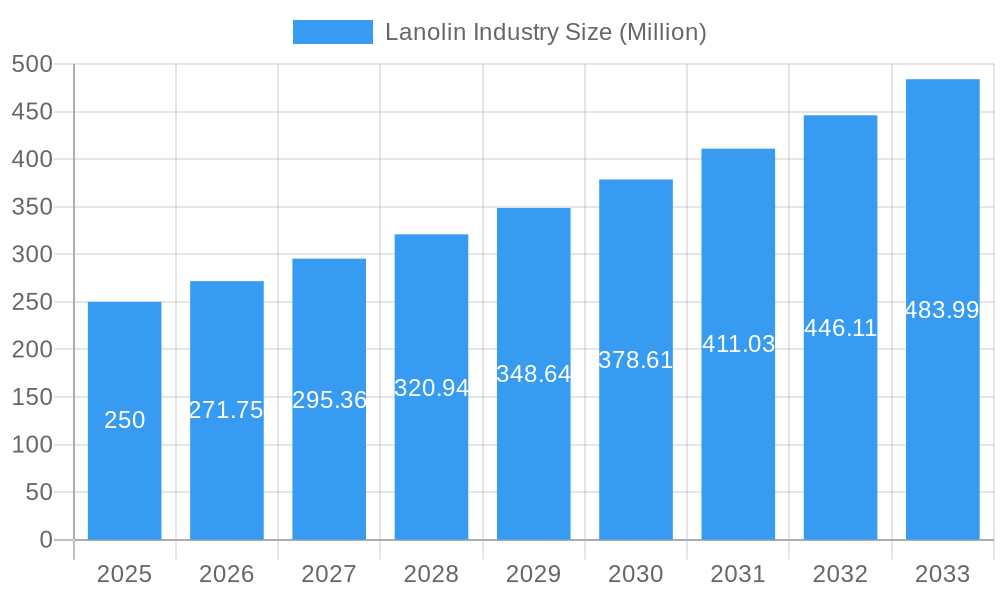
Lanolin Industry Market Size (In Million)
The competitive landscape features both multinational corporations and specialized firms. Major players, including Croda International PLC, The Lubrizol Corporation, and Merck KGaA, maintain market leadership through extensive R&D and global distribution. Niche companies are capitalizing on the demand for high-quality, sustainably sourced lanolin by targeting specific segments and offering tailored solutions. Future growth will be driven by innovation in lanolin derivatives and applications, strategic collaborations, and sustained supply chain sustainability, likely leading to market consolidation as larger entities acquire smaller ones to enhance product portfolios and market share.
Lanolin Industry Company Market Share
Lanolin Industry Market Report: 2019-2033
This comprehensive report provides an in-depth analysis of the global lanolin industry, encompassing market dynamics, growth trends, regional insights, product landscapes, and key players. With a study period spanning 2019-2033, a base year of 2025, and a forecast period of 2025-2033, this report is an invaluable resource for industry professionals, investors, and strategic decision-makers. The report leverages extensive primary and secondary research to deliver actionable intelligence for navigating the evolving lanolin market landscape. Parent market: Cosmetics and Personal Care; Child Market: Industrial Lubricants
Lanolin Industry Market Dynamics & Structure
The global lanolin market, valued at xx Million in 2024, exhibits a moderately concentrated structure with several key players holding significant market share. Technological innovation, particularly in sustainable and environmentally friendly lanolin extraction and processing methods, is a crucial driver. Stringent regulatory frameworks governing the use of lanolin in various applications influence market dynamics. Competitive product substitutes, such as synthetic emollients, pose a challenge. End-user demographics are diverse, ranging from cosmetic and personal care to pharmaceutical and industrial applications. M&A activity within the sector has been moderate, with xx deals recorded between 2019 and 2024.
- Market Concentration: Moderately concentrated, with top 5 players holding approximately xx% market share.
- Technological Innovation: Focus on sustainable extraction and processing methods.
- Regulatory Framework: Stringent regulations impacting applications in cosmetics and pharmaceuticals.
- Competitive Substitutes: Synthetic emollients and other alternatives.
- End-User Demographics: Diverse applications across cosmetics, pharmaceuticals, and industrial sectors.
- M&A Trends: Moderate activity with xx deals recorded (2019-2024). Average deal size: xx Million.
Lanolin Industry Growth Trends & Insights
The global lanolin market is poised for substantial expansion throughout the forecast period (2025-2033). This upward trajectory is primarily attributed to the escalating demand from the burgeoning cosmetics and personal care sectors, where consumers increasingly favor natural and organic ingredients. Lanolin's inherent emollient and exceptional moisturizing properties make it a highly sought-after ingredient. Market estimations project the market size to reach xx Million by 2033, up from xx Million in 2025, signifying a compound annual growth rate (CAGR) of approximately xx%. Furthermore, continuous advancements in lanolin extraction and purification technologies are significantly enhancing its quality, purity, and functional versatility, thereby broadening its adoption across a diverse array of applications. The growing consumer consciousness towards sustainability and ethically sourced products is a pivotal factor propelling market growth and innovation.
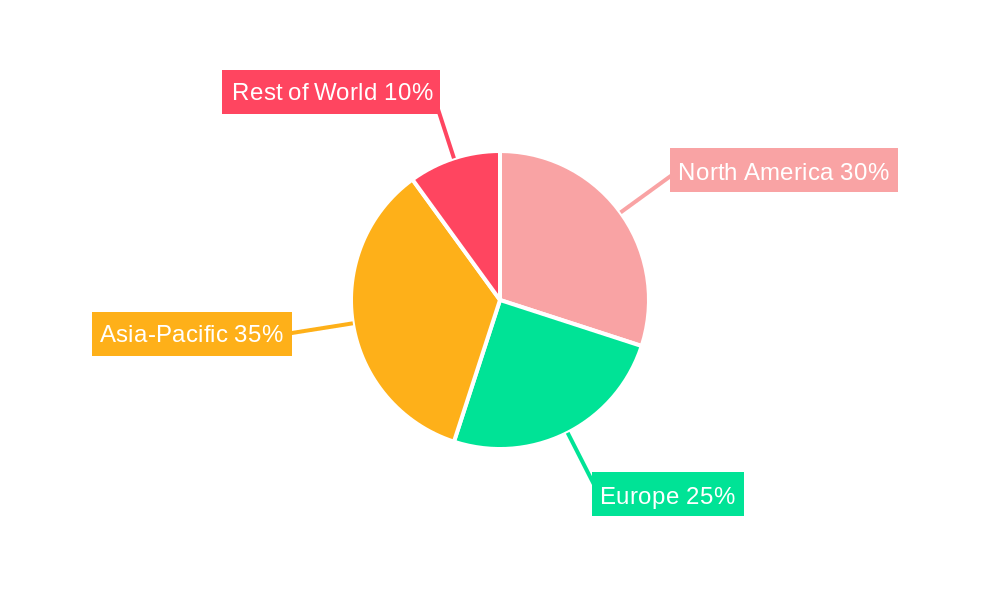
Dominant Regions, Countries, or Segments in Lanolin Industry
The North American region currently commands the largest share of the lanolin market. This dominance is underpinned by a robust and consistent demand from its well-established cosmetics and personal care industries, complemented by a mature and supportive regulatory landscape. However, the Asia-Pacific region is anticipated to experience the most rapid growth in the coming years. This accelerated expansion is fueled by swift economic development, a discernible rise in disposable incomes, and a growing acceptance and integration of lanolin-based products across various industries within the region.
- North America: Continues to lead in market share, driven by sustained demand in its prominent cosmetics and personal care sectors and a well-developed industrial infrastructure.
- Asia-Pacific: Emerging as the fastest-growing region due to dynamic economic expansion, increasing consumer spending power, and a burgeoning awareness and adoption of natural ingredients.
- Europe: Demonstrates steady and stable growth, benefiting from mature market segments and stringent adherence to industry regulations, fostering trust and product quality.
- Key Growth Catalysts: Robust economic growth, increasing per capita income, heightened consumer preference for natural and sustainable products, and supportive government policies promoting environmentally friendly practices.
Lanolin Industry Product Landscape
The lanolin product portfolio is extensive, catering to a wide spectrum of applications. Key areas include the cosmetics and personal care sector, where lanolin is a staple in formulations for creams, lotions, and ointments, prized for its skin-conditioning benefits. It also finds critical use in industrial lubricants and specialized pharmaceutical preparations. Current innovation efforts are strongly focused on refining lanolin to achieve superior levels of purity, amplified efficacy, and enhanced stability, while simultaneously minimizing its environmental footprint. The core unique selling propositions of lanolin remain its unparalleled moisturizing capabilities, excellent biocompatibility, and its function as a superior natural emollient. Advancements in processing technologies are continuously improving the sustainability of both lanolin extraction and refining methods.
Key Drivers, Barriers & Challenges in Lanolin Industry
Key Drivers:
- Increasing demand from cosmetics and personal care industries.
- Growing preference for natural and organic ingredients.
- Technological advancements in extraction and processing.
- Expanding applications in industrial and pharmaceutical sectors.
Key Challenges & Restraints:
- Fluctuations in raw material prices.
- Stringent regulatory requirements in certain regions.
- Competition from synthetic alternatives.
- Sustainability concerns related to traditional extraction methods. (Impact: xx% reduction in market growth potential).
Emerging Opportunities in Lanolin Industry
Emerging opportunities lie in the development of innovative lanolin-based products tailored to specific market segments (e.g., sustainable cosmetics, specialized industrial lubricants). Untapped markets in developing economies offer significant growth potential. Exploring new applications in sectors like pharmaceuticals and biomaterials can further enhance the market reach of lanolin. Leveraging e-commerce platforms to reach wider consumer bases is also a key opportunity.
Growth Accelerators in the Lanolin Industry
The long-term growth trajectory of the lanolin industry will be significantly propelled by several key factors. Technological innovations focused on sustainable lanolin extraction methods are paramount. Strategic collaborations and partnerships between lanolin producers and key end-user industries will foster market penetration and product development. Furthermore, proactive expansion into novel geographic markets and the exploration of new application areas will unlock substantial growth potential. Continuous innovation in product formulations to enhance efficacy and precisely meet diverse and evolving consumer needs will be indispensable for sustained market expansion. Crucially, sustained investment in research and development is vital to deepen our understanding and further leverage the unique and inherent properties of lanolin.
Key Players Shaping the Lanolin Industry Market
- Croda International PLC
- Lanotec
- Lansinoh Laboratories Inc
- The Lubrizol Corporation
- Merck KGaA
- Nippon Fine Chemical
- NK Chemicals
- Rolex Lanolin Products Limited
- Suru Chemicals
- Wellman Advanced Materials
- Yixin Chemical Co Ltd
- Zhejiang Garden Biochemical High-Tech Co Ltd
Notable Milestones in Lanolin Industry Sector
- April 2023: Lanotec launched a new product line of environmentally friendly lanolin-based lubricants: MPX (multi-purpose), MGX (marine), and EGX (electrical). This signifies a significant shift towards sustainable applications of lanolin, expanding its market potential.
In-Depth Lanolin Industry Market Outlook
The lanolin industry is poised for substantial growth over the next decade, driven by a confluence of factors including increasing consumer demand for natural ingredients, technological advancements, and the expansion of applications into new markets. Strategic partnerships and investments in research and development will be pivotal in unlocking the full potential of lanolin and fostering its sustainable growth. The focus on sustainable sourcing and processing will further drive market expansion and secure lanolin's position as a valuable natural resource.
Lanolin Industry Segmentation
-
1. Application
- 1.1. Cosmetics and Personal Care
- 1.2. Pharmaceuticals
- 1.3. Anti-corrosive Applications
- 1.4. Lubricants
- 1.5. Other Applications (Paints, Paper)
Lanolin Industry Segmentation By Geography
-
1. Asia Pacific
- 1.1. China
- 1.2. India
- 1.3. Japan
- 1.4. South Korea
- 1.5. Rest of Asia Pacific
-
2. North America
- 2.1. United States
- 2.2. Canada
- 2.3. Mexico
-
3. Europe
- 3.1. Germany
- 3.2. United Kingdom
- 3.3. France
- 3.4. Italy
- 3.5. Rest of Europe
-
4. South America
- 4.1. Brazil
- 4.2. Argentina
- 4.3. Rest of South America
-
5. Middle East and Africa
- 5.1. Saudi Arabia
- 5.2. South Africa
- 5.3. Rest of Middle East and Africa
Lanolin Industry Regional Market Share
Geographic Coverage of Lanolin Industry
Lanolin Industry REPORT HIGHLIGHTS
| Aspects | Details |
|---|---|
| Study Period | 2020-2034 |
| Base Year | 2025 |
| Estimated Year | 2026 |
| Forecast Period | 2026-2034 |
| Historical Period | 2020-2025 |
| Growth Rate | CAGR of 3.22% from 2020-2034 |
| Segmentation |
|
Table of Contents
- 1. Introduction
- 1.1. Research Scope
- 1.2. Market Segmentation
- 1.3. Research Objective
- 1.4. Definitions and Assumptions
- 2. Executive Summary
- 2.1. Market Snapshot
- 3. Market Dynamics
- 3.1. Market Drivers
- 3.2. Market Restrains
- 3.3. Market Trends
- 3.4. Market Opportunities
- 4. Market Factor Analysis
- 4.1. Porters Five Forces
- 4.1.1. Bargaining Power of Suppliers
- 4.1.2. Bargaining Power of Buyers
- 4.1.3. Threat of New Entrants
- 4.1.4. Threat of Substitutes
- 4.1.5. Competitive Rivalry
- 4.2. PESTEL analysis
- 4.3. BCG Analysis
- 4.3.1. Stars (High Growth, High Market Share)
- 4.3.2. Cash Cows (Low Growth, High Market Share)
- 4.3.3. Question Mark (High Growth, Low Market Share)
- 4.3.4. Dogs (Low Growth, Low Market Share)
- 4.4. Ansoff Matrix Analysis
- 4.5. Supply Chain Analysis
- 4.6. Regulatory Landscape
- 4.7. Current Market Potential and Opportunity Assessment (TAM–SAM–SOM Framework)
- 4.8. VDR Analyst Note
- 4.1. Porters Five Forces
- 5. Market Analysis, Insights and Forecast 2021-2033
- 5.1. Market Analysis, Insights and Forecast - by Application
- 5.1.1. Cosmetics and Personal Care
- 5.1.2. Pharmaceuticals
- 5.1.3. Anti-corrosive Applications
- 5.1.4. Lubricants
- 5.1.5. Other Applications (Paints, Paper)
- 5.2. Market Analysis, Insights and Forecast - by Region
- 5.2.1. Asia Pacific
- 5.2.2. North America
- 5.2.3. Europe
- 5.2.4. South America
- 5.2.5. Middle East and Africa
- 5.1. Market Analysis, Insights and Forecast - by Application
- 6. Global Lanolin Industry Analysis, Insights and Forecast, 2021-2033
- 6.1. Market Analysis, Insights and Forecast - by Application
- 6.1.1. Cosmetics and Personal Care
- 6.1.2. Pharmaceuticals
- 6.1.3. Anti-corrosive Applications
- 6.1.4. Lubricants
- 6.1.5. Other Applications (Paints, Paper)
- 6.1. Market Analysis, Insights and Forecast - by Application
- 7. Asia Pacific Lanolin Industry Analysis, Insights and Forecast, 2021-2033
- 7.1. Market Analysis, Insights and Forecast - by Application
- 7.1.1. Cosmetics and Personal Care
- 7.1.2. Pharmaceuticals
- 7.1.3. Anti-corrosive Applications
- 7.1.4. Lubricants
- 7.1.5. Other Applications (Paints, Paper)
- 7.1. Market Analysis, Insights and Forecast - by Application
- 8. North America Lanolin Industry Analysis, Insights and Forecast, 2021-2033
- 8.1. Market Analysis, Insights and Forecast - by Application
- 8.1.1. Cosmetics and Personal Care
- 8.1.2. Pharmaceuticals
- 8.1.3. Anti-corrosive Applications
- 8.1.4. Lubricants
- 8.1.5. Other Applications (Paints, Paper)
- 8.1. Market Analysis, Insights and Forecast - by Application
- 9. Europe Lanolin Industry Analysis, Insights and Forecast, 2021-2033
- 9.1. Market Analysis, Insights and Forecast - by Application
- 9.1.1. Cosmetics and Personal Care
- 9.1.2. Pharmaceuticals
- 9.1.3. Anti-corrosive Applications
- 9.1.4. Lubricants
- 9.1.5. Other Applications (Paints, Paper)
- 9.1. Market Analysis, Insights and Forecast - by Application
- 10. South America Lanolin Industry Analysis, Insights and Forecast, 2021-2033
- 10.1. Market Analysis, Insights and Forecast - by Application
- 10.1.1. Cosmetics and Personal Care
- 10.1.2. Pharmaceuticals
- 10.1.3. Anti-corrosive Applications
- 10.1.4. Lubricants
- 10.1.5. Other Applications (Paints, Paper)
- 10.1. Market Analysis, Insights and Forecast - by Application
- 11. Middle East and Africa Lanolin Industry Analysis, Insights and Forecast, 2021-2033
- 11.1. Market Analysis, Insights and Forecast - by Application
- 11.1.1. Cosmetics and Personal Care
- 11.1.2. Pharmaceuticals
- 11.1.3. Anti-corrosive Applications
- 11.1.4. Lubricants
- 11.1.5. Other Applications (Paints, Paper)
- 11.1. Market Analysis, Insights and Forecast - by Application
- 12. Competitive Analysis
- 12.1. Company Profiles
- 12.1.1 Croda International PLC
- 12.1.1.1. Company Overview
- 12.1.1.2. Products
- 12.1.1.3. Company Financials
- 12.1.1.4. SWOT Analysis
- 12.1.2 Lanotec
- 12.1.2.1. Company Overview
- 12.1.2.2. Products
- 12.1.2.3. Company Financials
- 12.1.2.4. SWOT Analysis
- 12.1.3 Lansinoh Laboratories Inc
- 12.1.3.1. Company Overview
- 12.1.3.2. Products
- 12.1.3.3. Company Financials
- 12.1.3.4. SWOT Analysis
- 12.1.4 The Lubrizol Corporation
- 12.1.4.1. Company Overview
- 12.1.4.2. Products
- 12.1.4.3. Company Financials
- 12.1.4.4. SWOT Analysis
- 12.1.5 Merck KGaA
- 12.1.5.1. Company Overview
- 12.1.5.2. Products
- 12.1.5.3. Company Financials
- 12.1.5.4. SWOT Analysis
- 12.1.6 Nippon Fine Chemical
- 12.1.6.1. Company Overview
- 12.1.6.2. Products
- 12.1.6.3. Company Financials
- 12.1.6.4. SWOT Analysis
- 12.1.7 NK Chemicals
- 12.1.7.1. Company Overview
- 12.1.7.2. Products
- 12.1.7.3. Company Financials
- 12.1.7.4. SWOT Analysis
- 12.1.8 Rolex Lanolin Products Limited
- 12.1.8.1. Company Overview
- 12.1.8.2. Products
- 12.1.8.3. Company Financials
- 12.1.8.4. SWOT Analysis
- 12.1.9 Suru Chemicals
- 12.1.9.1. Company Overview
- 12.1.9.2. Products
- 12.1.9.3. Company Financials
- 12.1.9.4. SWOT Analysis
- 12.1.10 Wellman Advanced Materials
- 12.1.10.1. Company Overview
- 12.1.10.2. Products
- 12.1.10.3. Company Financials
- 12.1.10.4. SWOT Analysis
- 12.1.11 Yixin Chemical Co Ltd
- 12.1.11.1. Company Overview
- 12.1.11.2. Products
- 12.1.11.3. Company Financials
- 12.1.11.4. SWOT Analysis
- 12.1.12 Zhejiang Garden Biochemical High-Tech Co Ltd*List Not Exhaustive
- 12.1.12.1. Company Overview
- 12.1.12.2. Products
- 12.1.12.3. Company Financials
- 12.1.12.4. SWOT Analysis
- 12.1.1 Croda International PLC
- 12.2. Market Entropy
- 12.2.1 Company's Key Areas Served
- 12.2.2 Recent Developments
- 12.3. Company Market Share Analysis 2025
- 12.3.1 Top 5 Companies Market Share Analysis
- 12.3.2 Top 3 Companies Market Share Analysis
- 12.4. List of Potential Customers
- 13. Research Methodology
List of Figures
- Figure 1: Global Lanolin Industry Revenue Breakdown (million, %) by Region 2025 & 2033
- Figure 2: Asia Pacific Lanolin Industry Revenue (million), by Application 2025 & 2033
- Figure 3: Asia Pacific Lanolin Industry Revenue Share (%), by Application 2025 & 2033
- Figure 4: Asia Pacific Lanolin Industry Revenue (million), by Country 2025 & 2033
- Figure 5: Asia Pacific Lanolin Industry Revenue Share (%), by Country 2025 & 2033
- Figure 6: North America Lanolin Industry Revenue (million), by Application 2025 & 2033
- Figure 7: North America Lanolin Industry Revenue Share (%), by Application 2025 & 2033
- Figure 8: North America Lanolin Industry Revenue (million), by Country 2025 & 2033
- Figure 9: North America Lanolin Industry Revenue Share (%), by Country 2025 & 2033
- Figure 10: Europe Lanolin Industry Revenue (million), by Application 2025 & 2033
- Figure 11: Europe Lanolin Industry Revenue Share (%), by Application 2025 & 2033
- Figure 12: Europe Lanolin Industry Revenue (million), by Country 2025 & 2033
- Figure 13: Europe Lanolin Industry Revenue Share (%), by Country 2025 & 2033
- Figure 14: South America Lanolin Industry Revenue (million), by Application 2025 & 2033
- Figure 15: South America Lanolin Industry Revenue Share (%), by Application 2025 & 2033
- Figure 16: South America Lanolin Industry Revenue (million), by Country 2025 & 2033
- Figure 17: South America Lanolin Industry Revenue Share (%), by Country 2025 & 2033
- Figure 18: Middle East and Africa Lanolin Industry Revenue (million), by Application 2025 & 2033
- Figure 19: Middle East and Africa Lanolin Industry Revenue Share (%), by Application 2025 & 2033
- Figure 20: Middle East and Africa Lanolin Industry Revenue (million), by Country 2025 & 2033
- Figure 21: Middle East and Africa Lanolin Industry Revenue Share (%), by Country 2025 & 2033
List of Tables
- Table 1: Global Lanolin Industry Revenue million Forecast, by Application 2020 & 2033
- Table 2: Global Lanolin Industry Revenue million Forecast, by Region 2020 & 2033
- Table 3: Global Lanolin Industry Revenue million Forecast, by Application 2020 & 2033
- Table 4: Global Lanolin Industry Revenue million Forecast, by Country 2020 & 2033
- Table 5: China Lanolin Industry Revenue (million) Forecast, by Application 2020 & 2033
- Table 6: India Lanolin Industry Revenue (million) Forecast, by Application 2020 & 2033
- Table 7: Japan Lanolin Industry Revenue (million) Forecast, by Application 2020 & 2033
- Table 8: South Korea Lanolin Industry Revenue (million) Forecast, by Application 2020 & 2033
- Table 9: Rest of Asia Pacific Lanolin Industry Revenue (million) Forecast, by Application 2020 & 2033
- Table 10: Global Lanolin Industry Revenue million Forecast, by Application 2020 & 2033
- Table 11: Global Lanolin Industry Revenue million Forecast, by Country 2020 & 2033
- Table 12: United States Lanolin Industry Revenue (million) Forecast, by Application 2020 & 2033
- Table 13: Canada Lanolin Industry Revenue (million) Forecast, by Application 2020 & 2033
- Table 14: Mexico Lanolin Industry Revenue (million) Forecast, by Application 2020 & 2033
- Table 15: Global Lanolin Industry Revenue million Forecast, by Application 2020 & 2033
- Table 16: Global Lanolin Industry Revenue million Forecast, by Country 2020 & 2033
- Table 17: Germany Lanolin Industry Revenue (million) Forecast, by Application 2020 & 2033
- Table 18: United Kingdom Lanolin Industry Revenue (million) Forecast, by Application 2020 & 2033
- Table 19: France Lanolin Industry Revenue (million) Forecast, by Application 2020 & 2033
- Table 20: Italy Lanolin Industry Revenue (million) Forecast, by Application 2020 & 2033
- Table 21: Rest of Europe Lanolin Industry Revenue (million) Forecast, by Application 2020 & 2033
- Table 22: Global Lanolin Industry Revenue million Forecast, by Application 2020 & 2033
- Table 23: Global Lanolin Industry Revenue million Forecast, by Country 2020 & 2033
- Table 24: Brazil Lanolin Industry Revenue (million) Forecast, by Application 2020 & 2033
- Table 25: Argentina Lanolin Industry Revenue (million) Forecast, by Application 2020 & 2033
- Table 26: Rest of South America Lanolin Industry Revenue (million) Forecast, by Application 2020 & 2033
- Table 27: Global Lanolin Industry Revenue million Forecast, by Application 2020 & 2033
- Table 28: Global Lanolin Industry Revenue million Forecast, by Country 2020 & 2033
- Table 29: Saudi Arabia Lanolin Industry Revenue (million) Forecast, by Application 2020 & 2033
- Table 30: South Africa Lanolin Industry Revenue (million) Forecast, by Application 2020 & 2033
- Table 31: Rest of Middle East and Africa Lanolin Industry Revenue (million) Forecast, by Application 2020 & 2033
Frequently Asked Questions
1. What is the projected Compound Annual Growth Rate (CAGR) of the Lanolin Industry?
The projected CAGR is approximately 3.22%.
2. Which companies are prominent players in the Lanolin Industry?
Key companies in the market include Croda International PLC, Lanotec, Lansinoh Laboratories Inc, The Lubrizol Corporation, Merck KGaA, Nippon Fine Chemical, NK Chemicals, Rolex Lanolin Products Limited, Suru Chemicals, Wellman Advanced Materials, Yixin Chemical Co Ltd, Zhejiang Garden Biochemical High-Tech Co Ltd*List Not Exhaustive.
3. What are the main segments of the Lanolin Industry?
The market segments include Application.
4. Can you provide details about the market size?
The market size is estimated to be USD 445.439 million as of 2022.
5. What are some drivers contributing to market growth?
Increasing Applications in Skin Care Products; Growing Demand for Pharmaceuticals; Other Drivers.
6. What are the notable trends driving market growth?
Growing Demand from the Cosmetics and Personal Care Industry.
7. Are there any restraints impacting market growth?
Increasing Applications in Skin Care Products; Growing Demand for Pharmaceuticals; Other Drivers.
8. Can you provide examples of recent developments in the market?
April 2023: Lanotec launched a new product line of lanolin-based lubricants, including MPX for everyday multi-purpose use, MGX for marine applications, and EGX for electrical use. All these are environmentally friendly for a variety of commercial and residential applications.
9. What pricing options are available for accessing the report?
Pricing options include single-user, multi-user, and enterprise licenses priced at USD 4750, USD 5250, and USD 8750 respectively.
10. Is the market size provided in terms of value or volume?
The market size is provided in terms of value, measured in million.
11. Are there any specific market keywords associated with the report?
Yes, the market keyword associated with the report is "Lanolin Industry," which aids in identifying and referencing the specific market segment covered.
12. How do I determine which pricing option suits my needs best?
The pricing options vary based on user requirements and access needs. Individual users may opt for single-user licenses, while businesses requiring broader access may choose multi-user or enterprise licenses for cost-effective access to the report.
13. Are there any additional resources or data provided in the Lanolin Industry report?
While the report offers comprehensive insights, it's advisable to review the specific contents or supplementary materials provided to ascertain if additional resources or data are available.
14. How can I stay updated on further developments or reports in the Lanolin Industry?
To stay informed about further developments, trends, and reports in the Lanolin Industry, consider subscribing to industry newsletters, following relevant companies and organizations, or regularly checking reputable industry news sources and publications.
Methodology
Step 1 - Identification of Relevant Samples Size from Population Database


Step 2 - Approaches for Defining Global Market Size (Value, Volume* & Price*)

Note*: In applicable scenarios
Step 3 - Data Sources
Primary Research
- Web Analytics
- Survey Reports
- Research Institute
- Latest Research Reports
- Opinion Leaders
Secondary Research
- Annual Reports
- White Paper
- Latest Press Release
- Industry Association
- Paid Database
- Investor Presentations

Step 4 - Data Triangulation
Involves using different sources of information in order to increase the validity of a study
These sources are likely to be stakeholders in a program - participants, other researchers, program staff, other community members, and so on.
Then we put all data in single framework & apply various statistical tools to find out the dynamic on the market.
During the analysis stage, feedback from the stakeholder groups would be compared to determine areas of agreement as well as areas of divergence