
Key Insights
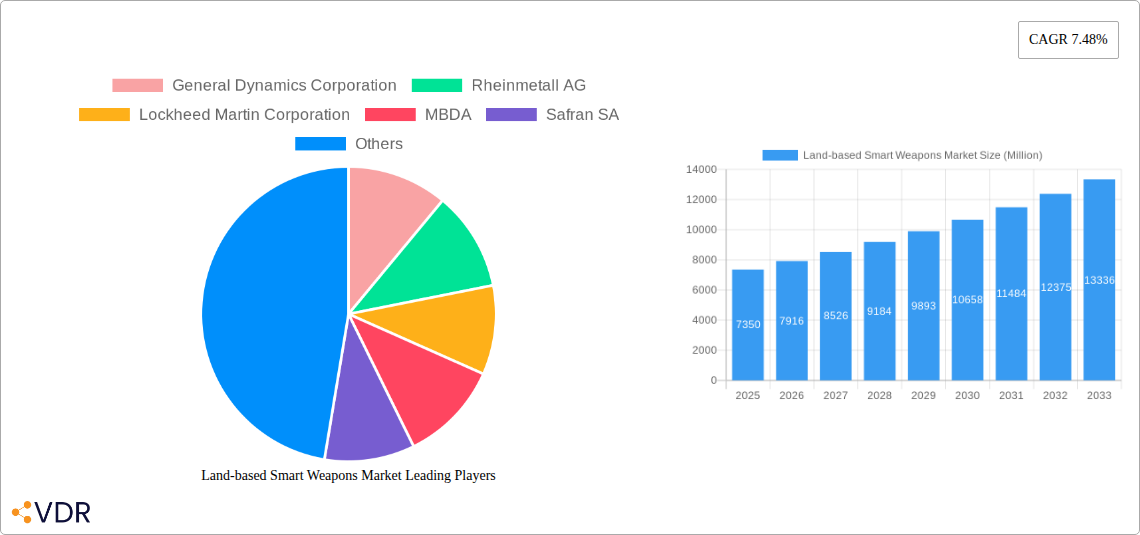
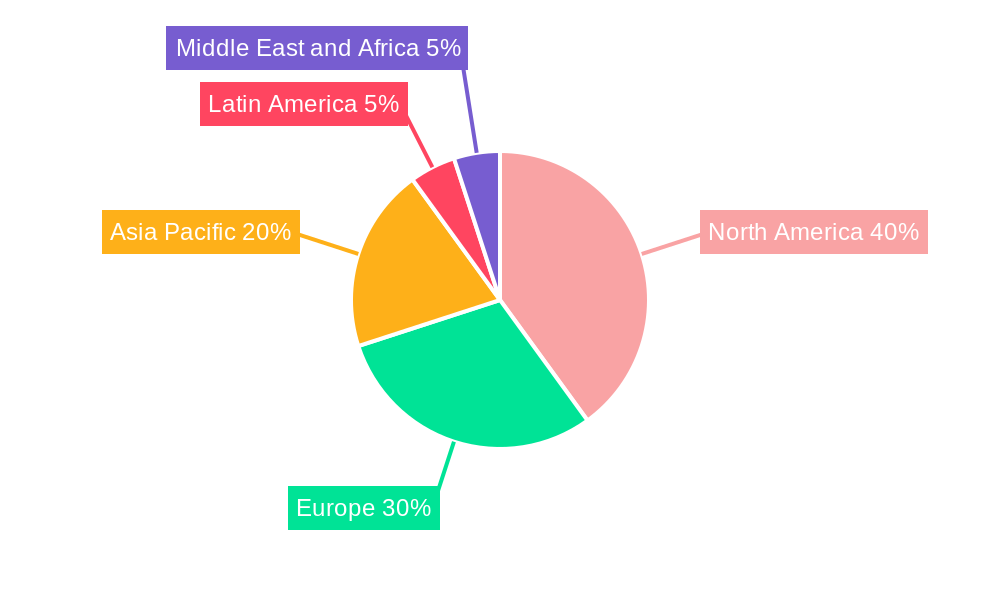
The Land-based Smart Weapons market, valued at $7.35 billion in 2025, is projected to experience robust growth, driven by escalating geopolitical tensions and the increasing demand for precision-guided munitions. A Compound Annual Growth Rate (CAGR) of 7.48% is anticipated from 2025 to 2033, indicating a significant expansion of the market. Key drivers include the modernization of military arsenals worldwide, advancements in guidance technologies such as satellite, radar, infrared, and laser guidance systems, and the growing need for minimizing collateral damage in military operations. The market segmentation reveals a diverse landscape, with missiles and ammunition forming the largest product segment, while satellite and radar guidance technologies dominate the technology segment. Growth is further fueled by continuous R&D efforts focused on enhancing accuracy, range, and lethality of smart weapons, coupled with increasing defense budgets in major global powers. Regional variations in market share are expected, with North America and Europe maintaining significant dominance due to strong defense industries and higher defense spending. However, the Asia-Pacific region is poised for substantial growth, fueled by increasing military modernization programs in countries like China and India.
The restraining factors impacting market growth are primarily associated with the high cost of developing and deploying advanced smart weapons, stringent export control regulations, and ethical considerations surrounding the use of autonomous weapons systems. Despite these constraints, the long-term outlook for the Land-based Smart Weapons market remains positive. Technological advancements leading to smaller, lighter, and more cost-effective smart weapons are expected to offset some of the current challenges, ensuring sustained market expansion in the coming years. Competition within the market is intense, with leading players such as General Dynamics, Lockheed Martin, Rheinmetall, MBDA, and Safran constantly striving for technological superiority and market share. The continuous evolution of threat landscapes and the ongoing demand for enhanced military capabilities will continue to shape the future trajectory of this dynamic market.
Land-based Smart Weapons Market: A Comprehensive Market Report (2019-2033)
This in-depth report provides a comprehensive analysis of the Land-based Smart Weapons Market, encompassing its market dynamics, growth trends, regional segmentation, product landscape, key players, and future outlook. The report covers the period from 2019 to 2033, with a focus on the forecast period of 2025-2033 and a base year of 2025. The parent market is the broader Defense and Aerospace industry, while the child market is specifically Land-based Weapon Systems. This report is essential for industry professionals, investors, and strategic decision-makers seeking a detailed understanding of this critical sector. The market size is estimated at xx Million Units in 2025 and is projected to reach xx Million Units by 2033.
Land-based Smart Weapons Market Market Dynamics & Structure
The Land-based Smart Weapons market is characterized by high market concentration among a few major players, intense competition, and significant technological innovation. Regulatory frameworks, including export controls and international treaties, significantly influence market dynamics. The market witnesses constant innovation in guidance systems and warhead technologies, leading to the development of more precise and effective weapons. Competitive product substitutes, such as conventional munitions, pose a challenge, though smart weapons are increasingly favored for their enhanced accuracy and reduced collateral damage. End-user demographics are largely concentrated in militaries and government agencies globally, with demand influenced by geopolitical tensions and regional conflicts. M&A activity is relatively frequent, driven by the need for technological advancements and expansion into new markets.
- Market Concentration: High, with the top 5 players holding approximately xx% market share in 2025.
- Technological Innovation: Rapid advancements in guidance systems (satellite, radar, infrared, laser) and warhead technologies are key drivers.
- Regulatory Framework: Stringent export controls and international arms treaties create both opportunities and challenges.
- Competitive Substitutes: Conventional munitions remain a cost-effective alternative, yet smart weapons are gradually gaining preference.
- M&A Activity: Consistent M&A activity, with xx deals recorded in the past 5 years, signifying industry consolidation. Average deal value: xx Million Units.
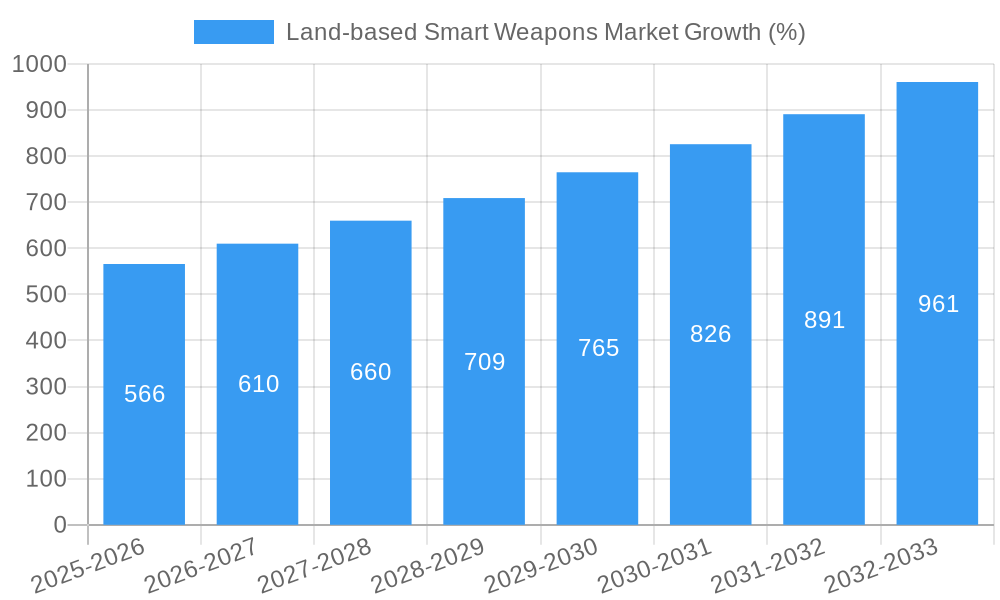
Land-based Smart Weapons Market Growth Trends & Insights
The Land-based Smart Weapons market exhibits a robust growth trajectory, driven by increasing defense budgets globally, technological advancements, and the rising demand for precision-guided munitions. The market experienced a CAGR of xx% during the historical period (2019-2024) and is projected to maintain a CAGR of xx% during the forecast period (2025-2033). This growth is fueled by factors such as the increasing adoption of smart weapons by militaries worldwide, technological disruptions leading to more accurate and effective weapons, and shifting consumer behavior towards more advanced and precise weaponry. Furthermore, the growing need for minimizing civilian casualties is also driving the market growth. Market penetration is expected to increase significantly in developing nations, especially in regions with ongoing conflicts.
Dominant Regions, Countries, or Segments in Land-based Smart Weapons Market
The North American region currently holds the largest market share, driven by high defense spending and technological advancements. However, the Asia-Pacific region is expected to witness the fastest growth rate during the forecast period, driven by increasing geopolitical tensions and modernization of military forces in the region. Within product segments, Missiles command the highest market share, followed by Ammunitions. In terms of technology, Infrared Guidance and Laser Guidance dominate the market due to their accuracy and effectiveness.
- Key Drivers in North America: High defense budgets, strong technological capabilities, and robust domestic production capacity.
- Key Drivers in Asia-Pacific: Increasing defense spending, modernization of armed forces, and regional geopolitical instability.
- Product Segment Dominance: Missiles (xx% market share), followed by Ammunitions (xx%) and Other Products (xx%).
- Technology Segment Dominance: Infrared Guidance (xx%) and Laser Guidance (xx%), driven by high accuracy and effectiveness.
Land-based Smart Weapons Market Product Landscape
The Land-based Smart Weapons market offers a diverse range of products, including precision-guided missiles, smart bombs, and advanced artillery shells. Recent innovations focus on improved guidance systems, increased lethality, and enhanced penetration capabilities. Key performance metrics include range, accuracy, payload capacity, and target discrimination. Unique selling propositions often highlight the reduced collateral damage associated with these weapons and their improved targeting efficiency. Technological advancements continue to push the boundaries of precision and effectiveness.
Key Drivers, Barriers & Challenges in Land-based Smart Weapons Market
Key Drivers: Increased demand for precision-guided munitions, rising defense budgets globally, technological advancements leading to increased accuracy and effectiveness, and the growing need to minimize civilian casualties. For example, the ongoing conflicts in various regions are a significant driver of demand.
Key Challenges: High production costs, stringent regulatory frameworks and export controls, potential supply chain disruptions, and intense competition among leading manufacturers impacting profit margins. The complexity of integrating smart weapons into existing military systems also poses a challenge. For example, delays in the procurement process can significantly impact market growth.
Emerging Opportunities in Land-based Smart Weapons Market
Emerging opportunities include the development of autonomous smart weapons, increased adoption in asymmetric warfare scenarios, integration with advanced sensor networks for enhanced situational awareness, and expansion into new geographical markets. The development of miniaturized and cost-effective smart weapons for smaller militaries also presents significant potential.
Growth Accelerators in the Land-based Smart Weapons Market Industry
Technological breakthroughs in AI and machine learning for autonomous targeting systems, strategic partnerships between defense contractors and technology companies, and expansion into emerging markets with rapidly modernizing militaries will be key growth catalysts. Moreover, the increasing focus on cyber security for these systems will create new opportunities.
Key Players Shaping the Land-based Smart Weapons Market Market
- General Dynamics Corporation
- Rheinmetall AG
- Lockheed Martin Corporation
- MBDA
- Safran SA
- Rafael Advanced Defense Systems Ltd
- RTX Corporation
- BAE Systems PLC
- Northrop Grumman Corporation
- IA
Notable Milestones in Land-based Smart Weapons Market Sector
- 2020-Q4: Lockheed Martin unveils advanced precision-guided munition.
- 2022-Q2: Rheinmetall AG and a partner company announce a joint venture for smart munition production.
- 2023-Q1: New export regulations impact global supply chains.
In-Depth Land-based Smart Weapons Market Market Outlook
The Land-based Smart Weapons market is poised for significant growth over the next decade, driven by technological advancements, increasing defense budgets, and ongoing geopolitical instability. Strategic opportunities lie in developing advanced guidance systems, exploring AI-powered autonomous capabilities, and securing partnerships to expand into lucrative emerging markets. The market’s future will be defined by continued innovation and the evolving needs of modern warfare.
Land-based Smart Weapons Market Segmentation
-
1. Product
- 1.1. Missiles
- 1.2. Ammunitions and Other Products
-
2. Technology
- 2.1. Satellite Guidance
- 2.2. Radar Guidance
- 2.3. Infrared Guidance
- 2.4. Laser Guidance
- 2.5. Other Technologies
Land-based Smart Weapons Market Segmentation By Geography
-
1. North America
- 1.1. United States
- 1.2. Canada
-
2. Europe
- 2.1. United Kingdom
- 2.2. France
- 2.3. Germany
- 2.4. Russia
- 2.5. Rest of Europe
-
3. Asia Pacific
- 3.1. China
- 3.2. India
- 3.3. Japan
- 3.4. Rest of Asia Pacific
-
4. Latin America
- 4.1. Brazil
- 4.2. Rest of Latin America
-
5. Middle East and Africa
- 5.1. Saudi Arabia
- 5.2. United Arab Emirates
- 5.3. Israel
- 5.4. Rest of Middle East and Africa
Land-based Smart Weapons Market REPORT HIGHLIGHTS
| Aspects | Details |
|---|---|
| Study Period | 2019-2033 |
| Base Year | 2024 |
| Estimated Year | 2025 |
| Forecast Period | 2025-2033 |
| Historical Period | 2019-2024 |
| Growth Rate | CAGR of 7.48% from 2019-2033 |
| Segmentation |
|
Table of Contents
- 1. Introduction
- 1.1. Research Scope
- 1.2. Market Segmentation
- 1.3. Research Methodology
- 1.4. Definitions and Assumptions
- 2. Executive Summary
- 2.1. Introduction
- 3. Market Dynamics
- 3.1. Introduction
- 3.2. Market Drivers
- 3.3. Market Restrains
- 3.4. Market Trends
- 3.4.1. Ammunitions and Other Products Segment is Expected to Witness Highest Growth
- 4. Market Factor Analysis
- 4.1. Porters Five Forces
- 4.2. Supply/Value Chain
- 4.3. PESTEL analysis
- 4.4. Market Entropy
- 4.5. Patent/Trademark Analysis
- 5. Global Land-based Smart Weapons Market Analysis, Insights and Forecast, 2019-2031
- 5.1. Market Analysis, Insights and Forecast - by Product
- 5.1.1. Missiles
- 5.1.2. Ammunitions and Other Products
- 5.2. Market Analysis, Insights and Forecast - by Technology
- 5.2.1. Satellite Guidance
- 5.2.2. Radar Guidance
- 5.2.3. Infrared Guidance
- 5.2.4. Laser Guidance
- 5.2.5. Other Technologies
- 5.3. Market Analysis, Insights and Forecast - by Region
- 5.3.1. North America
- 5.3.2. Europe
- 5.3.3. Asia Pacific
- 5.3.4. Latin America
- 5.3.5. Middle East and Africa
- 5.1. Market Analysis, Insights and Forecast - by Product
- 6. North America Land-based Smart Weapons Market Analysis, Insights and Forecast, 2019-2031
- 6.1. Market Analysis, Insights and Forecast - by Product
- 6.1.1. Missiles
- 6.1.2. Ammunitions and Other Products
- 6.2. Market Analysis, Insights and Forecast - by Technology
- 6.2.1. Satellite Guidance
- 6.2.2. Radar Guidance
- 6.2.3. Infrared Guidance
- 6.2.4. Laser Guidance
- 6.2.5. Other Technologies
- 6.1. Market Analysis, Insights and Forecast - by Product
- 7. Europe Land-based Smart Weapons Market Analysis, Insights and Forecast, 2019-2031
- 7.1. Market Analysis, Insights and Forecast - by Product
- 7.1.1. Missiles
- 7.1.2. Ammunitions and Other Products
- 7.2. Market Analysis, Insights and Forecast - by Technology
- 7.2.1. Satellite Guidance
- 7.2.2. Radar Guidance
- 7.2.3. Infrared Guidance
- 7.2.4. Laser Guidance
- 7.2.5. Other Technologies
- 7.1. Market Analysis, Insights and Forecast - by Product
- 8. Asia Pacific Land-based Smart Weapons Market Analysis, Insights and Forecast, 2019-2031
- 8.1. Market Analysis, Insights and Forecast - by Product
- 8.1.1. Missiles
- 8.1.2. Ammunitions and Other Products
- 8.2. Market Analysis, Insights and Forecast - by Technology
- 8.2.1. Satellite Guidance
- 8.2.2. Radar Guidance
- 8.2.3. Infrared Guidance
- 8.2.4. Laser Guidance
- 8.2.5. Other Technologies
- 8.1. Market Analysis, Insights and Forecast - by Product
- 9. Latin America Land-based Smart Weapons Market Analysis, Insights and Forecast, 2019-2031
- 9.1. Market Analysis, Insights and Forecast - by Product
- 9.1.1. Missiles
- 9.1.2. Ammunitions and Other Products
- 9.2. Market Analysis, Insights and Forecast - by Technology
- 9.2.1. Satellite Guidance
- 9.2.2. Radar Guidance
- 9.2.3. Infrared Guidance
- 9.2.4. Laser Guidance
- 9.2.5. Other Technologies
- 9.1. Market Analysis, Insights and Forecast - by Product
- 10. Middle East and Africa Land-based Smart Weapons Market Analysis, Insights and Forecast, 2019-2031
- 10.1. Market Analysis, Insights and Forecast - by Product
- 10.1.1. Missiles
- 10.1.2. Ammunitions and Other Products
- 10.2. Market Analysis, Insights and Forecast - by Technology
- 10.2.1. Satellite Guidance
- 10.2.2. Radar Guidance
- 10.2.3. Infrared Guidance
- 10.2.4. Laser Guidance
- 10.2.5. Other Technologies
- 10.1. Market Analysis, Insights and Forecast - by Product
- 11. North America Land-based Smart Weapons Market Analysis, Insights and Forecast, 2019-2031
- 11.1. Market Analysis, Insights and Forecast - By Country/Sub-region
- 11.1.1 United States
- 11.1.2 Canada
- 12. Europe Land-based Smart Weapons Market Analysis, Insights and Forecast, 2019-2031
- 12.1. Market Analysis, Insights and Forecast - By Country/Sub-region
- 12.1.1 United Kingdom
- 12.1.2 France
- 12.1.3 Germany
- 12.1.4 Russia
- 12.1.5 Rest of Europe
- 13. Asia Pacific Land-based Smart Weapons Market Analysis, Insights and Forecast, 2019-2031
- 13.1. Market Analysis, Insights and Forecast - By Country/Sub-region
- 13.1.1 China
- 13.1.2 India
- 13.1.3 Japan
- 13.1.4 Rest of Asia Pacific
- 14. Latin America Land-based Smart Weapons Market Analysis, Insights and Forecast, 2019-2031
- 14.1. Market Analysis, Insights and Forecast - By Country/Sub-region
- 14.1.1 Brazil
- 14.1.2 Rest of Latin America
- 15. Middle East and Africa Land-based Smart Weapons Market Analysis, Insights and Forecast, 2019-2031
- 15.1. Market Analysis, Insights and Forecast - By Country/Sub-region
- 15.1.1 Saudi Arabia
- 15.1.2 United Arab Emirates
- 15.1.3 Israel
- 15.1.4 Rest of Middle East and Africa
- 16. Competitive Analysis
- 16.1. Global Market Share Analysis 2024
- 16.2. Company Profiles
- 16.2.1 General Dynamics Corporation
- 16.2.1.1. Overview
- 16.2.1.2. Products
- 16.2.1.3. SWOT Analysis
- 16.2.1.4. Recent Developments
- 16.2.1.5. Financials (Based on Availability)
- 16.2.2 Rheinmetall AG
- 16.2.2.1. Overview
- 16.2.2.2. Products
- 16.2.2.3. SWOT Analysis
- 16.2.2.4. Recent Developments
- 16.2.2.5. Financials (Based on Availability)
- 16.2.3 Lockheed Martin Corporation
- 16.2.3.1. Overview
- 16.2.3.2. Products
- 16.2.3.3. SWOT Analysis
- 16.2.3.4. Recent Developments
- 16.2.3.5. Financials (Based on Availability)
- 16.2.4 MBDA
- 16.2.4.1. Overview
- 16.2.4.2. Products
- 16.2.4.3. SWOT Analysis
- 16.2.4.4. Recent Developments
- 16.2.4.5. Financials (Based on Availability)
- 16.2.5 Safran SA
- 16.2.5.1. Overview
- 16.2.5.2. Products
- 16.2.5.3. SWOT Analysis
- 16.2.5.4. Recent Developments
- 16.2.5.5. Financials (Based on Availability)
- 16.2.6 Rafael Advanced Defense Systems Ltd
- 16.2.6.1. Overview
- 16.2.6.2. Products
- 16.2.6.3. SWOT Analysis
- 16.2.6.4. Recent Developments
- 16.2.6.5. Financials (Based on Availability)
- 16.2.7 RTX Corporation
- 16.2.7.1. Overview
- 16.2.7.2. Products
- 16.2.7.3. SWOT Analysis
- 16.2.7.4. Recent Developments
- 16.2.7.5. Financials (Based on Availability)
- 16.2.8 BAE Systems PLC
- 16.2.8.1. Overview
- 16.2.8.2. Products
- 16.2.8.3. SWOT Analysis
- 16.2.8.4. Recent Developments
- 16.2.8.5. Financials (Based on Availability)
- 16.2.9 Northrop Grumman Corporation
- 16.2.9.1. Overview
- 16.2.9.2. Products
- 16.2.9.3. SWOT Analysis
- 16.2.9.4. Recent Developments
- 16.2.9.5. Financials (Based on Availability)
- 16.2.10 IA
- 16.2.10.1. Overview
- 16.2.10.2. Products
- 16.2.10.3. SWOT Analysis
- 16.2.10.4. Recent Developments
- 16.2.10.5. Financials (Based on Availability)
- 16.2.1 General Dynamics Corporation
List of Figures
- Figure 1: Global Land-based Smart Weapons Market Revenue Breakdown (Million, %) by Region 2024 & 2032
- Figure 2: North America Land-based Smart Weapons Market Revenue (Million), by Country 2024 & 2032
- Figure 3: North America Land-based Smart Weapons Market Revenue Share (%), by Country 2024 & 2032
- Figure 4: Europe Land-based Smart Weapons Market Revenue (Million), by Country 2024 & 2032
- Figure 5: Europe Land-based Smart Weapons Market Revenue Share (%), by Country 2024 & 2032
- Figure 6: Asia Pacific Land-based Smart Weapons Market Revenue (Million), by Country 2024 & 2032
- Figure 7: Asia Pacific Land-based Smart Weapons Market Revenue Share (%), by Country 2024 & 2032
- Figure 8: Latin America Land-based Smart Weapons Market Revenue (Million), by Country 2024 & 2032
- Figure 9: Latin America Land-based Smart Weapons Market Revenue Share (%), by Country 2024 & 2032
- Figure 10: Middle East and Africa Land-based Smart Weapons Market Revenue (Million), by Country 2024 & 2032
- Figure 11: Middle East and Africa Land-based Smart Weapons Market Revenue Share (%), by Country 2024 & 2032
- Figure 12: North America Land-based Smart Weapons Market Revenue (Million), by Product 2024 & 2032
- Figure 13: North America Land-based Smart Weapons Market Revenue Share (%), by Product 2024 & 2032
- Figure 14: North America Land-based Smart Weapons Market Revenue (Million), by Technology 2024 & 2032
- Figure 15: North America Land-based Smart Weapons Market Revenue Share (%), by Technology 2024 & 2032
- Figure 16: North America Land-based Smart Weapons Market Revenue (Million), by Country 2024 & 2032
- Figure 17: North America Land-based Smart Weapons Market Revenue Share (%), by Country 2024 & 2032
- Figure 18: Europe Land-based Smart Weapons Market Revenue (Million), by Product 2024 & 2032
- Figure 19: Europe Land-based Smart Weapons Market Revenue Share (%), by Product 2024 & 2032
- Figure 20: Europe Land-based Smart Weapons Market Revenue (Million), by Technology 2024 & 2032
- Figure 21: Europe Land-based Smart Weapons Market Revenue Share (%), by Technology 2024 & 2032
- Figure 22: Europe Land-based Smart Weapons Market Revenue (Million), by Country 2024 & 2032
- Figure 23: Europe Land-based Smart Weapons Market Revenue Share (%), by Country 2024 & 2032
- Figure 24: Asia Pacific Land-based Smart Weapons Market Revenue (Million), by Product 2024 & 2032
- Figure 25: Asia Pacific Land-based Smart Weapons Market Revenue Share (%), by Product 2024 & 2032
- Figure 26: Asia Pacific Land-based Smart Weapons Market Revenue (Million), by Technology 2024 & 2032
- Figure 27: Asia Pacific Land-based Smart Weapons Market Revenue Share (%), by Technology 2024 & 2032
- Figure 28: Asia Pacific Land-based Smart Weapons Market Revenue (Million), by Country 2024 & 2032
- Figure 29: Asia Pacific Land-based Smart Weapons Market Revenue Share (%), by Country 2024 & 2032
- Figure 30: Latin America Land-based Smart Weapons Market Revenue (Million), by Product 2024 & 2032
- Figure 31: Latin America Land-based Smart Weapons Market Revenue Share (%), by Product 2024 & 2032
- Figure 32: Latin America Land-based Smart Weapons Market Revenue (Million), by Technology 2024 & 2032
- Figure 33: Latin America Land-based Smart Weapons Market Revenue Share (%), by Technology 2024 & 2032
- Figure 34: Latin America Land-based Smart Weapons Market Revenue (Million), by Country 2024 & 2032
- Figure 35: Latin America Land-based Smart Weapons Market Revenue Share (%), by Country 2024 & 2032
- Figure 36: Middle East and Africa Land-based Smart Weapons Market Revenue (Million), by Product 2024 & 2032
- Figure 37: Middle East and Africa Land-based Smart Weapons Market Revenue Share (%), by Product 2024 & 2032
- Figure 38: Middle East and Africa Land-based Smart Weapons Market Revenue (Million), by Technology 2024 & 2032
- Figure 39: Middle East and Africa Land-based Smart Weapons Market Revenue Share (%), by Technology 2024 & 2032
- Figure 40: Middle East and Africa Land-based Smart Weapons Market Revenue (Million), by Country 2024 & 2032
- Figure 41: Middle East and Africa Land-based Smart Weapons Market Revenue Share (%), by Country 2024 & 2032
List of Tables
- Table 1: Global Land-based Smart Weapons Market Revenue Million Forecast, by Region 2019 & 2032
- Table 2: Global Land-based Smart Weapons Market Revenue Million Forecast, by Product 2019 & 2032
- Table 3: Global Land-based Smart Weapons Market Revenue Million Forecast, by Technology 2019 & 2032
- Table 4: Global Land-based Smart Weapons Market Revenue Million Forecast, by Region 2019 & 2032
- Table 5: Global Land-based Smart Weapons Market Revenue Million Forecast, by Country 2019 & 2032
- Table 6: United States Land-based Smart Weapons Market Revenue (Million) Forecast, by Application 2019 & 2032
- Table 7: Canada Land-based Smart Weapons Market Revenue (Million) Forecast, by Application 2019 & 2032
- Table 8: Global Land-based Smart Weapons Market Revenue Million Forecast, by Country 2019 & 2032
- Table 9: United Kingdom Land-based Smart Weapons Market Revenue (Million) Forecast, by Application 2019 & 2032
- Table 10: France Land-based Smart Weapons Market Revenue (Million) Forecast, by Application 2019 & 2032
- Table 11: Germany Land-based Smart Weapons Market Revenue (Million) Forecast, by Application 2019 & 2032
- Table 12: Russia Land-based Smart Weapons Market Revenue (Million) Forecast, by Application 2019 & 2032
- Table 13: Rest of Europe Land-based Smart Weapons Market Revenue (Million) Forecast, by Application 2019 & 2032
- Table 14: Global Land-based Smart Weapons Market Revenue Million Forecast, by Country 2019 & 2032
- Table 15: China Land-based Smart Weapons Market Revenue (Million) Forecast, by Application 2019 & 2032
- Table 16: India Land-based Smart Weapons Market Revenue (Million) Forecast, by Application 2019 & 2032
- Table 17: Japan Land-based Smart Weapons Market Revenue (Million) Forecast, by Application 2019 & 2032
- Table 18: Rest of Asia Pacific Land-based Smart Weapons Market Revenue (Million) Forecast, by Application 2019 & 2032
- Table 19: Global Land-based Smart Weapons Market Revenue Million Forecast, by Country 2019 & 2032
- Table 20: Brazil Land-based Smart Weapons Market Revenue (Million) Forecast, by Application 2019 & 2032
- Table 21: Rest of Latin America Land-based Smart Weapons Market Revenue (Million) Forecast, by Application 2019 & 2032
- Table 22: Global Land-based Smart Weapons Market Revenue Million Forecast, by Country 2019 & 2032
- Table 23: Saudi Arabia Land-based Smart Weapons Market Revenue (Million) Forecast, by Application 2019 & 2032
- Table 24: United Arab Emirates Land-based Smart Weapons Market Revenue (Million) Forecast, by Application 2019 & 2032
- Table 25: Israel Land-based Smart Weapons Market Revenue (Million) Forecast, by Application 2019 & 2032
- Table 26: Rest of Middle East and Africa Land-based Smart Weapons Market Revenue (Million) Forecast, by Application 2019 & 2032
- Table 27: Global Land-based Smart Weapons Market Revenue Million Forecast, by Product 2019 & 2032
- Table 28: Global Land-based Smart Weapons Market Revenue Million Forecast, by Technology 2019 & 2032
- Table 29: Global Land-based Smart Weapons Market Revenue Million Forecast, by Country 2019 & 2032
- Table 30: United States Land-based Smart Weapons Market Revenue (Million) Forecast, by Application 2019 & 2032
- Table 31: Canada Land-based Smart Weapons Market Revenue (Million) Forecast, by Application 2019 & 2032
- Table 32: Global Land-based Smart Weapons Market Revenue Million Forecast, by Product 2019 & 2032
- Table 33: Global Land-based Smart Weapons Market Revenue Million Forecast, by Technology 2019 & 2032
- Table 34: Global Land-based Smart Weapons Market Revenue Million Forecast, by Country 2019 & 2032
- Table 35: United Kingdom Land-based Smart Weapons Market Revenue (Million) Forecast, by Application 2019 & 2032
- Table 36: France Land-based Smart Weapons Market Revenue (Million) Forecast, by Application 2019 & 2032
- Table 37: Germany Land-based Smart Weapons Market Revenue (Million) Forecast, by Application 2019 & 2032
- Table 38: Russia Land-based Smart Weapons Market Revenue (Million) Forecast, by Application 2019 & 2032
- Table 39: Rest of Europe Land-based Smart Weapons Market Revenue (Million) Forecast, by Application 2019 & 2032
- Table 40: Global Land-based Smart Weapons Market Revenue Million Forecast, by Product 2019 & 2032
- Table 41: Global Land-based Smart Weapons Market Revenue Million Forecast, by Technology 2019 & 2032
- Table 42: Global Land-based Smart Weapons Market Revenue Million Forecast, by Country 2019 & 2032
- Table 43: China Land-based Smart Weapons Market Revenue (Million) Forecast, by Application 2019 & 2032
- Table 44: India Land-based Smart Weapons Market Revenue (Million) Forecast, by Application 2019 & 2032
- Table 45: Japan Land-based Smart Weapons Market Revenue (Million) Forecast, by Application 2019 & 2032
- Table 46: Rest of Asia Pacific Land-based Smart Weapons Market Revenue (Million) Forecast, by Application 2019 & 2032
- Table 47: Global Land-based Smart Weapons Market Revenue Million Forecast, by Product 2019 & 2032
- Table 48: Global Land-based Smart Weapons Market Revenue Million Forecast, by Technology 2019 & 2032
- Table 49: Global Land-based Smart Weapons Market Revenue Million Forecast, by Country 2019 & 2032
- Table 50: Brazil Land-based Smart Weapons Market Revenue (Million) Forecast, by Application 2019 & 2032
- Table 51: Rest of Latin America Land-based Smart Weapons Market Revenue (Million) Forecast, by Application 2019 & 2032
- Table 52: Global Land-based Smart Weapons Market Revenue Million Forecast, by Product 2019 & 2032
- Table 53: Global Land-based Smart Weapons Market Revenue Million Forecast, by Technology 2019 & 2032
- Table 54: Global Land-based Smart Weapons Market Revenue Million Forecast, by Country 2019 & 2032
- Table 55: Saudi Arabia Land-based Smart Weapons Market Revenue (Million) Forecast, by Application 2019 & 2032
- Table 56: United Arab Emirates Land-based Smart Weapons Market Revenue (Million) Forecast, by Application 2019 & 2032
- Table 57: Israel Land-based Smart Weapons Market Revenue (Million) Forecast, by Application 2019 & 2032
- Table 58: Rest of Middle East and Africa Land-based Smart Weapons Market Revenue (Million) Forecast, by Application 2019 & 2032
Frequently Asked Questions
1. What is the projected Compound Annual Growth Rate (CAGR) of the Land-based Smart Weapons Market?
The projected CAGR is approximately 7.48%.
2. Which companies are prominent players in the Land-based Smart Weapons Market?
Key companies in the market include General Dynamics Corporation, Rheinmetall AG, Lockheed Martin Corporation, MBDA, Safran SA, Rafael Advanced Defense Systems Ltd, RTX Corporation, BAE Systems PLC, Northrop Grumman Corporation, IA.
3. What are the main segments of the Land-based Smart Weapons Market?
The market segments include Product, Technology.
4. Can you provide details about the market size?
The market size is estimated to be USD 7.35 Million as of 2022.
5. What are some drivers contributing to market growth?
N/A
6. What are the notable trends driving market growth?
Ammunitions and Other Products Segment is Expected to Witness Highest Growth.
7. Are there any restraints impacting market growth?
N/A
8. Can you provide examples of recent developments in the market?
N/A
9. What pricing options are available for accessing the report?
Pricing options include single-user, multi-user, and enterprise licenses priced at USD 4750, USD 5250, and USD 8750 respectively.
10. Is the market size provided in terms of value or volume?
The market size is provided in terms of value, measured in Million.
11. Are there any specific market keywords associated with the report?
Yes, the market keyword associated with the report is "Land-based Smart Weapons Market," which aids in identifying and referencing the specific market segment covered.
12. How do I determine which pricing option suits my needs best?
The pricing options vary based on user requirements and access needs. Individual users may opt for single-user licenses, while businesses requiring broader access may choose multi-user or enterprise licenses for cost-effective access to the report.
13. Are there any additional resources or data provided in the Land-based Smart Weapons Market report?
While the report offers comprehensive insights, it's advisable to review the specific contents or supplementary materials provided to ascertain if additional resources or data are available.
14. How can I stay updated on further developments or reports in the Land-based Smart Weapons Market?
To stay informed about further developments, trends, and reports in the Land-based Smart Weapons Market, consider subscribing to industry newsletters, following relevant companies and organizations, or regularly checking reputable industry news sources and publications.
Methodology
Step 1 - Identification of Relevant Samples Size from Population Database


Step 2 - Approaches for Defining Global Market Size (Value, Volume* & Price*)

Note*: In applicable scenarios
Step 3 - Data Sources
Primary Research
- Web Analytics
- Survey Reports
- Research Institute
- Latest Research Reports
- Opinion Leaders
Secondary Research
- Annual Reports
- White Paper
- Latest Press Release
- Industry Association
- Paid Database
- Investor Presentations

Step 4 - Data Triangulation
Involves using different sources of information in order to increase the validity of a study
These sources are likely to be stakeholders in a program - participants, other researchers, program staff, other community members, and so on.
Then we put all data in single framework & apply various statistical tools to find out the dynamic on the market.
During the analysis stage, feedback from the stakeholder groups would be compared to determine areas of agreement as well as areas of divergence


