
Key Insights
The global invisible orthodontics market is experiencing robust growth, driven by increasing consumer demand for aesthetically pleasing and discreet teeth straightening solutions. The market's expansion is fueled by several key factors. Firstly, rising disposable incomes, particularly in developing economies, are making orthodontic treatments more accessible to a wider population. Secondly, technological advancements in clear aligner technology have led to improved comfort, shorter treatment times, and more predictable results, enhancing patient satisfaction and driving market adoption. The increasing prevalence of malocclusion (improper bite) among both adults and children also contributes significantly to market growth. While traditional metal braces remain prevalent, the preference for less visible alternatives is rapidly shifting market share towards clear aligners, ceramic braces, and lingual braces. The segment comprising adult patients is currently the largest, reflecting a growing awareness of the aesthetic and functional benefits of straight teeth beyond adolescence. Key players in the market, such as Align Technology, 3M, and Dentsply Sirona, are continuously investing in research and development to further improve product efficacy and expand their market reach through strategic acquisitions and partnerships. The competitive landscape is dynamic, with established players facing increasing competition from emerging direct-to-consumer brands offering more affordable treatment options. The market is segmented geographically, with North America and Europe currently holding the largest market shares due to high awareness, advanced healthcare infrastructure, and strong regulatory frameworks. However, Asia-Pacific is projected to witness the fastest growth in the coming years, driven by rapid economic expansion and a rising middle class.
The future of the invisible orthodontics market looks promising. The continued innovation in aligner technology, the expansion of telehealth platforms offering remote monitoring and virtual consultations, and the growing integration of artificial intelligence in treatment planning are expected to significantly impact market growth. While cost remains a barrier for some, the increasing affordability of clear aligners and innovative financing options are gradually mitigating this challenge. Furthermore, the growing focus on preventive orthodontics, particularly among younger populations, is poised to contribute to sustained long-term growth. Regulatory approvals and guidelines for invisible orthodontic treatments will also play a crucial role in shaping market dynamics across different regions. The market will likely see further consolidation as larger players seek to acquire smaller competitors and expand their global presence.
Invisible Orthodontics Market: A Comprehensive Report (2019-2033)
This comprehensive report provides an in-depth analysis of the Invisible Orthodontics Market, encompassing its current state, future trajectory, and key players. With a focus on clear aligners, ceramic braces, and lingual braces, this study segments the market by patient group (adults, teenagers, children) and end-user (hospitals, dental and orthodontic clinics). The report covers the period 2019-2033, with 2025 as the base year. The total market size is projected to reach xx Billion by 2033.
Invisible Orthodontics Market Dynamics & Structure
This section analyzes the market's competitive landscape, technological advancements, regulatory influences, and market trends. The Invisible Orthodontics market, a sub-segment of the larger Orthodontic Devices market (valued at xx Billion in 2025), is characterized by moderate concentration with key players holding significant market share. Align Technology Inc. and Dentsply Sirona are estimated to hold xx% and xx% market share respectively in 2025.
- Market Concentration: Moderately concentrated, with top 5 players holding approximately xx% of the market share in 2025.
- Technological Innovation: Continuous innovation in materials science (e.g., development of more comfortable and aesthetically pleasing aligners) and digital technologies (e.g., 3D printing and AI-powered treatment planning) are key drivers.
- Regulatory Framework: Varying regulatory approvals and reimbursement policies across different geographies impact market penetration.
- Competitive Substitutes: Traditional metal braces remain a significant competitor, although the preference for aesthetic solutions is driving growth in the invisible orthodontics segment.
- End-User Demographics: Increasing awareness of cosmetic dentistry and a rising preference for discreet orthodontic treatment among adults fuel market expansion.
- M&A Trends: The market has witnessed a moderate level of M&A activity in recent years, with approximately xx deals recorded between 2019 and 2024, primarily focused on expanding product portfolios and geographic reach. These deals contributed to approximately xx Billion in total value.
Invisible Orthodontics Market Growth Trends & Insights
The Invisible Orthodontics Market has witnessed substantial growth over the historical period (2019-2024), driven by increasing demand for aesthetically pleasing orthodontic solutions. The market size expanded from xx Billion in 2019 to xx Billion in 2024, exhibiting a CAGR of xx%. This growth is projected to continue during the forecast period (2025-2033), reaching xx Billion by 2033, with a projected CAGR of xx%. This expansion is fueled by technological advancements, increasing consumer awareness, and expanding access to care. The adoption rate of clear aligners, in particular, is significantly increasing among adults, contributing substantially to the overall market growth. Furthermore, technological disruptions such as AI-powered treatment planning are improving efficiency and precision, further propelling market expansion. Shifting consumer preferences toward minimally invasive procedures and improved aesthetics are also key factors contributing to the market's growth trajectory.

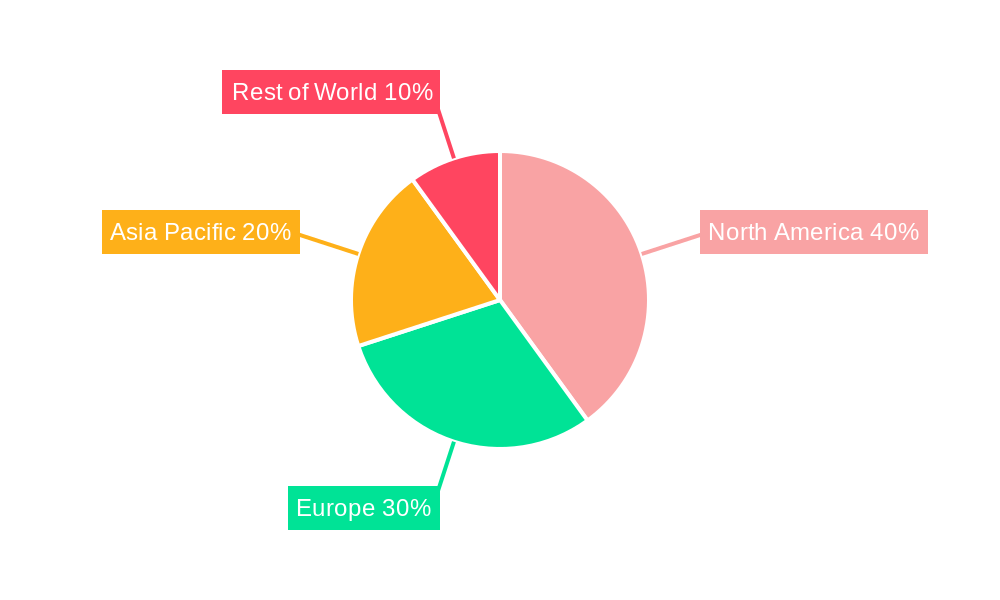
Dominant Regions, Countries, or Segments in Invisible Orthodontics Market
North America currently dominates the Invisible Orthodontics Market, holding approximately xx% of the global market share in 2025, followed by Europe with xx%. This dominance is attributed to high disposable incomes, advanced healthcare infrastructure, and increased awareness of cosmetic dentistry. The clear aligner segment holds the largest market share among product types, while the adult patient group represents the most significant segment by patient type.
- Key Drivers for North America:
- High disposable incomes and healthcare expenditure.
- Strong presence of key market players and advanced healthcare infrastructure.
- High adoption rate of technologically advanced treatment options.
- Key Drivers for Europe:
- Increasing awareness of aesthetic dentistry and growing demand for discreet treatment options.
- Expanding access to dental insurance and reimbursement policies.
- Growing number of dental clinics offering invisible orthodontic solutions.
- High Growth Potential Segments: The Asia-Pacific region presents significant growth potential due to rising disposable incomes, an expanding middle class, and increased awareness of aesthetic dentistry.
Invisible Orthodontics Market Product Landscape
The Invisible Orthodontics market offers a diverse range of products, including clear aligners, ceramic braces, and lingual braces. Clear aligners are the most popular option, due to their aesthetics and comfort. Continuous innovation focuses on improving material properties for enhanced comfort, durability, and aesthetics. Technological advancements such as 3D printing and advanced CAD/CAM software enable precise manufacturing and customized treatment plans. Unique selling propositions often center around enhanced comfort, improved aesthetics, shorter treatment times, and reduced visits to the orthodontist.
Key Drivers, Barriers & Challenges in Invisible Orthodontics Market
Key Drivers:
- Increasing consumer preference for aesthetic orthodontic treatments.
- Technological advancements leading to improved comfort, efficacy, and treatment duration.
- Rising disposable incomes and health insurance coverage in developed and developing economies.
Key Challenges & Restraints:
- High initial cost of treatment can act as a barrier to entry for some consumers.
- Potential for relapse after treatment completion requires ongoing patient compliance.
- Regulatory hurdles and variations in reimbursement policies across different geographies can impact market penetration. (Estimated impact: reduction in market growth by approximately xx% in certain regions).
Emerging Opportunities in Invisible Orthodontics Market
- Expansion into untapped markets in developing economies with rising middle classes.
- Development of innovative materials and technologies to further improve aesthetics, comfort, and treatment time.
- Personalized treatment plans leveraging AI and machine learning for optimized outcomes.
- Focus on developing digital platforms for remote monitoring and patient engagement.
Growth Accelerators in the Invisible Orthodontics Market Industry
Technological breakthroughs, particularly in materials science and digital technologies, are pivotal in accelerating market growth. Strategic partnerships between orthodontic providers and technology companies are streamlining treatment processes and enhancing patient experience. Furthermore, targeted marketing campaigns that highlight the aesthetic and health benefits of invisible orthodontics are driving greater consumer adoption. Expansion into new geographical markets and increased awareness through educational initiatives are also crucial drivers of long-term growth.
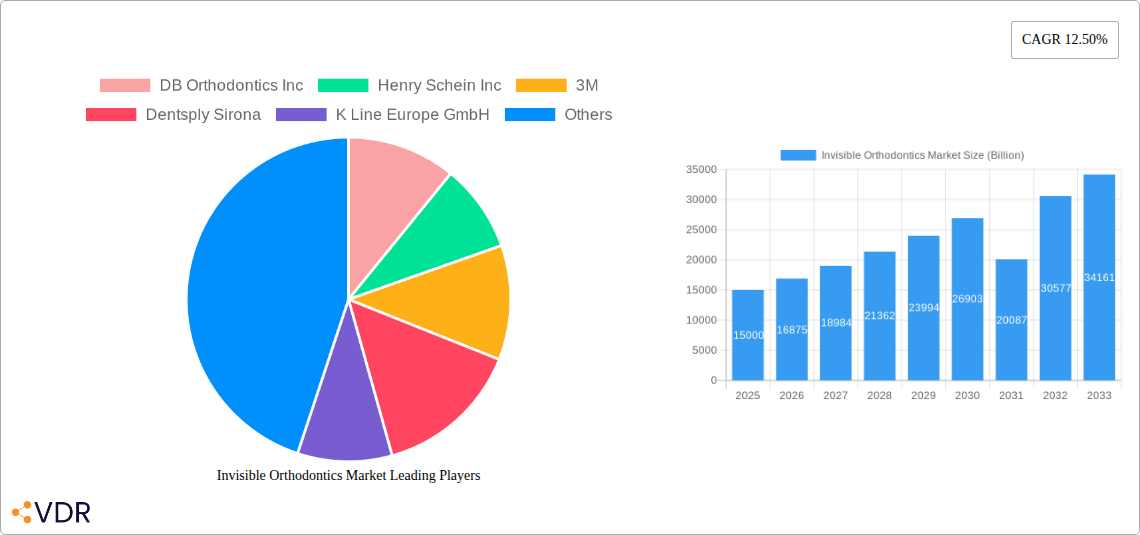
Key Players Shaping the Invisible Orthodontics Market Market
- DB Orthodontics Inc
- Henry Schein Inc
- 3M
- Dentsply Sirona
- K Line Europe GmbH
- Align Technology Inc
- ClearPath Healthcare Services Pvt Ltd
- G&H Orthodontics
- Institut Straumann AG
- SmileDirectClub
- Envista Holdings (Ormco)
Notable Milestones in Invisible Orthodontics Market Sector
- February 2022: OraPharma launched the OraFit custom clear aligner system in the United States, introducing a three-layer design for improved aesthetics and comfort.
- February 2022: Ormco Corporation launched Spark Clear Aligners Release 12, incorporating industry-leading clinical enhancements and optimized case planning. These launches contributed to increased market competition and innovation.
In-Depth Invisible Orthodontics Market Market Outlook
The Invisible Orthodontics Market is poised for continued robust growth, driven by ongoing technological advancements, expanding consumer awareness, and increasing accessibility of treatment options. The focus on personalized treatment plans, innovative materials, and digital solutions will shape the market landscape in the coming years. Strategic partnerships and market expansion into developing economies represent significant opportunities for growth and market share expansion. The market's future potential is substantial, with projected growth exceeding xx Billion by 2033.
Invisible Orthodontics Market Segmentation
-
1. Product
- 1.1. Ceramic Braces
- 1.2. Clear Aligners
- 1.3. Lingual Braces
-
2. Patient Group
- 2.1. Adults
- 2.2. Teenagers
- 2.3. Children
-
3. End User
- 3.1. Hospitals
- 3.2. Dental and Orthodontic Clinics
Invisible Orthodontics Market Segmentation By Geography
-
1. North America
- 1.1. United States
- 1.2. Canada
- 1.3. Mexico
-
2. Europe
- 2.1. Germany
- 2.2. United Kingdom
- 2.3. France
- 2.4. Italy
- 2.5. Spain
- 2.6. Rest of Europe
-
3. Asia Pacific
- 3.1. China
- 3.2. Japan
- 3.3. India
- 3.4. Australia
- 3.5. South Korea
- 3.6. Rest of Asia Pacific
-
4. Middle East and Africa
- 4.1. GCC
- 4.2. South Africa
- 4.3. Rest of Middle East and Africa
-
5. South America
- 5.1. Brazil
- 5.2. Argentina
- 5.3. Rest of South America
Invisible Orthodontics Market REPORT HIGHLIGHTS
| Aspects | Details |
|---|---|
| Study Period | 2019-2033 |
| Base Year | 2024 |
| Estimated Year | 2025 |
| Forecast Period | 2025-2033 |
| Historical Period | 2019-2024 |
| Growth Rate | CAGR of 12.50% from 2019-2033 |
| Segmentation |
|
Table of Contents
- 1. Introduction
- 1.1. Research Scope
- 1.2. Market Segmentation
- 1.3. Research Methodology
- 1.4. Definitions and Assumptions
- 2. Executive Summary
- 2.1. Introduction
- 3. Market Dynamics
- 3.1. Introduction
- 3.2. Market Drivers
- 3.2.1. Increasing Prevalence of Dental Diseases; Surge in Aesthetic Consciousness Leading to Rise in Demand for Invisible Orthodontics; Advancements in Technologies Driven by CAD/CAM
- 3.3. Market Restrains
- 3.3.1. High Costs Associated with Invisible Orthodontics
- 3.4. Market Trends
- 3.4.1. Clear Aligners Anticipated to Witness Significant Growth in the Market
- 4. Market Factor Analysis
- 4.1. Porters Five Forces
- 4.2. Supply/Value Chain
- 4.3. PESTEL analysis
- 4.4. Market Entropy
- 4.5. Patent/Trademark Analysis
- 5. Global Invisible Orthodontics Market Analysis, Insights and Forecast, 2019-2031
- 5.1. Market Analysis, Insights and Forecast - by Product
- 5.1.1. Ceramic Braces
- 5.1.2. Clear Aligners
- 5.1.3. Lingual Braces
- 5.2. Market Analysis, Insights and Forecast - by Patient Group
- 5.2.1. Adults
- 5.2.2. Teenagers
- 5.2.3. Children
- 5.3. Market Analysis, Insights and Forecast - by End User
- 5.3.1. Hospitals
- 5.3.2. Dental and Orthodontic Clinics
- 5.4. Market Analysis, Insights and Forecast - by Region
- 5.4.1. North America
- 5.4.2. Europe
- 5.4.3. Asia Pacific
- 5.4.4. Middle East and Africa
- 5.4.5. South America
- 5.1. Market Analysis, Insights and Forecast - by Product
- 6. North America Invisible Orthodontics Market Analysis, Insights and Forecast, 2019-2031
- 6.1. Market Analysis, Insights and Forecast - by Product
- 6.1.1. Ceramic Braces
- 6.1.2. Clear Aligners
- 6.1.3. Lingual Braces
- 6.2. Market Analysis, Insights and Forecast - by Patient Group
- 6.2.1. Adults
- 6.2.2. Teenagers
- 6.2.3. Children
- 6.3. Market Analysis, Insights and Forecast - by End User
- 6.3.1. Hospitals
- 6.3.2. Dental and Orthodontic Clinics
- 6.1. Market Analysis, Insights and Forecast - by Product
- 7. Europe Invisible Orthodontics Market Analysis, Insights and Forecast, 2019-2031
- 7.1. Market Analysis, Insights and Forecast - by Product
- 7.1.1. Ceramic Braces
- 7.1.2. Clear Aligners
- 7.1.3. Lingual Braces
- 7.2. Market Analysis, Insights and Forecast - by Patient Group
- 7.2.1. Adults
- 7.2.2. Teenagers
- 7.2.3. Children
- 7.3. Market Analysis, Insights and Forecast - by End User
- 7.3.1. Hospitals
- 7.3.2. Dental and Orthodontic Clinics
- 7.1. Market Analysis, Insights and Forecast - by Product
- 8. Asia Pacific Invisible Orthodontics Market Analysis, Insights and Forecast, 2019-2031
- 8.1. Market Analysis, Insights and Forecast - by Product
- 8.1.1. Ceramic Braces
- 8.1.2. Clear Aligners
- 8.1.3. Lingual Braces
- 8.2. Market Analysis, Insights and Forecast - by Patient Group
- 8.2.1. Adults
- 8.2.2. Teenagers
- 8.2.3. Children
- 8.3. Market Analysis, Insights and Forecast - by End User
- 8.3.1. Hospitals
- 8.3.2. Dental and Orthodontic Clinics
- 8.1. Market Analysis, Insights and Forecast - by Product
- 9. Middle East and Africa Invisible Orthodontics Market Analysis, Insights and Forecast, 2019-2031
- 9.1. Market Analysis, Insights and Forecast - by Product
- 9.1.1. Ceramic Braces
- 9.1.2. Clear Aligners
- 9.1.3. Lingual Braces
- 9.2. Market Analysis, Insights and Forecast - by Patient Group
- 9.2.1. Adults
- 9.2.2. Teenagers
- 9.2.3. Children
- 9.3. Market Analysis, Insights and Forecast - by End User
- 9.3.1. Hospitals
- 9.3.2. Dental and Orthodontic Clinics
- 9.1. Market Analysis, Insights and Forecast - by Product
- 10. South America Invisible Orthodontics Market Analysis, Insights and Forecast, 2019-2031
- 10.1. Market Analysis, Insights and Forecast - by Product
- 10.1.1. Ceramic Braces
- 10.1.2. Clear Aligners
- 10.1.3. Lingual Braces
- 10.2. Market Analysis, Insights and Forecast - by Patient Group
- 10.2.1. Adults
- 10.2.2. Teenagers
- 10.2.3. Children
- 10.3. Market Analysis, Insights and Forecast - by End User
- 10.3.1. Hospitals
- 10.3.2. Dental and Orthodontic Clinics
- 10.1. Market Analysis, Insights and Forecast - by Product
- 11. North Americ Invisible Orthodontics Market Analysis, Insights and Forecast, 2019-2031
- 11.1. Market Analysis, Insights and Forecast - By Country/Sub-region
- 11.1.1 United States
- 11.1.2 Canada
- 11.1.3 Mexico
- 12. South America Invisible Orthodontics Market Analysis, Insights and Forecast, 2019-2031
- 12.1. Market Analysis, Insights and Forecast - By Country/Sub-region
- 12.1.1 Brazil
- 12.1.2 Mexico
- 12.1.3 Rest of South America
- 13. Asia Pacific Invisible Orthodontics Market Analysis, Insights and Forecast, 2019-2031
- 13.1. Market Analysis, Insights and Forecast - By Country/Sub-region
- 13.1.1 China
- 13.1.2 Japan
- 13.1.3 India
- 13.1.4 South Korea
- 13.1.5 Taiwan
- 13.1.6 Australia
- 13.1.7 Rest of Asia-Pacific
- 14. Europe Invisible Orthodontics Market Analysis, Insights and Forecast, 2019-2031
- 14.1. Market Analysis, Insights and Forecast - By Country/Sub-region
- 14.1.1 Germany
- 14.1.2 United Kingdom
- 14.1.3 France
- 14.1.4 Italy
- 14.1.5 Spain
- 14.1.6 Rest of Europe
- 15. MEA Invisible Orthodontics Market Analysis, Insights and Forecast, 2019-2031
- 15.1. Market Analysis, Insights and Forecast - By Country/Sub-region
- 15.1.1 Middle East
- 15.1.2 Africa
- 16. Competitive Analysis
- 16.1. Global Market Share Analysis 2024
- 16.2. Company Profiles
- 16.2.1 DB Orthodontics Inc
- 16.2.1.1. Overview
- 16.2.1.2. Products
- 16.2.1.3. SWOT Analysis
- 16.2.1.4. Recent Developments
- 16.2.1.5. Financials (Based on Availability)
- 16.2.2 Henry Schein Inc
- 16.2.2.1. Overview
- 16.2.2.2. Products
- 16.2.2.3. SWOT Analysis
- 16.2.2.4. Recent Developments
- 16.2.2.5. Financials (Based on Availability)
- 16.2.3 3M
- 16.2.3.1. Overview
- 16.2.3.2. Products
- 16.2.3.3. SWOT Analysis
- 16.2.3.4. Recent Developments
- 16.2.3.5. Financials (Based on Availability)
- 16.2.4 Dentsply Sirona
- 16.2.4.1. Overview
- 16.2.4.2. Products
- 16.2.4.3. SWOT Analysis
- 16.2.4.4. Recent Developments
- 16.2.4.5. Financials (Based on Availability)
- 16.2.5 K Line Europe GmbH
- 16.2.5.1. Overview
- 16.2.5.2. Products
- 16.2.5.3. SWOT Analysis
- 16.2.5.4. Recent Developments
- 16.2.5.5. Financials (Based on Availability)
- 16.2.6 Align Technology Inc
- 16.2.6.1. Overview
- 16.2.6.2. Products
- 16.2.6.3. SWOT Analysis
- 16.2.6.4. Recent Developments
- 16.2.6.5. Financials (Based on Availability)
- 16.2.7 ClearPath Healthcare Services Pvt Ltd
- 16.2.7.1. Overview
- 16.2.7.2. Products
- 16.2.7.3. SWOT Analysis
- 16.2.7.4. Recent Developments
- 16.2.7.5. Financials (Based on Availability)
- 16.2.8 G&H Orthodontics
- 16.2.8.1. Overview
- 16.2.8.2. Products
- 16.2.8.3. SWOT Analysis
- 16.2.8.4. Recent Developments
- 16.2.8.5. Financials (Based on Availability)
- 16.2.9 Institut Straumann AG
- 16.2.9.1. Overview
- 16.2.9.2. Products
- 16.2.9.3. SWOT Analysis
- 16.2.9.4. Recent Developments
- 16.2.9.5. Financials (Based on Availability)
- 16.2.10 SmileDirectClub
- 16.2.10.1. Overview
- 16.2.10.2. Products
- 16.2.10.3. SWOT Analysis
- 16.2.10.4. Recent Developments
- 16.2.10.5. Financials (Based on Availability)
- 16.2.11 Envista Holdings (Ormco)
- 16.2.11.1. Overview
- 16.2.11.2. Products
- 16.2.11.3. SWOT Analysis
- 16.2.11.4. Recent Developments
- 16.2.11.5. Financials (Based on Availability)
- 16.2.1 DB Orthodontics Inc
List of Figures
- Figure 1: Global Invisible Orthodontics Market Revenue Breakdown (Billion, %) by Region 2024 & 2032
- Figure 2: North Americ Invisible Orthodontics Market Revenue (Billion), by Country 2024 & 2032
- Figure 3: North Americ Invisible Orthodontics Market Revenue Share (%), by Country 2024 & 2032
- Figure 4: South America Invisible Orthodontics Market Revenue (Billion), by Country 2024 & 2032
- Figure 5: South America Invisible Orthodontics Market Revenue Share (%), by Country 2024 & 2032
- Figure 6: Asia Pacific Invisible Orthodontics Market Revenue (Billion), by Country 2024 & 2032
- Figure 7: Asia Pacific Invisible Orthodontics Market Revenue Share (%), by Country 2024 & 2032
- Figure 8: Europe Invisible Orthodontics Market Revenue (Billion), by Country 2024 & 2032
- Figure 9: Europe Invisible Orthodontics Market Revenue Share (%), by Country 2024 & 2032
- Figure 10: MEA Invisible Orthodontics Market Revenue (Billion), by Country 2024 & 2032
- Figure 11: MEA Invisible Orthodontics Market Revenue Share (%), by Country 2024 & 2032
- Figure 12: North America Invisible Orthodontics Market Revenue (Billion), by Product 2024 & 2032
- Figure 13: North America Invisible Orthodontics Market Revenue Share (%), by Product 2024 & 2032
- Figure 14: North America Invisible Orthodontics Market Revenue (Billion), by Patient Group 2024 & 2032
- Figure 15: North America Invisible Orthodontics Market Revenue Share (%), by Patient Group 2024 & 2032
- Figure 16: North America Invisible Orthodontics Market Revenue (Billion), by End User 2024 & 2032
- Figure 17: North America Invisible Orthodontics Market Revenue Share (%), by End User 2024 & 2032
- Figure 18: North America Invisible Orthodontics Market Revenue (Billion), by Country 2024 & 2032
- Figure 19: North America Invisible Orthodontics Market Revenue Share (%), by Country 2024 & 2032
- Figure 20: Europe Invisible Orthodontics Market Revenue (Billion), by Product 2024 & 2032
- Figure 21: Europe Invisible Orthodontics Market Revenue Share (%), by Product 2024 & 2032
- Figure 22: Europe Invisible Orthodontics Market Revenue (Billion), by Patient Group 2024 & 2032
- Figure 23: Europe Invisible Orthodontics Market Revenue Share (%), by Patient Group 2024 & 2032
- Figure 24: Europe Invisible Orthodontics Market Revenue (Billion), by End User 2024 & 2032
- Figure 25: Europe Invisible Orthodontics Market Revenue Share (%), by End User 2024 & 2032
- Figure 26: Europe Invisible Orthodontics Market Revenue (Billion), by Country 2024 & 2032
- Figure 27: Europe Invisible Orthodontics Market Revenue Share (%), by Country 2024 & 2032
- Figure 28: Asia Pacific Invisible Orthodontics Market Revenue (Billion), by Product 2024 & 2032
- Figure 29: Asia Pacific Invisible Orthodontics Market Revenue Share (%), by Product 2024 & 2032
- Figure 30: Asia Pacific Invisible Orthodontics Market Revenue (Billion), by Patient Group 2024 & 2032
- Figure 31: Asia Pacific Invisible Orthodontics Market Revenue Share (%), by Patient Group 2024 & 2032
- Figure 32: Asia Pacific Invisible Orthodontics Market Revenue (Billion), by End User 2024 & 2032
- Figure 33: Asia Pacific Invisible Orthodontics Market Revenue Share (%), by End User 2024 & 2032
- Figure 34: Asia Pacific Invisible Orthodontics Market Revenue (Billion), by Country 2024 & 2032
- Figure 35: Asia Pacific Invisible Orthodontics Market Revenue Share (%), by Country 2024 & 2032
- Figure 36: Middle East and Africa Invisible Orthodontics Market Revenue (Billion), by Product 2024 & 2032
- Figure 37: Middle East and Africa Invisible Orthodontics Market Revenue Share (%), by Product 2024 & 2032
- Figure 38: Middle East and Africa Invisible Orthodontics Market Revenue (Billion), by Patient Group 2024 & 2032
- Figure 39: Middle East and Africa Invisible Orthodontics Market Revenue Share (%), by Patient Group 2024 & 2032
- Figure 40: Middle East and Africa Invisible Orthodontics Market Revenue (Billion), by End User 2024 & 2032
- Figure 41: Middle East and Africa Invisible Orthodontics Market Revenue Share (%), by End User 2024 & 2032
- Figure 42: Middle East and Africa Invisible Orthodontics Market Revenue (Billion), by Country 2024 & 2032
- Figure 43: Middle East and Africa Invisible Orthodontics Market Revenue Share (%), by Country 2024 & 2032
- Figure 44: South America Invisible Orthodontics Market Revenue (Billion), by Product 2024 & 2032
- Figure 45: South America Invisible Orthodontics Market Revenue Share (%), by Product 2024 & 2032
- Figure 46: South America Invisible Orthodontics Market Revenue (Billion), by Patient Group 2024 & 2032
- Figure 47: South America Invisible Orthodontics Market Revenue Share (%), by Patient Group 2024 & 2032
- Figure 48: South America Invisible Orthodontics Market Revenue (Billion), by End User 2024 & 2032
- Figure 49: South America Invisible Orthodontics Market Revenue Share (%), by End User 2024 & 2032
- Figure 50: South America Invisible Orthodontics Market Revenue (Billion), by Country 2024 & 2032
- Figure 51: South America Invisible Orthodontics Market Revenue Share (%), by Country 2024 & 2032
List of Tables
- Table 1: Global Invisible Orthodontics Market Revenue Billion Forecast, by Region 2019 & 2032
- Table 2: Global Invisible Orthodontics Market Revenue Billion Forecast, by Product 2019 & 2032
- Table 3: Global Invisible Orthodontics Market Revenue Billion Forecast, by Patient Group 2019 & 2032
- Table 4: Global Invisible Orthodontics Market Revenue Billion Forecast, by End User 2019 & 2032
- Table 5: Global Invisible Orthodontics Market Revenue Billion Forecast, by Region 2019 & 2032
- Table 6: Global Invisible Orthodontics Market Revenue Billion Forecast, by Country 2019 & 2032
- Table 7: United States Invisible Orthodontics Market Revenue (Billion) Forecast, by Application 2019 & 2032
- Table 8: Canada Invisible Orthodontics Market Revenue (Billion) Forecast, by Application 2019 & 2032
- Table 9: Mexico Invisible Orthodontics Market Revenue (Billion) Forecast, by Application 2019 & 2032
- Table 10: Global Invisible Orthodontics Market Revenue Billion Forecast, by Country 2019 & 2032
- Table 11: Brazil Invisible Orthodontics Market Revenue (Billion) Forecast, by Application 2019 & 2032
- Table 12: Mexico Invisible Orthodontics Market Revenue (Billion) Forecast, by Application 2019 & 2032
- Table 13: Rest of South America Invisible Orthodontics Market Revenue (Billion) Forecast, by Application 2019 & 2032
- Table 14: Global Invisible Orthodontics Market Revenue Billion Forecast, by Country 2019 & 2032
- Table 15: China Invisible Orthodontics Market Revenue (Billion) Forecast, by Application 2019 & 2032
- Table 16: Japan Invisible Orthodontics Market Revenue (Billion) Forecast, by Application 2019 & 2032
- Table 17: India Invisible Orthodontics Market Revenue (Billion) Forecast, by Application 2019 & 2032
- Table 18: South Korea Invisible Orthodontics Market Revenue (Billion) Forecast, by Application 2019 & 2032
- Table 19: Taiwan Invisible Orthodontics Market Revenue (Billion) Forecast, by Application 2019 & 2032
- Table 20: Australia Invisible Orthodontics Market Revenue (Billion) Forecast, by Application 2019 & 2032
- Table 21: Rest of Asia-Pacific Invisible Orthodontics Market Revenue (Billion) Forecast, by Application 2019 & 2032
- Table 22: Global Invisible Orthodontics Market Revenue Billion Forecast, by Country 2019 & 2032
- Table 23: Germany Invisible Orthodontics Market Revenue (Billion) Forecast, by Application 2019 & 2032
- Table 24: United Kingdom Invisible Orthodontics Market Revenue (Billion) Forecast, by Application 2019 & 2032
- Table 25: France Invisible Orthodontics Market Revenue (Billion) Forecast, by Application 2019 & 2032
- Table 26: Italy Invisible Orthodontics Market Revenue (Billion) Forecast, by Application 2019 & 2032
- Table 27: Spain Invisible Orthodontics Market Revenue (Billion) Forecast, by Application 2019 & 2032
- Table 28: Rest of Europe Invisible Orthodontics Market Revenue (Billion) Forecast, by Application 2019 & 2032
- Table 29: Global Invisible Orthodontics Market Revenue Billion Forecast, by Country 2019 & 2032
- Table 30: Middle East Invisible Orthodontics Market Revenue (Billion) Forecast, by Application 2019 & 2032
- Table 31: Africa Invisible Orthodontics Market Revenue (Billion) Forecast, by Application 2019 & 2032
- Table 32: Global Invisible Orthodontics Market Revenue Billion Forecast, by Product 2019 & 2032
- Table 33: Global Invisible Orthodontics Market Revenue Billion Forecast, by Patient Group 2019 & 2032
- Table 34: Global Invisible Orthodontics Market Revenue Billion Forecast, by End User 2019 & 2032
- Table 35: Global Invisible Orthodontics Market Revenue Billion Forecast, by Country 2019 & 2032
- Table 36: United States Invisible Orthodontics Market Revenue (Billion) Forecast, by Application 2019 & 2032
- Table 37: Canada Invisible Orthodontics Market Revenue (Billion) Forecast, by Application 2019 & 2032
- Table 38: Mexico Invisible Orthodontics Market Revenue (Billion) Forecast, by Application 2019 & 2032
- Table 39: Global Invisible Orthodontics Market Revenue Billion Forecast, by Product 2019 & 2032
- Table 40: Global Invisible Orthodontics Market Revenue Billion Forecast, by Patient Group 2019 & 2032
- Table 41: Global Invisible Orthodontics Market Revenue Billion Forecast, by End User 2019 & 2032
- Table 42: Global Invisible Orthodontics Market Revenue Billion Forecast, by Country 2019 & 2032
- Table 43: Germany Invisible Orthodontics Market Revenue (Billion) Forecast, by Application 2019 & 2032
- Table 44: United Kingdom Invisible Orthodontics Market Revenue (Billion) Forecast, by Application 2019 & 2032
- Table 45: France Invisible Orthodontics Market Revenue (Billion) Forecast, by Application 2019 & 2032
- Table 46: Italy Invisible Orthodontics Market Revenue (Billion) Forecast, by Application 2019 & 2032
- Table 47: Spain Invisible Orthodontics Market Revenue (Billion) Forecast, by Application 2019 & 2032
- Table 48: Rest of Europe Invisible Orthodontics Market Revenue (Billion) Forecast, by Application 2019 & 2032
- Table 49: Global Invisible Orthodontics Market Revenue Billion Forecast, by Product 2019 & 2032
- Table 50: Global Invisible Orthodontics Market Revenue Billion Forecast, by Patient Group 2019 & 2032
- Table 51: Global Invisible Orthodontics Market Revenue Billion Forecast, by End User 2019 & 2032
- Table 52: Global Invisible Orthodontics Market Revenue Billion Forecast, by Country 2019 & 2032
- Table 53: China Invisible Orthodontics Market Revenue (Billion) Forecast, by Application 2019 & 2032
- Table 54: Japan Invisible Orthodontics Market Revenue (Billion) Forecast, by Application 2019 & 2032
- Table 55: India Invisible Orthodontics Market Revenue (Billion) Forecast, by Application 2019 & 2032
- Table 56: Australia Invisible Orthodontics Market Revenue (Billion) Forecast, by Application 2019 & 2032
- Table 57: South Korea Invisible Orthodontics Market Revenue (Billion) Forecast, by Application 2019 & 2032
- Table 58: Rest of Asia Pacific Invisible Orthodontics Market Revenue (Billion) Forecast, by Application 2019 & 2032
- Table 59: Global Invisible Orthodontics Market Revenue Billion Forecast, by Product 2019 & 2032
- Table 60: Global Invisible Orthodontics Market Revenue Billion Forecast, by Patient Group 2019 & 2032
- Table 61: Global Invisible Orthodontics Market Revenue Billion Forecast, by End User 2019 & 2032
- Table 62: Global Invisible Orthodontics Market Revenue Billion Forecast, by Country 2019 & 2032
- Table 63: GCC Invisible Orthodontics Market Revenue (Billion) Forecast, by Application 2019 & 2032
- Table 64: South Africa Invisible Orthodontics Market Revenue (Billion) Forecast, by Application 2019 & 2032
- Table 65: Rest of Middle East and Africa Invisible Orthodontics Market Revenue (Billion) Forecast, by Application 2019 & 2032
- Table 66: Global Invisible Orthodontics Market Revenue Billion Forecast, by Product 2019 & 2032
- Table 67: Global Invisible Orthodontics Market Revenue Billion Forecast, by Patient Group 2019 & 2032
- Table 68: Global Invisible Orthodontics Market Revenue Billion Forecast, by End User 2019 & 2032
- Table 69: Global Invisible Orthodontics Market Revenue Billion Forecast, by Country 2019 & 2032
- Table 70: Brazil Invisible Orthodontics Market Revenue (Billion) Forecast, by Application 2019 & 2032
- Table 71: Argentina Invisible Orthodontics Market Revenue (Billion) Forecast, by Application 2019 & 2032
- Table 72: Rest of South America Invisible Orthodontics Market Revenue (Billion) Forecast, by Application 2019 & 2032
Frequently Asked Questions
1. What is the projected Compound Annual Growth Rate (CAGR) of the Invisible Orthodontics Market?
The projected CAGR is approximately 12.50%.
2. Which companies are prominent players in the Invisible Orthodontics Market?
Key companies in the market include DB Orthodontics Inc, Henry Schein Inc, 3M, Dentsply Sirona, K Line Europe GmbH, Align Technology Inc, ClearPath Healthcare Services Pvt Ltd, G&H Orthodontics, Institut Straumann AG, SmileDirectClub, Envista Holdings (Ormco).
3. What are the main segments of the Invisible Orthodontics Market?
The market segments include Product, Patient Group, End User.
4. Can you provide details about the market size?
The market size is estimated to be USD XX Billion as of 2022.
5. What are some drivers contributing to market growth?
Increasing Prevalence of Dental Diseases; Surge in Aesthetic Consciousness Leading to Rise in Demand for Invisible Orthodontics; Advancements in Technologies Driven by CAD/CAM.
6. What are the notable trends driving market growth?
Clear Aligners Anticipated to Witness Significant Growth in the Market.
7. Are there any restraints impacting market growth?
High Costs Associated with Invisible Orthodontics.
8. Can you provide examples of recent developments in the market?
February 2022: OraPharma launched the OraFit custom clear aligner system in the United States. The OraFit aligner system uses high-performance materials in a three-layer design for improved aesthetics, more comfortable aligners, and overall long-term oral health.
9. What pricing options are available for accessing the report?
Pricing options include single-user, multi-user, and enterprise licenses priced at USD 4750, USD 5250, and USD 8750 respectively.
10. Is the market size provided in terms of value or volume?
The market size is provided in terms of value, measured in Billion.
11. Are there any specific market keywords associated with the report?
Yes, the market keyword associated with the report is "Invisible Orthodontics Market," which aids in identifying and referencing the specific market segment covered.
12. How do I determine which pricing option suits my needs best?
The pricing options vary based on user requirements and access needs. Individual users may opt for single-user licenses, while businesses requiring broader access may choose multi-user or enterprise licenses for cost-effective access to the report.
13. Are there any additional resources or data provided in the Invisible Orthodontics Market report?
While the report offers comprehensive insights, it's advisable to review the specific contents or supplementary materials provided to ascertain if additional resources or data are available.
14. How can I stay updated on further developments or reports in the Invisible Orthodontics Market?
To stay informed about further developments, trends, and reports in the Invisible Orthodontics Market, consider subscribing to industry newsletters, following relevant companies and organizations, or regularly checking reputable industry news sources and publications.
Methodology
Step 1 - Identification of Relevant Samples Size from Population Database


Step 2 - Approaches for Defining Global Market Size (Value, Volume* & Price*)

Note*: In applicable scenarios
Step 3 - Data Sources
Primary Research
- Web Analytics
- Survey Reports
- Research Institute
- Latest Research Reports
- Opinion Leaders
Secondary Research
- Annual Reports
- White Paper
- Latest Press Release
- Industry Association
- Paid Database
- Investor Presentations

Step 4 - Data Triangulation
Involves using different sources of information in order to increase the validity of a study
These sources are likely to be stakeholders in a program - participants, other researchers, program staff, other community members, and so on.
Then we put all data in single framework & apply various statistical tools to find out the dynamic on the market.
During the analysis stage, feedback from the stakeholder groups would be compared to determine areas of agreement as well as areas of divergence


