
Key Insights
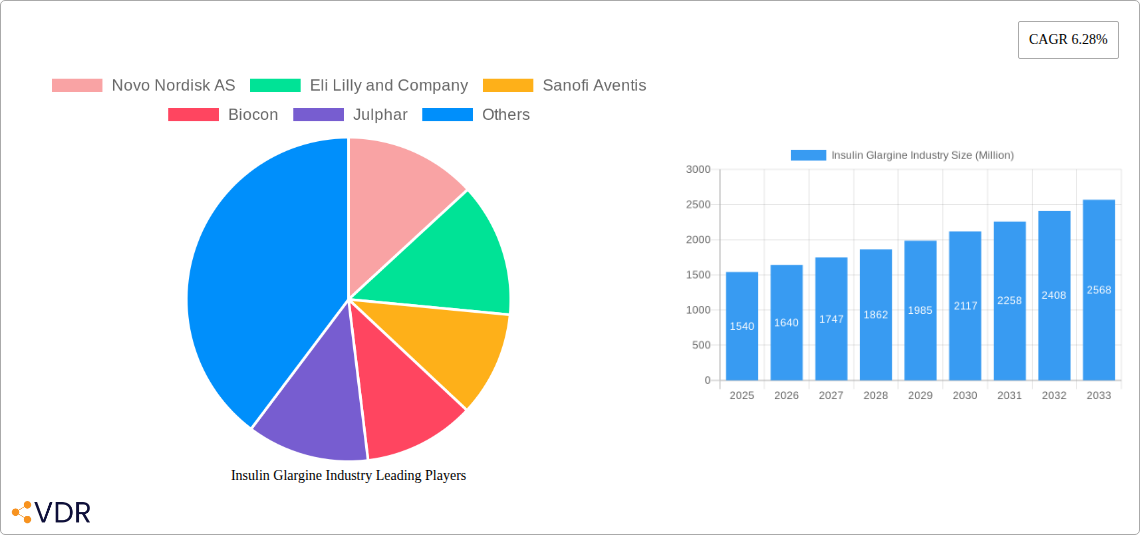
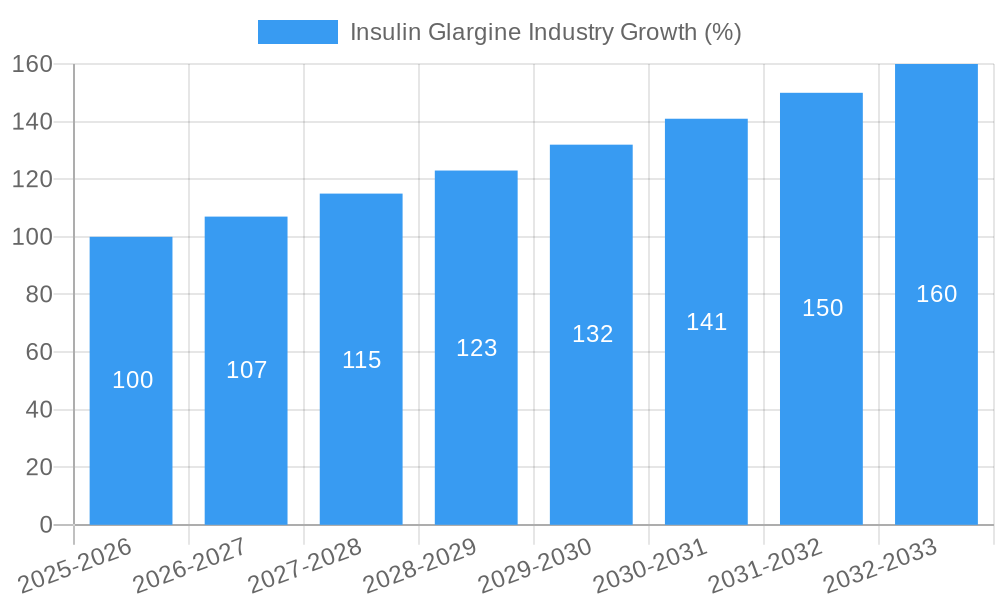
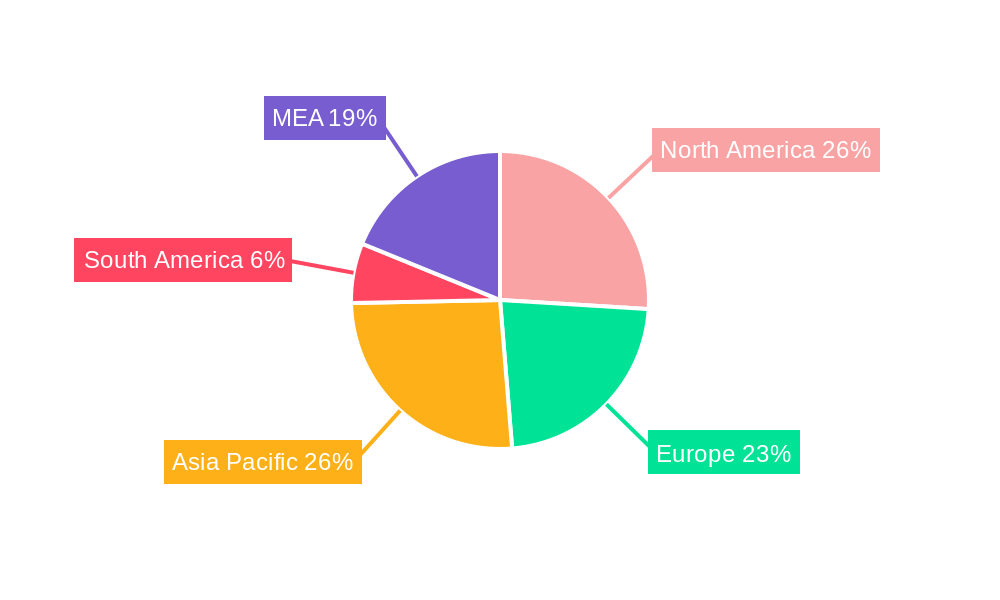
The global Insulin Glargine market, valued at $1.54 billion in 2025, is projected to experience robust growth, driven by a rising prevalence of type 2 diabetes, an aging global population, and increasing awareness of effective diabetes management. The market's Compound Annual Growth Rate (CAGR) of 6.28% from 2025 to 2033 indicates a substantial expansion, with significant opportunities for key players like Novo Nordisk, Eli Lilly and Company, and Sanofi Aventis. The increasing adoption of insulin glargine biosimilars is expected to fuel competition and potentially drive down prices, benefiting patients and healthcare systems. However, potential market restraints include the high cost of treatment, potential side effects, and the emergence of alternative diabetes therapies, such as GLP-1 receptor agonists. Geographical growth will be uneven, with North America and Europe expected to retain substantial market share due to established healthcare infrastructure and high diabetes prevalence. However, rapidly developing economies in Asia-Pacific, particularly China and India, represent promising growth regions with expanding diabetes populations and increasing access to advanced medical care. The market segmentation reveals a diverse landscape, with brand-name products like Lantus, Basaglar, and Toujeo competing with the growing biosimilar segment, which is expected to gain significant market traction over the forecast period. Strategic partnerships, research and development focusing on improved formulations and delivery systems, and expanding access to affordable insulin glargine in underserved markets will be crucial for sustained market growth.
Further market expansion will be influenced by the introduction of innovative insulin glargine delivery systems, improved patient adherence programs, and the ongoing efforts to address healthcare disparities in access to diabetes management. The competitive landscape will continue to evolve as biosimilar manufacturers seek to expand their market presence. Regulatory approvals and pricing strategies will play a significant role in shaping the market dynamics over the coming years. Effective diabetes management education initiatives are crucial for increasing patient awareness and optimizing treatment outcomes, further supporting market growth. The long-term outlook for the insulin glargine market remains positive, though sustained growth will require a multi-pronged approach addressing both market challenges and opportunities.
Insulin Glargine Industry Market Report: 2019-2033
This comprehensive report provides an in-depth analysis of the Insulin Glargine industry, encompassing market dynamics, growth trends, competitive landscape, and future outlook. The study period covers 2019-2033, with a base year of 2025 and a forecast period of 2025-2033. This report is crucial for industry professionals, investors, and strategic decision-makers seeking a thorough understanding of this vital pharmaceutical sector. The report analyzes the parent market of insulin therapy and the child market of long-acting insulin analogues, specifically focusing on Insulin Glargine. Value figures are presented in Million Units.
Insulin Glargine Industry Market Dynamics & Structure
The insulin glargine market is characterized by a high degree of concentration, with a few major players holding significant market share. Technological innovation, particularly in biosimilar development and novel delivery systems, is a key driver. Stringent regulatory frameworks and approvals processes significantly impact market entry and competition. The market faces competition from other insulin types and glucose-lowering agents. The end-user demographics are primarily adults with type 1 and type 2 diabetes, with a growing aging population influencing demand. Mergers and acquisitions (M&A) are frequent, reflecting strategic consolidation and expansion efforts within the industry.
- Market Concentration: High, with Novo Nordisk, Eli Lilly, and Sanofi holding the largest shares (xx%, xx%, xx% respectively, 2024 estimate).
- Technological Innovation: Focus on improved delivery systems (e.g., once-weekly formulations), biosimilar development, and personalized medicine approaches.
- Regulatory Landscape: Stringent regulatory pathways and biosimilar approvals influence market dynamics.
- Competitive Substitutes: Other insulin types (e.g., insulin degludec, rapid-acting insulins), oral anti-diabetic drugs, and GLP-1 receptor agonists.
- End-User Demographics: Primarily adults with type 1 and type 2 diabetes; aging population drives increasing demand.
- M&A Activity: Significant M&A activity in recent years (e.g., Biocon’s acquisition of Viatris Biosimilars in March 2022), driving consolidation and market share shifts. Total M&A deal value for 2019-2024 estimated at xx Million Units.
Insulin Glargine Industry Growth Trends & Insights
The global insulin glargine market has experienced steady growth over the historical period (2019-2024), driven by increasing diabetes prevalence and rising healthcare expenditure. Adoption rates of insulin glargine have increased, particularly in emerging markets, although penetration varies significantly across regions. Technological advancements, such as once-weekly formulations, have further fueled market expansion. Consumer behavior shifts towards improved disease management and patient preference for convenient delivery systems are also significant factors. The market is expected to continue its growth trajectory during the forecast period (2025-2033), exhibiting a Compound Annual Growth Rate (CAGR) of xx% from 2025 to 2033. Market penetration is expected to rise from xx% in 2024 to xx% in 2033 (Global estimate). The rising prevalence of diabetes, particularly in developing countries, is a key driver.
Dominant Regions, Countries, or Segments in Insulin Glargine Industry
The North American and European markets currently dominate the insulin glargine market, driven by high diabetes prevalence, robust healthcare infrastructure, and high per capita healthcare spending. However, emerging markets in Asia-Pacific and Latin America show strong growth potential due to increasing diabetes prevalence and growing healthcare access.
- North America: High market share due to high diabetes prevalence and advanced healthcare infrastructure. Strong demand for both brand-name and biosimilar products.
- Europe: Significant market size driven by established healthcare systems and high diabetes prevalence.
- Asia-Pacific: Rapidly expanding market driven by rising diabetes prevalence, particularly in India and China.
- Segments: Lantus retains significant market share; however, the increasing adoption of biosimilars like Basaglar is impacting the market dynamics. The introduction of once-weekly formulations offers new growth opportunities.
Insulin Glargine Industry Product Landscape
The insulin glargine market features a range of products, including originator brands (e.g., Lantus) and biosimilars (e.g., Basaglar). These products vary in terms of formulation (e.g., U100, U300), delivery systems (e.g., pre-filled pens, cartridges), and cost. Key product differentiators include efficacy, safety profiles, convenience of use, and cost-effectiveness. Technological advancements focus on improved delivery mechanisms, such as once-weekly injections, and combination products.
Key Drivers, Barriers & Challenges in Insulin Glargine Industry
Key Drivers:
- Rising prevalence of diabetes globally.
- Growing awareness of diabetes management.
- Technological advancements in insulin delivery systems.
- Increasing healthcare expenditure.
Key Challenges:
- Intense competition from biosimilars impacting pricing. (Estimated price erosion xx% by 2033)
- Stringent regulatory requirements for new product approvals.
- Supply chain vulnerabilities, particularly concerning raw materials.
- Patent expirations impacting originator drug sales.
Emerging Opportunities in Insulin Glargine Industry
- Expanding market penetration in developing countries.
- Development of novel delivery systems (e.g., inhaled insulin).
- Growing demand for personalized medicine approaches.
- Exploration of combination therapies with other diabetes medications.
Growth Accelerators in the Insulin Glargine Industry Industry
The insulin glargine market is poised for sustained growth, driven by technological advancements, strategic collaborations, and expansion into untapped markets. Innovative delivery systems, such as once-weekly options, are simplifying treatment regimens and improving patient adherence. Strategic partnerships between pharmaceutical companies and healthcare providers are enhancing access to insulin glargine in underserved populations. Expanding into emerging markets with high diabetes prevalence, offers substantial growth opportunities.
Key Players Shaping the Insulin Glargine Industry Market
- Novo Nordisk AS
- Eli Lilly and Company
- Sanofi Aventis
- Biocon
- Julphar
Notable Milestones in Insulin Glargine Industry Sector
- October 2022: Novo Nordisk announced positive results from the ONWARDS 5 trial for once-weekly insulin icodec, potentially disrupting the once-daily basal insulin market.
- March 2022: Biocon’s acquisition of Viatris Biosimilars strengthened its position in the biosimilars market, increasing competition.
In-Depth Insulin Glargine Industry Market Outlook
The insulin glargine market is projected to experience robust growth throughout the forecast period, driven by an aging population, rising diabetes prevalence, and advancements in product innovation. Companies are focusing on developing more convenient and effective delivery systems, as well as expanding their presence in emerging markets. Strategic partnerships and M&A activities will continue shaping the competitive landscape, creating opportunities for both established players and new entrants. The market’s future potential is strong, presenting lucrative opportunities for those who can effectively navigate the regulatory and competitive challenges.
Insulin Glargine Industry Segmentation
-
1. Type
- 1.1. Lantus
- 1.2. Basaglar
- 1.3. Toujeo
- 1.4. Soliqua/Suliqua
- 1.5. Insulin Glargine Biosimilars
-
2. Application
- 2.1. Type 1 Diabetes
- 2.2. Type 2 Diabetes
-
3. End User
- 3.1. Hospitals
- 3.2. Clinics
- 3.3. Pharmacies
- 3.4. Home Healthcare
Insulin Glargine Industry Segmentation By Geography
-
1. North America
- 1.1. United States
- 1.2. Canada
- 1.3. Rest of North America
-
2. Europe
- 2.1. France
- 2.2. Germany
- 2.3. Italy
- 2.4. Spain
- 2.5. United Kingdom
- 2.6. Russia
- 2.7. Rest of Europe
-
3. Latin America
- 3.1. Mexico
- 3.2. Brazil
- 3.3. Rest of Latin America
-
4. Asia Pacific
- 4.1. Japan
- 4.2. South Korea
- 4.3. China
- 4.4. India
- 4.5. Australia
- 4.6. Vietnam
- 4.7. Malaysia
- 4.8. Indonesia
- 4.9. Philippines
- 4.10. Thailand
- 4.11. Rest of Asia Pacific
-
5. Middle East and Africa
- 5.1. Saudi Arabia
- 5.2. Iran
- 5.3. Egypt
- 5.4. Oman
- 5.5. South Africa
- 5.6. Rest of Middle East and Africa
Insulin Glargine Industry REPORT HIGHLIGHTS
| Aspects | Details |
|---|---|
| Study Period | 2019-2033 |
| Base Year | 2024 |
| Estimated Year | 2025 |
| Forecast Period | 2025-2033 |
| Historical Period | 2019-2024 |
| Growth Rate | CAGR of 6.28% from 2019-2033 |
| Segmentation |
|
Table of Contents
- 1. Introduction
- 1.1. Research Scope
- 1.2. Market Segmentation
- 1.3. Research Methodology
- 1.4. Definitions and Assumptions
- 2. Executive Summary
- 2.1. Introduction
- 3. Market Dynamics
- 3.1. Introduction
- 3.2. Market Drivers
- 3.2.1. ; The Rise in Global Prevalence of Cases of Obesity due to Modern Sedentary Lifestyles; Rise in Awareness and Disposable Income in Developed Economies
- 3.3. Market Restrains
- 3.3.1 ; Highly Cost of Branded Products in Emerging Countries; Severe Adverse Associated with Medication Including Seizures
- 3.3.2 Suicidal Attempts and Even Death; Adoption of Traditional Yoga and Herbal Products
- 3.4. Market Trends
- 3.4.1. Insulin Glargine Market Access has Widened
- 4. Market Factor Analysis
- 4.1. Porters Five Forces
- 4.2. Supply/Value Chain
- 4.3. PESTEL analysis
- 4.4. Market Entropy
- 4.5. Patent/Trademark Analysis
- 5. Global Insulin Glargine Industry Analysis, Insights and Forecast, 2019-2031
- 5.1. Market Analysis, Insights and Forecast - by Type
- 5.1.1. Lantus
- 5.1.2. Basaglar
- 5.1.3. Toujeo
- 5.1.4. Soliqua/Suliqua
- 5.1.5. Insulin Glargine Biosimilars
- 5.2. Market Analysis, Insights and Forecast - by Application
- 5.2.1. Type 1 Diabetes
- 5.2.2. Type 2 Diabetes
- 5.3. Market Analysis, Insights and Forecast - by End User
- 5.3.1. Hospitals
- 5.3.2. Clinics
- 5.3.3. Pharmacies
- 5.3.4. Home Healthcare
- 5.4. Market Analysis, Insights and Forecast - by Region
- 5.4.1. North America
- 5.4.2. Europe
- 5.4.3. Latin America
- 5.4.4. Asia Pacific
- 5.4.5. Middle East and Africa
- 5.1. Market Analysis, Insights and Forecast - by Type
- 6. North America Insulin Glargine Industry Analysis, Insights and Forecast, 2019-2031
- 6.1. Market Analysis, Insights and Forecast - by Type
- 6.1.1. Lantus
- 6.1.2. Basaglar
- 6.1.3. Toujeo
- 6.1.4. Soliqua/Suliqua
- 6.1.5. Insulin Glargine Biosimilars
- 6.2. Market Analysis, Insights and Forecast - by Application
- 6.2.1. Type 1 Diabetes
- 6.2.2. Type 2 Diabetes
- 6.3. Market Analysis, Insights and Forecast - by End User
- 6.3.1. Hospitals
- 6.3.2. Clinics
- 6.3.3. Pharmacies
- 6.3.4. Home Healthcare
- 6.1. Market Analysis, Insights and Forecast - by Type
- 7. Europe Insulin Glargine Industry Analysis, Insights and Forecast, 2019-2031
- 7.1. Market Analysis, Insights and Forecast - by Type
- 7.1.1. Lantus
- 7.1.2. Basaglar
- 7.1.3. Toujeo
- 7.1.4. Soliqua/Suliqua
- 7.1.5. Insulin Glargine Biosimilars
- 7.2. Market Analysis, Insights and Forecast - by Application
- 7.2.1. Type 1 Diabetes
- 7.2.2. Type 2 Diabetes
- 7.3. Market Analysis, Insights and Forecast - by End User
- 7.3.1. Hospitals
- 7.3.2. Clinics
- 7.3.3. Pharmacies
- 7.3.4. Home Healthcare
- 7.1. Market Analysis, Insights and Forecast - by Type
- 8. Latin America Insulin Glargine Industry Analysis, Insights and Forecast, 2019-2031
- 8.1. Market Analysis, Insights and Forecast - by Type
- 8.1.1. Lantus
- 8.1.2. Basaglar
- 8.1.3. Toujeo
- 8.1.4. Soliqua/Suliqua
- 8.1.5. Insulin Glargine Biosimilars
- 8.2. Market Analysis, Insights and Forecast - by Application
- 8.2.1. Type 1 Diabetes
- 8.2.2. Type 2 Diabetes
- 8.3. Market Analysis, Insights and Forecast - by End User
- 8.3.1. Hospitals
- 8.3.2. Clinics
- 8.3.3. Pharmacies
- 8.3.4. Home Healthcare
- 8.1. Market Analysis, Insights and Forecast - by Type
- 9. Asia Pacific Insulin Glargine Industry Analysis, Insights and Forecast, 2019-2031
- 9.1. Market Analysis, Insights and Forecast - by Type
- 9.1.1. Lantus
- 9.1.2. Basaglar
- 9.1.3. Toujeo
- 9.1.4. Soliqua/Suliqua
- 9.1.5. Insulin Glargine Biosimilars
- 9.2. Market Analysis, Insights and Forecast - by Application
- 9.2.1. Type 1 Diabetes
- 9.2.2. Type 2 Diabetes
- 9.3. Market Analysis, Insights and Forecast - by End User
- 9.3.1. Hospitals
- 9.3.2. Clinics
- 9.3.3. Pharmacies
- 9.3.4. Home Healthcare
- 9.1. Market Analysis, Insights and Forecast - by Type
- 10. Middle East and Africa Insulin Glargine Industry Analysis, Insights and Forecast, 2019-2031
- 10.1. Market Analysis, Insights and Forecast - by Type
- 10.1.1. Lantus
- 10.1.2. Basaglar
- 10.1.3. Toujeo
- 10.1.4. Soliqua/Suliqua
- 10.1.5. Insulin Glargine Biosimilars
- 10.2. Market Analysis, Insights and Forecast - by Application
- 10.2.1. Type 1 Diabetes
- 10.2.2. Type 2 Diabetes
- 10.3. Market Analysis, Insights and Forecast - by End User
- 10.3.1. Hospitals
- 10.3.2. Clinics
- 10.3.3. Pharmacies
- 10.3.4. Home Healthcare
- 10.1. Market Analysis, Insights and Forecast - by Type
- 11. North America Insulin Glargine Industry Analysis, Insights and Forecast, 2019-2031
- 11.1. Market Analysis, Insights and Forecast - By Country/Sub-region
- 11.1.1 United States
- 11.1.2 Canada
- 11.1.3 Mexico
- 12. Europe Insulin Glargine Industry Analysis, Insights and Forecast, 2019-2031
- 12.1. Market Analysis, Insights and Forecast - By Country/Sub-region
- 12.1.1 Germany
- 12.1.2 United Kingdom
- 12.1.3 France
- 12.1.4 Spain
- 12.1.5 Italy
- 12.1.6 Spain
- 12.1.7 Belgium
- 12.1.8 Netherland
- 12.1.9 Nordics
- 12.1.10 Rest of Europe
- 13. Asia Pacific Insulin Glargine Industry Analysis, Insights and Forecast, 2019-2031
- 13.1. Market Analysis, Insights and Forecast - By Country/Sub-region
- 13.1.1 China
- 13.1.2 Japan
- 13.1.3 India
- 13.1.4 South Korea
- 13.1.5 Southeast Asia
- 13.1.6 Australia
- 13.1.7 Indonesia
- 13.1.8 Phillipes
- 13.1.9 Singapore
- 13.1.10 Thailandc
- 13.1.11 Rest of Asia Pacific
- 14. South America Insulin Glargine Industry Analysis, Insights and Forecast, 2019-2031
- 14.1. Market Analysis, Insights and Forecast - By Country/Sub-region
- 14.1.1 Brazil
- 14.1.2 Argentina
- 14.1.3 Peru
- 14.1.4 Chile
- 14.1.5 Colombia
- 14.1.6 Ecuador
- 14.1.7 Venezuela
- 14.1.8 Rest of South America
- 15. North America Insulin Glargine Industry Analysis, Insights and Forecast, 2019-2031
- 15.1. Market Analysis, Insights and Forecast - By Country/Sub-region
- 15.1.1 United States
- 15.1.2 Canada
- 15.1.3 Mexico
- 16. MEA Insulin Glargine Industry Analysis, Insights and Forecast, 2019-2031
- 16.1. Market Analysis, Insights and Forecast - By Country/Sub-region
- 16.1.1 United Arab Emirates
- 16.1.2 Saudi Arabia
- 16.1.3 South Africa
- 16.1.4 Rest of Middle East and Africa
- 17. Competitive Analysis
- 17.1. Global Market Share Analysis 2024
- 17.2. Company Profiles
- 17.2.1 Novo Nordisk AS
- 17.2.1.1. Overview
- 17.2.1.2. Products
- 17.2.1.3. SWOT Analysis
- 17.2.1.4. Recent Developments
- 17.2.1.5. Financials (Based on Availability)
- 17.2.2 Eli Lilly and Company
- 17.2.2.1. Overview
- 17.2.2.2. Products
- 17.2.2.3. SWOT Analysis
- 17.2.2.4. Recent Developments
- 17.2.2.5. Financials (Based on Availability)
- 17.2.3 Sanofi Aventis
- 17.2.3.1. Overview
- 17.2.3.2. Products
- 17.2.3.3. SWOT Analysis
- 17.2.3.4. Recent Developments
- 17.2.3.5. Financials (Based on Availability)
- 17.2.4 Biocon
- 17.2.4.1. Overview
- 17.2.4.2. Products
- 17.2.4.3. SWOT Analysis
- 17.2.4.4. Recent Developments
- 17.2.4.5. Financials (Based on Availability)
- 17.2.5 Julphar
- 17.2.5.1. Overview
- 17.2.5.2. Products
- 17.2.5.3. SWOT Analysis
- 17.2.5.4. Recent Developments
- 17.2.5.5. Financials (Based on Availability)
- 17.2.1 Novo Nordisk AS
List of Figures
- Figure 1: Global Insulin Glargine Industry Revenue Breakdown (Million, %) by Region 2024 & 2032
- Figure 2: Global Insulin Glargine Industry Volume Breakdown (K Unit, %) by Region 2024 & 2032
- Figure 3: North America Insulin Glargine Industry Revenue (Million), by Country 2024 & 2032
- Figure 4: North America Insulin Glargine Industry Volume (K Unit), by Country 2024 & 2032
- Figure 5: North America Insulin Glargine Industry Revenue Share (%), by Country 2024 & 2032
- Figure 6: North America Insulin Glargine Industry Volume Share (%), by Country 2024 & 2032
- Figure 7: Europe Insulin Glargine Industry Revenue (Million), by Country 2024 & 2032
- Figure 8: Europe Insulin Glargine Industry Volume (K Unit), by Country 2024 & 2032
- Figure 9: Europe Insulin Glargine Industry Revenue Share (%), by Country 2024 & 2032
- Figure 10: Europe Insulin Glargine Industry Volume Share (%), by Country 2024 & 2032
- Figure 11: Asia Pacific Insulin Glargine Industry Revenue (Million), by Country 2024 & 2032
- Figure 12: Asia Pacific Insulin Glargine Industry Volume (K Unit), by Country 2024 & 2032
- Figure 13: Asia Pacific Insulin Glargine Industry Revenue Share (%), by Country 2024 & 2032
- Figure 14: Asia Pacific Insulin Glargine Industry Volume Share (%), by Country 2024 & 2032
- Figure 15: South America Insulin Glargine Industry Revenue (Million), by Country 2024 & 2032
- Figure 16: South America Insulin Glargine Industry Volume (K Unit), by Country 2024 & 2032
- Figure 17: South America Insulin Glargine Industry Revenue Share (%), by Country 2024 & 2032
- Figure 18: South America Insulin Glargine Industry Volume Share (%), by Country 2024 & 2032
- Figure 19: North America Insulin Glargine Industry Revenue (Million), by Country 2024 & 2032
- Figure 20: North America Insulin Glargine Industry Volume (K Unit), by Country 2024 & 2032
- Figure 21: North America Insulin Glargine Industry Revenue Share (%), by Country 2024 & 2032
- Figure 22: North America Insulin Glargine Industry Volume Share (%), by Country 2024 & 2032
- Figure 23: MEA Insulin Glargine Industry Revenue (Million), by Country 2024 & 2032
- Figure 24: MEA Insulin Glargine Industry Volume (K Unit), by Country 2024 & 2032
- Figure 25: MEA Insulin Glargine Industry Revenue Share (%), by Country 2024 & 2032
- Figure 26: MEA Insulin Glargine Industry Volume Share (%), by Country 2024 & 2032
- Figure 27: North America Insulin Glargine Industry Revenue (Million), by Type 2024 & 2032
- Figure 28: North America Insulin Glargine Industry Volume (K Unit), by Type 2024 & 2032
- Figure 29: North America Insulin Glargine Industry Revenue Share (%), by Type 2024 & 2032
- Figure 30: North America Insulin Glargine Industry Volume Share (%), by Type 2024 & 2032
- Figure 31: North America Insulin Glargine Industry Revenue (Million), by Application 2024 & 2032
- Figure 32: North America Insulin Glargine Industry Volume (K Unit), by Application 2024 & 2032
- Figure 33: North America Insulin Glargine Industry Revenue Share (%), by Application 2024 & 2032
- Figure 34: North America Insulin Glargine Industry Volume Share (%), by Application 2024 & 2032
- Figure 35: North America Insulin Glargine Industry Revenue (Million), by End User 2024 & 2032
- Figure 36: North America Insulin Glargine Industry Volume (K Unit), by End User 2024 & 2032
- Figure 37: North America Insulin Glargine Industry Revenue Share (%), by End User 2024 & 2032
- Figure 38: North America Insulin Glargine Industry Volume Share (%), by End User 2024 & 2032
- Figure 39: North America Insulin Glargine Industry Revenue (Million), by Country 2024 & 2032
- Figure 40: North America Insulin Glargine Industry Volume (K Unit), by Country 2024 & 2032
- Figure 41: North America Insulin Glargine Industry Revenue Share (%), by Country 2024 & 2032
- Figure 42: North America Insulin Glargine Industry Volume Share (%), by Country 2024 & 2032
- Figure 43: Europe Insulin Glargine Industry Revenue (Million), by Type 2024 & 2032
- Figure 44: Europe Insulin Glargine Industry Volume (K Unit), by Type 2024 & 2032
- Figure 45: Europe Insulin Glargine Industry Revenue Share (%), by Type 2024 & 2032
- Figure 46: Europe Insulin Glargine Industry Volume Share (%), by Type 2024 & 2032
- Figure 47: Europe Insulin Glargine Industry Revenue (Million), by Application 2024 & 2032
- Figure 48: Europe Insulin Glargine Industry Volume (K Unit), by Application 2024 & 2032
- Figure 49: Europe Insulin Glargine Industry Revenue Share (%), by Application 2024 & 2032
- Figure 50: Europe Insulin Glargine Industry Volume Share (%), by Application 2024 & 2032
- Figure 51: Europe Insulin Glargine Industry Revenue (Million), by End User 2024 & 2032
- Figure 52: Europe Insulin Glargine Industry Volume (K Unit), by End User 2024 & 2032
- Figure 53: Europe Insulin Glargine Industry Revenue Share (%), by End User 2024 & 2032
- Figure 54: Europe Insulin Glargine Industry Volume Share (%), by End User 2024 & 2032
- Figure 55: Europe Insulin Glargine Industry Revenue (Million), by Country 2024 & 2032
- Figure 56: Europe Insulin Glargine Industry Volume (K Unit), by Country 2024 & 2032
- Figure 57: Europe Insulin Glargine Industry Revenue Share (%), by Country 2024 & 2032
- Figure 58: Europe Insulin Glargine Industry Volume Share (%), by Country 2024 & 2032
- Figure 59: Latin America Insulin Glargine Industry Revenue (Million), by Type 2024 & 2032
- Figure 60: Latin America Insulin Glargine Industry Volume (K Unit), by Type 2024 & 2032
- Figure 61: Latin America Insulin Glargine Industry Revenue Share (%), by Type 2024 & 2032
- Figure 62: Latin America Insulin Glargine Industry Volume Share (%), by Type 2024 & 2032
- Figure 63: Latin America Insulin Glargine Industry Revenue (Million), by Application 2024 & 2032
- Figure 64: Latin America Insulin Glargine Industry Volume (K Unit), by Application 2024 & 2032
- Figure 65: Latin America Insulin Glargine Industry Revenue Share (%), by Application 2024 & 2032
- Figure 66: Latin America Insulin Glargine Industry Volume Share (%), by Application 2024 & 2032
- Figure 67: Latin America Insulin Glargine Industry Revenue (Million), by End User 2024 & 2032
- Figure 68: Latin America Insulin Glargine Industry Volume (K Unit), by End User 2024 & 2032
- Figure 69: Latin America Insulin Glargine Industry Revenue Share (%), by End User 2024 & 2032
- Figure 70: Latin America Insulin Glargine Industry Volume Share (%), by End User 2024 & 2032
- Figure 71: Latin America Insulin Glargine Industry Revenue (Million), by Country 2024 & 2032
- Figure 72: Latin America Insulin Glargine Industry Volume (K Unit), by Country 2024 & 2032
- Figure 73: Latin America Insulin Glargine Industry Revenue Share (%), by Country 2024 & 2032
- Figure 74: Latin America Insulin Glargine Industry Volume Share (%), by Country 2024 & 2032
- Figure 75: Asia Pacific Insulin Glargine Industry Revenue (Million), by Type 2024 & 2032
- Figure 76: Asia Pacific Insulin Glargine Industry Volume (K Unit), by Type 2024 & 2032
- Figure 77: Asia Pacific Insulin Glargine Industry Revenue Share (%), by Type 2024 & 2032
- Figure 78: Asia Pacific Insulin Glargine Industry Volume Share (%), by Type 2024 & 2032
- Figure 79: Asia Pacific Insulin Glargine Industry Revenue (Million), by Application 2024 & 2032
- Figure 80: Asia Pacific Insulin Glargine Industry Volume (K Unit), by Application 2024 & 2032
- Figure 81: Asia Pacific Insulin Glargine Industry Revenue Share (%), by Application 2024 & 2032
- Figure 82: Asia Pacific Insulin Glargine Industry Volume Share (%), by Application 2024 & 2032
- Figure 83: Asia Pacific Insulin Glargine Industry Revenue (Million), by End User 2024 & 2032
- Figure 84: Asia Pacific Insulin Glargine Industry Volume (K Unit), by End User 2024 & 2032
- Figure 85: Asia Pacific Insulin Glargine Industry Revenue Share (%), by End User 2024 & 2032
- Figure 86: Asia Pacific Insulin Glargine Industry Volume Share (%), by End User 2024 & 2032
- Figure 87: Asia Pacific Insulin Glargine Industry Revenue (Million), by Country 2024 & 2032
- Figure 88: Asia Pacific Insulin Glargine Industry Volume (K Unit), by Country 2024 & 2032
- Figure 89: Asia Pacific Insulin Glargine Industry Revenue Share (%), by Country 2024 & 2032
- Figure 90: Asia Pacific Insulin Glargine Industry Volume Share (%), by Country 2024 & 2032
- Figure 91: Middle East and Africa Insulin Glargine Industry Revenue (Million), by Type 2024 & 2032
- Figure 92: Middle East and Africa Insulin Glargine Industry Volume (K Unit), by Type 2024 & 2032
- Figure 93: Middle East and Africa Insulin Glargine Industry Revenue Share (%), by Type 2024 & 2032
- Figure 94: Middle East and Africa Insulin Glargine Industry Volume Share (%), by Type 2024 & 2032
- Figure 95: Middle East and Africa Insulin Glargine Industry Revenue (Million), by Application 2024 & 2032
- Figure 96: Middle East and Africa Insulin Glargine Industry Volume (K Unit), by Application 2024 & 2032
- Figure 97: Middle East and Africa Insulin Glargine Industry Revenue Share (%), by Application 2024 & 2032
- Figure 98: Middle East and Africa Insulin Glargine Industry Volume Share (%), by Application 2024 & 2032
- Figure 99: Middle East and Africa Insulin Glargine Industry Revenue (Million), by End User 2024 & 2032
- Figure 100: Middle East and Africa Insulin Glargine Industry Volume (K Unit), by End User 2024 & 2032
- Figure 101: Middle East and Africa Insulin Glargine Industry Revenue Share (%), by End User 2024 & 2032
- Figure 102: Middle East and Africa Insulin Glargine Industry Volume Share (%), by End User 2024 & 2032
- Figure 103: Middle East and Africa Insulin Glargine Industry Revenue (Million), by Country 2024 & 2032
- Figure 104: Middle East and Africa Insulin Glargine Industry Volume (K Unit), by Country 2024 & 2032
- Figure 105: Middle East and Africa Insulin Glargine Industry Revenue Share (%), by Country 2024 & 2032
- Figure 106: Middle East and Africa Insulin Glargine Industry Volume Share (%), by Country 2024 & 2032
List of Tables
- Table 1: Global Insulin Glargine Industry Revenue Million Forecast, by Region 2019 & 2032
- Table 2: Global Insulin Glargine Industry Volume K Unit Forecast, by Region 2019 & 2032
- Table 3: Global Insulin Glargine Industry Revenue Million Forecast, by Type 2019 & 2032
- Table 4: Global Insulin Glargine Industry Volume K Unit Forecast, by Type 2019 & 2032
- Table 5: Global Insulin Glargine Industry Revenue Million Forecast, by Application 2019 & 2032
- Table 6: Global Insulin Glargine Industry Volume K Unit Forecast, by Application 2019 & 2032
- Table 7: Global Insulin Glargine Industry Revenue Million Forecast, by End User 2019 & 2032
- Table 8: Global Insulin Glargine Industry Volume K Unit Forecast, by End User 2019 & 2032
- Table 9: Global Insulin Glargine Industry Revenue Million Forecast, by Region 2019 & 2032
- Table 10: Global Insulin Glargine Industry Volume K Unit Forecast, by Region 2019 & 2032
- Table 11: Global Insulin Glargine Industry Revenue Million Forecast, by Country 2019 & 2032
- Table 12: Global Insulin Glargine Industry Volume K Unit Forecast, by Country 2019 & 2032
- Table 13: United States Insulin Glargine Industry Revenue (Million) Forecast, by Application 2019 & 2032
- Table 14: United States Insulin Glargine Industry Volume (K Unit) Forecast, by Application 2019 & 2032
- Table 15: Canada Insulin Glargine Industry Revenue (Million) Forecast, by Application 2019 & 2032
- Table 16: Canada Insulin Glargine Industry Volume (K Unit) Forecast, by Application 2019 & 2032
- Table 17: Mexico Insulin Glargine Industry Revenue (Million) Forecast, by Application 2019 & 2032
- Table 18: Mexico Insulin Glargine Industry Volume (K Unit) Forecast, by Application 2019 & 2032
- Table 19: Global Insulin Glargine Industry Revenue Million Forecast, by Country 2019 & 2032
- Table 20: Global Insulin Glargine Industry Volume K Unit Forecast, by Country 2019 & 2032
- Table 21: Germany Insulin Glargine Industry Revenue (Million) Forecast, by Application 2019 & 2032
- Table 22: Germany Insulin Glargine Industry Volume (K Unit) Forecast, by Application 2019 & 2032
- Table 23: United Kingdom Insulin Glargine Industry Revenue (Million) Forecast, by Application 2019 & 2032
- Table 24: United Kingdom Insulin Glargine Industry Volume (K Unit) Forecast, by Application 2019 & 2032
- Table 25: France Insulin Glargine Industry Revenue (Million) Forecast, by Application 2019 & 2032
- Table 26: France Insulin Glargine Industry Volume (K Unit) Forecast, by Application 2019 & 2032
- Table 27: Spain Insulin Glargine Industry Revenue (Million) Forecast, by Application 2019 & 2032
- Table 28: Spain Insulin Glargine Industry Volume (K Unit) Forecast, by Application 2019 & 2032
- Table 29: Italy Insulin Glargine Industry Revenue (Million) Forecast, by Application 2019 & 2032
- Table 30: Italy Insulin Glargine Industry Volume (K Unit) Forecast, by Application 2019 & 2032
- Table 31: Spain Insulin Glargine Industry Revenue (Million) Forecast, by Application 2019 & 2032
- Table 32: Spain Insulin Glargine Industry Volume (K Unit) Forecast, by Application 2019 & 2032
- Table 33: Belgium Insulin Glargine Industry Revenue (Million) Forecast, by Application 2019 & 2032
- Table 34: Belgium Insulin Glargine Industry Volume (K Unit) Forecast, by Application 2019 & 2032
- Table 35: Netherland Insulin Glargine Industry Revenue (Million) Forecast, by Application 2019 & 2032
- Table 36: Netherland Insulin Glargine Industry Volume (K Unit) Forecast, by Application 2019 & 2032
- Table 37: Nordics Insulin Glargine Industry Revenue (Million) Forecast, by Application 2019 & 2032
- Table 38: Nordics Insulin Glargine Industry Volume (K Unit) Forecast, by Application 2019 & 2032
- Table 39: Rest of Europe Insulin Glargine Industry Revenue (Million) Forecast, by Application 2019 & 2032
- Table 40: Rest of Europe Insulin Glargine Industry Volume (K Unit) Forecast, by Application 2019 & 2032
- Table 41: Global Insulin Glargine Industry Revenue Million Forecast, by Country 2019 & 2032
- Table 42: Global Insulin Glargine Industry Volume K Unit Forecast, by Country 2019 & 2032
- Table 43: China Insulin Glargine Industry Revenue (Million) Forecast, by Application 2019 & 2032
- Table 44: China Insulin Glargine Industry Volume (K Unit) Forecast, by Application 2019 & 2032
- Table 45: Japan Insulin Glargine Industry Revenue (Million) Forecast, by Application 2019 & 2032
- Table 46: Japan Insulin Glargine Industry Volume (K Unit) Forecast, by Application 2019 & 2032
- Table 47: India Insulin Glargine Industry Revenue (Million) Forecast, by Application 2019 & 2032
- Table 48: India Insulin Glargine Industry Volume (K Unit) Forecast, by Application 2019 & 2032
- Table 49: South Korea Insulin Glargine Industry Revenue (Million) Forecast, by Application 2019 & 2032
- Table 50: South Korea Insulin Glargine Industry Volume (K Unit) Forecast, by Application 2019 & 2032
- Table 51: Southeast Asia Insulin Glargine Industry Revenue (Million) Forecast, by Application 2019 & 2032
- Table 52: Southeast Asia Insulin Glargine Industry Volume (K Unit) Forecast, by Application 2019 & 2032
- Table 53: Australia Insulin Glargine Industry Revenue (Million) Forecast, by Application 2019 & 2032
- Table 54: Australia Insulin Glargine Industry Volume (K Unit) Forecast, by Application 2019 & 2032
- Table 55: Indonesia Insulin Glargine Industry Revenue (Million) Forecast, by Application 2019 & 2032
- Table 56: Indonesia Insulin Glargine Industry Volume (K Unit) Forecast, by Application 2019 & 2032
- Table 57: Phillipes Insulin Glargine Industry Revenue (Million) Forecast, by Application 2019 & 2032
- Table 58: Phillipes Insulin Glargine Industry Volume (K Unit) Forecast, by Application 2019 & 2032
- Table 59: Singapore Insulin Glargine Industry Revenue (Million) Forecast, by Application 2019 & 2032
- Table 60: Singapore Insulin Glargine Industry Volume (K Unit) Forecast, by Application 2019 & 2032
- Table 61: Thailandc Insulin Glargine Industry Revenue (Million) Forecast, by Application 2019 & 2032
- Table 62: Thailandc Insulin Glargine Industry Volume (K Unit) Forecast, by Application 2019 & 2032
- Table 63: Rest of Asia Pacific Insulin Glargine Industry Revenue (Million) Forecast, by Application 2019 & 2032
- Table 64: Rest of Asia Pacific Insulin Glargine Industry Volume (K Unit) Forecast, by Application 2019 & 2032
- Table 65: Global Insulin Glargine Industry Revenue Million Forecast, by Country 2019 & 2032
- Table 66: Global Insulin Glargine Industry Volume K Unit Forecast, by Country 2019 & 2032
- Table 67: Brazil Insulin Glargine Industry Revenue (Million) Forecast, by Application 2019 & 2032
- Table 68: Brazil Insulin Glargine Industry Volume (K Unit) Forecast, by Application 2019 & 2032
- Table 69: Argentina Insulin Glargine Industry Revenue (Million) Forecast, by Application 2019 & 2032
- Table 70: Argentina Insulin Glargine Industry Volume (K Unit) Forecast, by Application 2019 & 2032
- Table 71: Peru Insulin Glargine Industry Revenue (Million) Forecast, by Application 2019 & 2032
- Table 72: Peru Insulin Glargine Industry Volume (K Unit) Forecast, by Application 2019 & 2032
- Table 73: Chile Insulin Glargine Industry Revenue (Million) Forecast, by Application 2019 & 2032
- Table 74: Chile Insulin Glargine Industry Volume (K Unit) Forecast, by Application 2019 & 2032
- Table 75: Colombia Insulin Glargine Industry Revenue (Million) Forecast, by Application 2019 & 2032
- Table 76: Colombia Insulin Glargine Industry Volume (K Unit) Forecast, by Application 2019 & 2032
- Table 77: Ecuador Insulin Glargine Industry Revenue (Million) Forecast, by Application 2019 & 2032
- Table 78: Ecuador Insulin Glargine Industry Volume (K Unit) Forecast, by Application 2019 & 2032
- Table 79: Venezuela Insulin Glargine Industry Revenue (Million) Forecast, by Application 2019 & 2032
- Table 80: Venezuela Insulin Glargine Industry Volume (K Unit) Forecast, by Application 2019 & 2032
- Table 81: Rest of South America Insulin Glargine Industry Revenue (Million) Forecast, by Application 2019 & 2032
- Table 82: Rest of South America Insulin Glargine Industry Volume (K Unit) Forecast, by Application 2019 & 2032
- Table 83: Global Insulin Glargine Industry Revenue Million Forecast, by Country 2019 & 2032
- Table 84: Global Insulin Glargine Industry Volume K Unit Forecast, by Country 2019 & 2032
- Table 85: United States Insulin Glargine Industry Revenue (Million) Forecast, by Application 2019 & 2032
- Table 86: United States Insulin Glargine Industry Volume (K Unit) Forecast, by Application 2019 & 2032
- Table 87: Canada Insulin Glargine Industry Revenue (Million) Forecast, by Application 2019 & 2032
- Table 88: Canada Insulin Glargine Industry Volume (K Unit) Forecast, by Application 2019 & 2032
- Table 89: Mexico Insulin Glargine Industry Revenue (Million) Forecast, by Application 2019 & 2032
- Table 90: Mexico Insulin Glargine Industry Volume (K Unit) Forecast, by Application 2019 & 2032
- Table 91: Global Insulin Glargine Industry Revenue Million Forecast, by Country 2019 & 2032
- Table 92: Global Insulin Glargine Industry Volume K Unit Forecast, by Country 2019 & 2032
- Table 93: United Arab Emirates Insulin Glargine Industry Revenue (Million) Forecast, by Application 2019 & 2032
- Table 94: United Arab Emirates Insulin Glargine Industry Volume (K Unit) Forecast, by Application 2019 & 2032
- Table 95: Saudi Arabia Insulin Glargine Industry Revenue (Million) Forecast, by Application 2019 & 2032
- Table 96: Saudi Arabia Insulin Glargine Industry Volume (K Unit) Forecast, by Application 2019 & 2032
- Table 97: South Africa Insulin Glargine Industry Revenue (Million) Forecast, by Application 2019 & 2032
- Table 98: South Africa Insulin Glargine Industry Volume (K Unit) Forecast, by Application 2019 & 2032
- Table 99: Rest of Middle East and Africa Insulin Glargine Industry Revenue (Million) Forecast, by Application 2019 & 2032
- Table 100: Rest of Middle East and Africa Insulin Glargine Industry Volume (K Unit) Forecast, by Application 2019 & 2032
- Table 101: Global Insulin Glargine Industry Revenue Million Forecast, by Type 2019 & 2032
- Table 102: Global Insulin Glargine Industry Volume K Unit Forecast, by Type 2019 & 2032
- Table 103: Global Insulin Glargine Industry Revenue Million Forecast, by Application 2019 & 2032
- Table 104: Global Insulin Glargine Industry Volume K Unit Forecast, by Application 2019 & 2032
- Table 105: Global Insulin Glargine Industry Revenue Million Forecast, by End User 2019 & 2032
- Table 106: Global Insulin Glargine Industry Volume K Unit Forecast, by End User 2019 & 2032
- Table 107: Global Insulin Glargine Industry Revenue Million Forecast, by Country 2019 & 2032
- Table 108: Global Insulin Glargine Industry Volume K Unit Forecast, by Country 2019 & 2032
- Table 109: United States Insulin Glargine Industry Revenue (Million) Forecast, by Application 2019 & 2032
- Table 110: United States Insulin Glargine Industry Volume (K Unit) Forecast, by Application 2019 & 2032
- Table 111: Canada Insulin Glargine Industry Revenue (Million) Forecast, by Application 2019 & 2032
- Table 112: Canada Insulin Glargine Industry Volume (K Unit) Forecast, by Application 2019 & 2032
- Table 113: Rest of North America Insulin Glargine Industry Revenue (Million) Forecast, by Application 2019 & 2032
- Table 114: Rest of North America Insulin Glargine Industry Volume (K Unit) Forecast, by Application 2019 & 2032
- Table 115: Global Insulin Glargine Industry Revenue Million Forecast, by Type 2019 & 2032
- Table 116: Global Insulin Glargine Industry Volume K Unit Forecast, by Type 2019 & 2032
- Table 117: Global Insulin Glargine Industry Revenue Million Forecast, by Application 2019 & 2032
- Table 118: Global Insulin Glargine Industry Volume K Unit Forecast, by Application 2019 & 2032
- Table 119: Global Insulin Glargine Industry Revenue Million Forecast, by End User 2019 & 2032
- Table 120: Global Insulin Glargine Industry Volume K Unit Forecast, by End User 2019 & 2032
- Table 121: Global Insulin Glargine Industry Revenue Million Forecast, by Country 2019 & 2032
- Table 122: Global Insulin Glargine Industry Volume K Unit Forecast, by Country 2019 & 2032
- Table 123: France Insulin Glargine Industry Revenue (Million) Forecast, by Application 2019 & 2032
- Table 124: France Insulin Glargine Industry Volume (K Unit) Forecast, by Application 2019 & 2032
- Table 125: Germany Insulin Glargine Industry Revenue (Million) Forecast, by Application 2019 & 2032
- Table 126: Germany Insulin Glargine Industry Volume (K Unit) Forecast, by Application 2019 & 2032
- Table 127: Italy Insulin Glargine Industry Revenue (Million) Forecast, by Application 2019 & 2032
- Table 128: Italy Insulin Glargine Industry Volume (K Unit) Forecast, by Application 2019 & 2032
- Table 129: Spain Insulin Glargine Industry Revenue (Million) Forecast, by Application 2019 & 2032
- Table 130: Spain Insulin Glargine Industry Volume (K Unit) Forecast, by Application 2019 & 2032
- Table 131: United Kingdom Insulin Glargine Industry Revenue (Million) Forecast, by Application 2019 & 2032
- Table 132: United Kingdom Insulin Glargine Industry Volume (K Unit) Forecast, by Application 2019 & 2032
- Table 133: Russia Insulin Glargine Industry Revenue (Million) Forecast, by Application 2019 & 2032
- Table 134: Russia Insulin Glargine Industry Volume (K Unit) Forecast, by Application 2019 & 2032
- Table 135: Rest of Europe Insulin Glargine Industry Revenue (Million) Forecast, by Application 2019 & 2032
- Table 136: Rest of Europe Insulin Glargine Industry Volume (K Unit) Forecast, by Application 2019 & 2032
- Table 137: Global Insulin Glargine Industry Revenue Million Forecast, by Type 2019 & 2032
- Table 138: Global Insulin Glargine Industry Volume K Unit Forecast, by Type 2019 & 2032
- Table 139: Global Insulin Glargine Industry Revenue Million Forecast, by Application 2019 & 2032
- Table 140: Global Insulin Glargine Industry Volume K Unit Forecast, by Application 2019 & 2032
- Table 141: Global Insulin Glargine Industry Revenue Million Forecast, by End User 2019 & 2032
- Table 142: Global Insulin Glargine Industry Volume K Unit Forecast, by End User 2019 & 2032
- Table 143: Global Insulin Glargine Industry Revenue Million Forecast, by Country 2019 & 2032
- Table 144: Global Insulin Glargine Industry Volume K Unit Forecast, by Country 2019 & 2032
- Table 145: Mexico Insulin Glargine Industry Revenue (Million) Forecast, by Application 2019 & 2032
- Table 146: Mexico Insulin Glargine Industry Volume (K Unit) Forecast, by Application 2019 & 2032
- Table 147: Brazil Insulin Glargine Industry Revenue (Million) Forecast, by Application 2019 & 2032
- Table 148: Brazil Insulin Glargine Industry Volume (K Unit) Forecast, by Application 2019 & 2032
- Table 149: Rest of Latin America Insulin Glargine Industry Revenue (Million) Forecast, by Application 2019 & 2032
- Table 150: Rest of Latin America Insulin Glargine Industry Volume (K Unit) Forecast, by Application 2019 & 2032
- Table 151: Global Insulin Glargine Industry Revenue Million Forecast, by Type 2019 & 2032
- Table 152: Global Insulin Glargine Industry Volume K Unit Forecast, by Type 2019 & 2032
- Table 153: Global Insulin Glargine Industry Revenue Million Forecast, by Application 2019 & 2032
- Table 154: Global Insulin Glargine Industry Volume K Unit Forecast, by Application 2019 & 2032
- Table 155: Global Insulin Glargine Industry Revenue Million Forecast, by End User 2019 & 2032
- Table 156: Global Insulin Glargine Industry Volume K Unit Forecast, by End User 2019 & 2032
- Table 157: Global Insulin Glargine Industry Revenue Million Forecast, by Country 2019 & 2032
- Table 158: Global Insulin Glargine Industry Volume K Unit Forecast, by Country 2019 & 2032
- Table 159: Japan Insulin Glargine Industry Revenue (Million) Forecast, by Application 2019 & 2032
- Table 160: Japan Insulin Glargine Industry Volume (K Unit) Forecast, by Application 2019 & 2032
- Table 161: South Korea Insulin Glargine Industry Revenue (Million) Forecast, by Application 2019 & 2032
- Table 162: South Korea Insulin Glargine Industry Volume (K Unit) Forecast, by Application 2019 & 2032
- Table 163: China Insulin Glargine Industry Revenue (Million) Forecast, by Application 2019 & 2032
- Table 164: China Insulin Glargine Industry Volume (K Unit) Forecast, by Application 2019 & 2032
- Table 165: India Insulin Glargine Industry Revenue (Million) Forecast, by Application 2019 & 2032
- Table 166: India Insulin Glargine Industry Volume (K Unit) Forecast, by Application 2019 & 2032
- Table 167: Australia Insulin Glargine Industry Revenue (Million) Forecast, by Application 2019 & 2032
- Table 168: Australia Insulin Glargine Industry Volume (K Unit) Forecast, by Application 2019 & 2032
- Table 169: Vietnam Insulin Glargine Industry Revenue (Million) Forecast, by Application 2019 & 2032
- Table 170: Vietnam Insulin Glargine Industry Volume (K Unit) Forecast, by Application 2019 & 2032
- Table 171: Malaysia Insulin Glargine Industry Revenue (Million) Forecast, by Application 2019 & 2032
- Table 172: Malaysia Insulin Glargine Industry Volume (K Unit) Forecast, by Application 2019 & 2032
- Table 173: Indonesia Insulin Glargine Industry Revenue (Million) Forecast, by Application 2019 & 2032
- Table 174: Indonesia Insulin Glargine Industry Volume (K Unit) Forecast, by Application 2019 & 2032
- Table 175: Philippines Insulin Glargine Industry Revenue (Million) Forecast, by Application 2019 & 2032
- Table 176: Philippines Insulin Glargine Industry Volume (K Unit) Forecast, by Application 2019 & 2032
- Table 177: Thailand Insulin Glargine Industry Revenue (Million) Forecast, by Application 2019 & 2032
- Table 178: Thailand Insulin Glargine Industry Volume (K Unit) Forecast, by Application 2019 & 2032
- Table 179: Rest of Asia Pacific Insulin Glargine Industry Revenue (Million) Forecast, by Application 2019 & 2032
- Table 180: Rest of Asia Pacific Insulin Glargine Industry Volume (K Unit) Forecast, by Application 2019 & 2032
- Table 181: Global Insulin Glargine Industry Revenue Million Forecast, by Type 2019 & 2032
- Table 182: Global Insulin Glargine Industry Volume K Unit Forecast, by Type 2019 & 2032
- Table 183: Global Insulin Glargine Industry Revenue Million Forecast, by Application 2019 & 2032
- Table 184: Global Insulin Glargine Industry Volume K Unit Forecast, by Application 2019 & 2032
- Table 185: Global Insulin Glargine Industry Revenue Million Forecast, by End User 2019 & 2032
- Table 186: Global Insulin Glargine Industry Volume K Unit Forecast, by End User 2019 & 2032
- Table 187: Global Insulin Glargine Industry Revenue Million Forecast, by Country 2019 & 2032
- Table 188: Global Insulin Glargine Industry Volume K Unit Forecast, by Country 2019 & 2032
- Table 189: Saudi Arabia Insulin Glargine Industry Revenue (Million) Forecast, by Application 2019 & 2032
- Table 190: Saudi Arabia Insulin Glargine Industry Volume (K Unit) Forecast, by Application 2019 & 2032
- Table 191: Iran Insulin Glargine Industry Revenue (Million) Forecast, by Application 2019 & 2032
- Table 192: Iran Insulin Glargine Industry Volume (K Unit) Forecast, by Application 2019 & 2032
- Table 193: Egypt Insulin Glargine Industry Revenue (Million) Forecast, by Application 2019 & 2032
- Table 194: Egypt Insulin Glargine Industry Volume (K Unit) Forecast, by Application 2019 & 2032
- Table 195: Oman Insulin Glargine Industry Revenue (Million) Forecast, by Application 2019 & 2032
- Table 196: Oman Insulin Glargine Industry Volume (K Unit) Forecast, by Application 2019 & 2032
- Table 197: South Africa Insulin Glargine Industry Revenue (Million) Forecast, by Application 2019 & 2032
- Table 198: South Africa Insulin Glargine Industry Volume (K Unit) Forecast, by Application 2019 & 2032
- Table 199: Rest of Middle East and Africa Insulin Glargine Industry Revenue (Million) Forecast, by Application 2019 & 2032
- Table 200: Rest of Middle East and Africa Insulin Glargine Industry Volume (K Unit) Forecast, by Application 2019 & 2032
Frequently Asked Questions
1. What is the projected Compound Annual Growth Rate (CAGR) of the Insulin Glargine Industry?
The projected CAGR is approximately 6.28%.
2. Which companies are prominent players in the Insulin Glargine Industry?
Key companies in the market include Novo Nordisk AS, Eli Lilly and Company, Sanofi Aventis, Biocon, Julphar.
3. What are the main segments of the Insulin Glargine Industry?
The market segments include Type, Application, End User.
4. Can you provide details about the market size?
The market size is estimated to be USD 1.54 Million as of 2022.
5. What are some drivers contributing to market growth?
; The Rise in Global Prevalence of Cases of Obesity due to Modern Sedentary Lifestyles; Rise in Awareness and Disposable Income in Developed Economies.
6. What are the notable trends driving market growth?
Insulin Glargine Market Access has Widened.
7. Are there any restraints impacting market growth?
; Highly Cost of Branded Products in Emerging Countries; Severe Adverse Associated with Medication Including Seizures. Suicidal Attempts and Even Death; Adoption of Traditional Yoga and Herbal Products.
8. Can you provide examples of recent developments in the market?
October 2022: Novo Nordisk announced headline results from the ONWARDS 5 phase 3a trial with once-weekly insulin icodec in people with type-2 diabetes. The ONWARDS 5 trial was a 52-week, open-label efficacy and safety treat-to-target trial investigating once-weekly insulin versus once-daily basal insulin (insulin degludec or insulin glargine U100/U300).
9. What pricing options are available for accessing the report?
Pricing options include single-user, multi-user, and enterprise licenses priced at USD 4750, USD 5250, and USD 8750 respectively.
10. Is the market size provided in terms of value or volume?
The market size is provided in terms of value, measured in Million and volume, measured in K Unit.
11. Are there any specific market keywords associated with the report?
Yes, the market keyword associated with the report is "Insulin Glargine Industry," which aids in identifying and referencing the specific market segment covered.
12. How do I determine which pricing option suits my needs best?
The pricing options vary based on user requirements and access needs. Individual users may opt for single-user licenses, while businesses requiring broader access may choose multi-user or enterprise licenses for cost-effective access to the report.
13. Are there any additional resources or data provided in the Insulin Glargine Industry report?
While the report offers comprehensive insights, it's advisable to review the specific contents or supplementary materials provided to ascertain if additional resources or data are available.
14. How can I stay updated on further developments or reports in the Insulin Glargine Industry?
To stay informed about further developments, trends, and reports in the Insulin Glargine Industry, consider subscribing to industry newsletters, following relevant companies and organizations, or regularly checking reputable industry news sources and publications.
Methodology
Step 1 - Identification of Relevant Samples Size from Population Database


Step 2 - Approaches for Defining Global Market Size (Value, Volume* & Price*)

Note*: In applicable scenarios
Step 3 - Data Sources
Primary Research
- Web Analytics
- Survey Reports
- Research Institute
- Latest Research Reports
- Opinion Leaders
Secondary Research
- Annual Reports
- White Paper
- Latest Press Release
- Industry Association
- Paid Database
- Investor Presentations

Step 4 - Data Triangulation
Involves using different sources of information in order to increase the validity of a study
These sources are likely to be stakeholders in a program - participants, other researchers, program staff, other community members, and so on.
Then we put all data in single framework & apply various statistical tools to find out the dynamic on the market.
During the analysis stage, feedback from the stakeholder groups would be compared to determine areas of agreement as well as areas of divergence


