
Key Insights
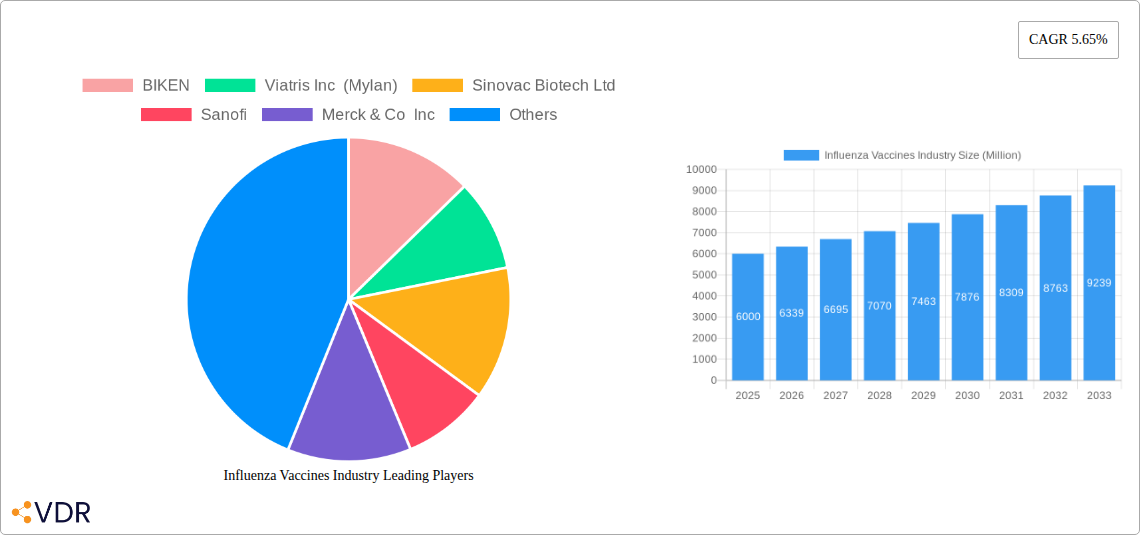
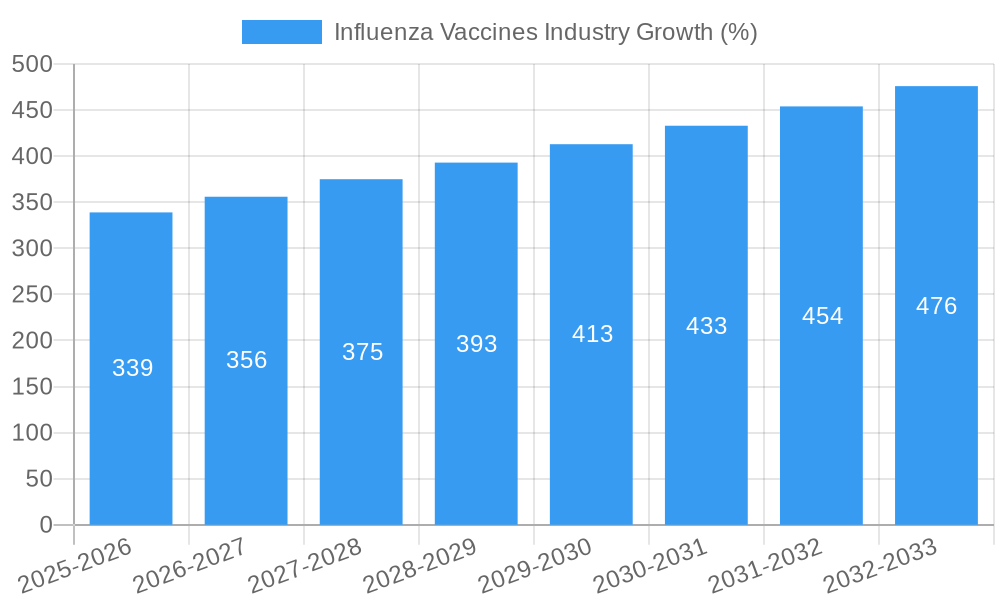
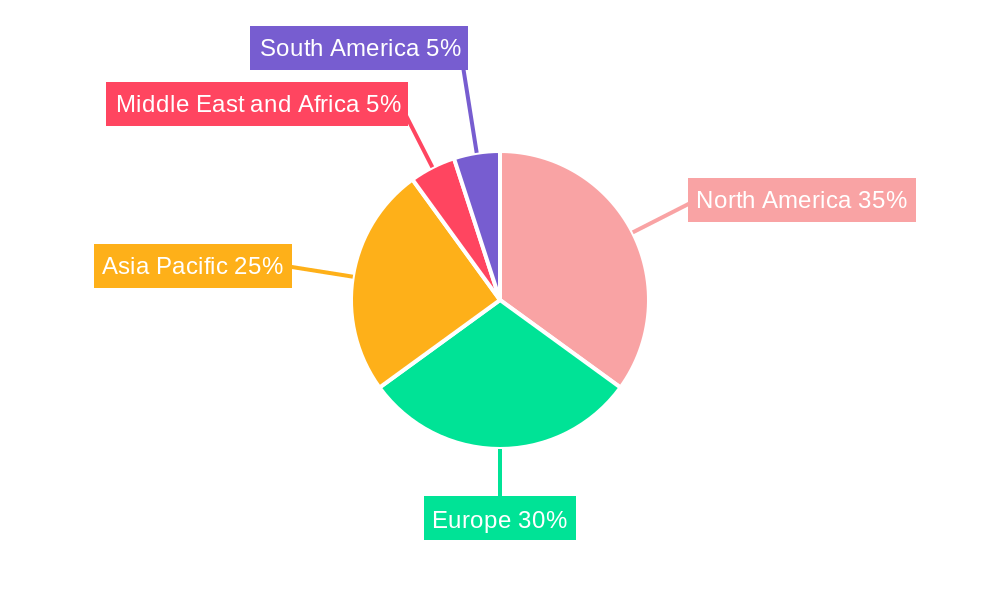
The global influenza vaccine market, valued at approximately $6 billion in 2025, is projected to experience robust growth, exhibiting a compound annual growth rate (CAGR) of 5.65% from 2025 to 2033. This growth is driven by several key factors. Increasing geriatric populations globally are highly susceptible to influenza complications, fueling demand for seasonal and pandemic influenza vaccines. Furthermore, advancements in vaccine technology, such as the development of cell-based and quadrivalent vaccines offering broader protection against influenza strains, are significantly impacting market expansion. Government initiatives promoting vaccination programs, particularly in developing nations, and rising awareness of influenza's potential severity are also contributing to market growth. However, factors like vaccine hesitancy, inconsistent efficacy across different strains, and high production costs pose challenges to market penetration. The market is segmented by age group (pediatric and adult), route of administration (injection and nasal spray), vaccine type (quadrivalent and trivalent), and type (seasonal and pandemic). Technological advancements are also shaping the market with the emergence of cell-based production methods alongside traditional egg-based methods. The North American and European markets currently hold significant shares, but the Asia-Pacific region is poised for substantial growth due to its expanding population and increasing healthcare spending.
Competition within the influenza vaccine market is intense, with major players including Pfizer, Sanofi, GSK, Merck, and AstraZeneca, alongside several other regional and specialized manufacturers. The market's future trajectory hinges on factors such as continued research and development leading to more effective and convenient vaccines, the success of public health campaigns to promote vaccination, and the ability of manufacturers to address production capacity and logistical challenges in ensuring equitable access to vaccines globally. Pricing strategies, the introduction of novel delivery systems, and tailored vaccine formulations for specific populations will further influence market dynamics in the forecast period. The increasing focus on pandemic preparedness and the potential for future influenza outbreaks will maintain considerable interest and investment in this crucial sector.
Influenza Vaccines Industry: A Comprehensive Market Report (2019-2033)
This comprehensive report provides a detailed analysis of the global influenza vaccines market, encompassing market dynamics, growth trends, regional segmentation, product landscape, and key players. The study period covers 2019-2033, with 2025 as the base and estimated year. The forecast period is 2025-2033, and the historical period is 2019-2024. The report segments the market by age group (pediatric, adults), route of administration (injection, nasal spray), vaccine type (quadrivalent, trivalent), type (seasonal, pandemic), and technology (egg-based, cell-based). Key players analyzed include BIKEN, Viatris Inc (Mylan), Sinovac Biotech Ltd, Sanofi, Merck & Co Inc, AstraZeneca PLC, Abbott Laboratories, CSL Limited, Gamma Vaccines Pvt Ltd, Emergent BioSolutions, GlaxoSmithKline PLC, and Pfizer Inc. The market size is presented in million units.
Influenza Vaccines Industry Market Dynamics & Structure
The influenza vaccines market is characterized by moderate concentration, with a few large players holding significant market share. Technological innovation, primarily in the development of cell-based and RNA vaccines, is a key driver. Stringent regulatory frameworks, including those set by agencies like the FDA and EMA, influence product development and approval timelines. Competitive pressure from generic and biosimilar products exists, alongside the challenge of overcoming vaccine hesitancy among certain populations. The market is also influenced by fluctuations in influenza strain prevalence and public health concerns. Mergers and acquisitions (M&A) activity has been moderate, with strategic partnerships playing a crucial role in expanding market reach and technological capabilities.
- Market Concentration: Moderately concentrated, with top 5 players holding approximately xx% of the market share in 2025.
- Technological Innovation: Shift towards cell-based and RNA technologies to enhance efficacy and reduce production time.
- Regulatory Landscape: Stringent approvals processes impacting timelines and costs.
- Competitive Substitutes: Generic and biosimilar vaccines pose a competitive threat.
- End-User Demographics: Significant demand from pediatric and elderly populations.
- M&A Trends: Strategic partnerships more prevalent than large-scale acquisitions. xx M&A deals recorded between 2019-2024.
Influenza Vaccines Industry Growth Trends & Insights
The influenza vaccines market experienced steady growth between 2019 and 2024, driven by increasing awareness of influenza’s impact and government-led vaccination campaigns. The market size reached xx million units in 2024. Adoption rates vary across regions, influenced by factors such as healthcare infrastructure and vaccination awareness. Technological disruptions, particularly the development of cell-based and novel vaccine technologies, are poised to reshape the market landscape. Consumer behavior is shifting towards a preference for more convenient and efficacious vaccines. The projected CAGR for 2025-2033 is xx%, leading to a market size of xx million units by 2033. Market penetration is expected to increase, especially in developing economies.
Dominant Regions, Countries, or Segments in Influenza Vaccines Industry
The North American region is currently the dominant market for influenza vaccines, followed by Europe. High vaccination rates and robust healthcare infrastructure contribute to this dominance. Within age groups, adults represent a larger market segment compared to pediatrics. Injection remains the primary route of administration due to established infrastructure and efficacy. Trivalent vaccines currently hold a larger market share than quadrivalent vaccines, although the latter is growing rapidly. Seasonal vaccines dominate the market due to consistent demand. Egg-based technology is currently prevalent, but cell-based technology is gaining traction due to its potential for faster production and improved safety. The pandemic vaccine segment experienced a surge in demand in recent years.
- Key Drivers: Strong healthcare infrastructure, high vaccination rates, government support, increasing awareness of influenza's impact, ageing population
- Dominance Factors: Established market presence, high disposable income, well-developed distribution networks.
- Growth Potential: Emerging economies offer significant growth opportunities.
Influenza Vaccines Industry Product Landscape
Influenza vaccines are primarily categorized by their valency (trivalent or quadrivalent), type (seasonal or pandemic), and production method (egg-based or cell-based). Recent innovations focus on improving efficacy, safety, and convenience, including the development of high-dose and adjuvanted vaccines. Key performance indicators (KPIs) include vaccine efficacy, immunogenicity, and safety profile. Unique selling propositions often center around increased efficacy, broader strain coverage, reduced side effects, or improved manufacturing processes.
Key Drivers, Barriers & Challenges in Influenza Vaccines Industry
Key Drivers: Growing prevalence of influenza, increasing awareness about vaccination, government initiatives promoting vaccination programs, and technological advancements leading to improved vaccine efficacy and safety.
Challenges: Vaccine hesitancy and anti-vaccine sentiments, fluctuating influenza strain prevalence making vaccine formulation challenging, stringent regulatory hurdles increasing development costs and time, and supply chain disruptions affecting vaccine availability. The impact of supply chain issues is estimated to have reduced production by approximately xx million units in 2022.
Emerging Opportunities in Influenza Vaccines Industry
Untapped markets in developing countries, growing demand for novel vaccine technologies, increased focus on personalized medicine approaches to vaccine development, and exploration of innovative vaccine delivery systems (e.g., intranasal vaccines) present significant opportunities. Furthermore, the development of universal influenza vaccines promises to revolutionize influenza prevention.
Growth Accelerators in the Influenza Vaccines Industry Industry
Technological advancements in vaccine platforms (cell-based, mRNA), strategic partnerships between pharmaceutical companies and research institutions, expansion into emerging markets through increased access and affordability initiatives, and focus on enhancing public health messaging and improving vaccine uptake are major growth catalysts.
Key Players Shaping the Influenza Vaccines Industry Market
- BIKEN
- Viatris Inc (Mylan)
- Sinovac Biotech Ltd
- Sanofi
- Merck & Co Inc
- AstraZeneca PLC
- Abbott Laboratories
- CSL Limited
- Gamma Vaccines Pvt Ltd
- Emergent BioSolutions
- GlaxoSmithKline PLC
- Pfizer Inc
Notable Milestones in Influenza Vaccines Industry Sector
- September 2022: Pfizer Inc. initiated a pivotal Phase 3 clinical trial for its quadrivalent modified RNA influenza vaccine candidate.
- March 2022: Sanofi launched Fluzone, a high-dose influenza vaccine offering protection against four strains in Australia.
In-Depth Influenza Vaccines Industry Market Outlook
The influenza vaccines market is poised for continued growth, driven by technological advancements, expanding vaccination programs, and increasing awareness of the disease burden. Strategic partnerships, market expansion into underserved regions, and the development of novel vaccine technologies will shape the future market landscape, creating significant opportunities for players with innovative products and robust distribution networks. The market is projected to reach xx million units by 2033, representing substantial growth potential for industry stakeholders.
Influenza Vaccines Industry Segmentation
-
1. Vaccine Type
- 1.1. Quadrivalent
- 1.2. Trivalent
-
2. Type
- 2.1. Seasonal
- 2.2. Pandemic
-
3. Technology
- 3.1. Egg-based
- 3.2. Cell-based
-
4. Age Group
- 4.1. Pediatric
- 4.2. Adults
-
5. Route of Administration
- 5.1. Injection
- 5.2. Nasal Spray
Influenza Vaccines Industry Segmentation By Geography
-
1. North America
- 1.1. United States
- 1.2. Canada
- 1.3. Mexico
-
2. Europe
- 2.1. Germany
- 2.2. United Kingdom
- 2.3. France
- 2.4. Spain
- 2.5. Italy
- 2.6. Rest of Europe
-
3. Asia Pacific
- 3.1. China
- 3.2. Japan
- 3.3. India
- 3.4. Austalia
- 3.5. South Korea
- 3.6. Rest of Asia Pacific
-
4. Middle East and Africa
- 4.1. GCC
- 4.2. South Africa
- 4.3. Rest of Middle East and Africa
-
5. South America
- 5.1. Brazil
- 5.2. Argentina
- 5.3. Rest of South America
Influenza Vaccines Industry REPORT HIGHLIGHTS
| Aspects | Details |
|---|---|
| Study Period | 2019-2033 |
| Base Year | 2024 |
| Estimated Year | 2025 |
| Forecast Period | 2025-2033 |
| Historical Period | 2019-2024 |
| Growth Rate | CAGR of 5.65% from 2019-2033 |
| Segmentation |
|
Table of Contents
- 1. Introduction
- 1.1. Research Scope
- 1.2. Market Segmentation
- 1.3. Research Methodology
- 1.4. Definitions and Assumptions
- 2. Executive Summary
- 2.1. Introduction
- 3. Market Dynamics
- 3.1. Introduction
- 3.2. Market Drivers
- 3.2.1. Rising Government Initiatives for Spreading Awareness; Continuous Advancement in Developing New Vaccines
- 3.3. Market Restrains
- 3.3.1. Requires High R&D Budget; Longer Timeline Required for New Vaccines
- 3.4. Market Trends
- 3.4.1. The Quadrivalent Segment is Expected to Hold a Major Share in the Market over the Forecast Period
- 4. Market Factor Analysis
- 4.1. Porters Five Forces
- 4.2. Supply/Value Chain
- 4.3. PESTEL analysis
- 4.4. Market Entropy
- 4.5. Patent/Trademark Analysis
- 5. Global Influenza Vaccines Industry Analysis, Insights and Forecast, 2019-2031
- 5.1. Market Analysis, Insights and Forecast - by Vaccine Type
- 5.1.1. Quadrivalent
- 5.1.2. Trivalent
- 5.2. Market Analysis, Insights and Forecast - by Type
- 5.2.1. Seasonal
- 5.2.2. Pandemic
- 5.3. Market Analysis, Insights and Forecast - by Technology
- 5.3.1. Egg-based
- 5.3.2. Cell-based
- 5.4. Market Analysis, Insights and Forecast - by Age Group
- 5.4.1. Pediatric
- 5.4.2. Adults
- 5.5. Market Analysis, Insights and Forecast - by Route of Administration
- 5.5.1. Injection
- 5.5.2. Nasal Spray
- 5.6. Market Analysis, Insights and Forecast - by Region
- 5.6.1. North America
- 5.6.2. Europe
- 5.6.3. Asia Pacific
- 5.6.4. Middle East and Africa
- 5.6.5. South America
- 5.1. Market Analysis, Insights and Forecast - by Vaccine Type
- 6. North America Influenza Vaccines Industry Analysis, Insights and Forecast, 2019-2031
- 6.1. Market Analysis, Insights and Forecast - by Vaccine Type
- 6.1.1. Quadrivalent
- 6.1.2. Trivalent
- 6.2. Market Analysis, Insights and Forecast - by Type
- 6.2.1. Seasonal
- 6.2.2. Pandemic
- 6.3. Market Analysis, Insights and Forecast - by Technology
- 6.3.1. Egg-based
- 6.3.2. Cell-based
- 6.4. Market Analysis, Insights and Forecast - by Age Group
- 6.4.1. Pediatric
- 6.4.2. Adults
- 6.5. Market Analysis, Insights and Forecast - by Route of Administration
- 6.5.1. Injection
- 6.5.2. Nasal Spray
- 6.1. Market Analysis, Insights and Forecast - by Vaccine Type
- 7. Europe Influenza Vaccines Industry Analysis, Insights and Forecast, 2019-2031
- 7.1. Market Analysis, Insights and Forecast - by Vaccine Type
- 7.1.1. Quadrivalent
- 7.1.2. Trivalent
- 7.2. Market Analysis, Insights and Forecast - by Type
- 7.2.1. Seasonal
- 7.2.2. Pandemic
- 7.3. Market Analysis, Insights and Forecast - by Technology
- 7.3.1. Egg-based
- 7.3.2. Cell-based
- 7.4. Market Analysis, Insights and Forecast - by Age Group
- 7.4.1. Pediatric
- 7.4.2. Adults
- 7.5. Market Analysis, Insights and Forecast - by Route of Administration
- 7.5.1. Injection
- 7.5.2. Nasal Spray
- 7.1. Market Analysis, Insights and Forecast - by Vaccine Type
- 8. Asia Pacific Influenza Vaccines Industry Analysis, Insights and Forecast, 2019-2031
- 8.1. Market Analysis, Insights and Forecast - by Vaccine Type
- 8.1.1. Quadrivalent
- 8.1.2. Trivalent
- 8.2. Market Analysis, Insights and Forecast - by Type
- 8.2.1. Seasonal
- 8.2.2. Pandemic
- 8.3. Market Analysis, Insights and Forecast - by Technology
- 8.3.1. Egg-based
- 8.3.2. Cell-based
- 8.4. Market Analysis, Insights and Forecast - by Age Group
- 8.4.1. Pediatric
- 8.4.2. Adults
- 8.5. Market Analysis, Insights and Forecast - by Route of Administration
- 8.5.1. Injection
- 8.5.2. Nasal Spray
- 8.1. Market Analysis, Insights and Forecast - by Vaccine Type
- 9. Middle East and Africa Influenza Vaccines Industry Analysis, Insights and Forecast, 2019-2031
- 9.1. Market Analysis, Insights and Forecast - by Vaccine Type
- 9.1.1. Quadrivalent
- 9.1.2. Trivalent
- 9.2. Market Analysis, Insights and Forecast - by Type
- 9.2.1. Seasonal
- 9.2.2. Pandemic
- 9.3. Market Analysis, Insights and Forecast - by Technology
- 9.3.1. Egg-based
- 9.3.2. Cell-based
- 9.4. Market Analysis, Insights and Forecast - by Age Group
- 9.4.1. Pediatric
- 9.4.2. Adults
- 9.5. Market Analysis, Insights and Forecast - by Route of Administration
- 9.5.1. Injection
- 9.5.2. Nasal Spray
- 9.1. Market Analysis, Insights and Forecast - by Vaccine Type
- 10. South America Influenza Vaccines Industry Analysis, Insights and Forecast, 2019-2031
- 10.1. Market Analysis, Insights and Forecast - by Vaccine Type
- 10.1.1. Quadrivalent
- 10.1.2. Trivalent
- 10.2. Market Analysis, Insights and Forecast - by Type
- 10.2.1. Seasonal
- 10.2.2. Pandemic
- 10.3. Market Analysis, Insights and Forecast - by Technology
- 10.3.1. Egg-based
- 10.3.2. Cell-based
- 10.4. Market Analysis, Insights and Forecast - by Age Group
- 10.4.1. Pediatric
- 10.4.2. Adults
- 10.5. Market Analysis, Insights and Forecast - by Route of Administration
- 10.5.1. Injection
- 10.5.2. Nasal Spray
- 10.1. Market Analysis, Insights and Forecast - by Vaccine Type
- 11. North America Influenza Vaccines Industry Analysis, Insights and Forecast, 2019-2031
- 11.1. Market Analysis, Insights and Forecast - By Country/Sub-region
- 11.1.1. undefined
- 12. Europe Influenza Vaccines Industry Analysis, Insights and Forecast, 2019-2031
- 12.1. Market Analysis, Insights and Forecast - By Country/Sub-region
- 12.1.1. undefined
- 13. Asia Pacific Influenza Vaccines Industry Analysis, Insights and Forecast, 2019-2031
- 13.1. Market Analysis, Insights and Forecast - By Country/Sub-region
- 13.1.1. undefined
- 14. Middle East and Africa Influenza Vaccines Industry Analysis, Insights and Forecast, 2019-2031
- 14.1. Market Analysis, Insights and Forecast - By Country/Sub-region
- 14.1.1. undefined
- 15. South America Influenza Vaccines Industry Analysis, Insights and Forecast, 2019-2031
- 15.1. Market Analysis, Insights and Forecast - By Country/Sub-region
- 15.1.1. undefined
- 16. Competitive Analysis
- 16.1. Global Market Share Analysis 2024
- 16.2. Company Profiles
- 16.2.1 BIKEN
- 16.2.1.1. Overview
- 16.2.1.2. Products
- 16.2.1.3. SWOT Analysis
- 16.2.1.4. Recent Developments
- 16.2.1.5. Financials (Based on Availability)
- 16.2.2 Viatris Inc (Mylan)
- 16.2.2.1. Overview
- 16.2.2.2. Products
- 16.2.2.3. SWOT Analysis
- 16.2.2.4. Recent Developments
- 16.2.2.5. Financials (Based on Availability)
- 16.2.3 Sinovac Biotech Ltd
- 16.2.3.1. Overview
- 16.2.3.2. Products
- 16.2.3.3. SWOT Analysis
- 16.2.3.4. Recent Developments
- 16.2.3.5. Financials (Based on Availability)
- 16.2.4 Sanofi
- 16.2.4.1. Overview
- 16.2.4.2. Products
- 16.2.4.3. SWOT Analysis
- 16.2.4.4. Recent Developments
- 16.2.4.5. Financials (Based on Availability)
- 16.2.5 Merck & Co Inc
- 16.2.5.1. Overview
- 16.2.5.2. Products
- 16.2.5.3. SWOT Analysis
- 16.2.5.4. Recent Developments
- 16.2.5.5. Financials (Based on Availability)
- 16.2.6 AstraZeneca PLC
- 16.2.6.1. Overview
- 16.2.6.2. Products
- 16.2.6.3. SWOT Analysis
- 16.2.6.4. Recent Developments
- 16.2.6.5. Financials (Based on Availability)
- 16.2.7 Abbott Laboratories
- 16.2.7.1. Overview
- 16.2.7.2. Products
- 16.2.7.3. SWOT Analysis
- 16.2.7.4. Recent Developments
- 16.2.7.5. Financials (Based on Availability)
- 16.2.8 CSL Limited
- 16.2.8.1. Overview
- 16.2.8.2. Products
- 16.2.8.3. SWOT Analysis
- 16.2.8.4. Recent Developments
- 16.2.8.5. Financials (Based on Availability)
- 16.2.9 Gamma Vaccines Pvt Ltd
- 16.2.9.1. Overview
- 16.2.9.2. Products
- 16.2.9.3. SWOT Analysis
- 16.2.9.4. Recent Developments
- 16.2.9.5. Financials (Based on Availability)
- 16.2.10 Emergent BioSolutions
- 16.2.10.1. Overview
- 16.2.10.2. Products
- 16.2.10.3. SWOT Analysis
- 16.2.10.4. Recent Developments
- 16.2.10.5. Financials (Based on Availability)
- 16.2.11 GlaxoSmithKline PLC
- 16.2.11.1. Overview
- 16.2.11.2. Products
- 16.2.11.3. SWOT Analysis
- 16.2.11.4. Recent Developments
- 16.2.11.5. Financials (Based on Availability)
- 16.2.12 Pfizer Inc
- 16.2.12.1. Overview
- 16.2.12.2. Products
- 16.2.12.3. SWOT Analysis
- 16.2.12.4. Recent Developments
- 16.2.12.5. Financials (Based on Availability)
- 16.2.1 BIKEN
List of Figures
- Figure 1: Global Influenza Vaccines Industry Revenue Breakdown (Million, %) by Region 2024 & 2032
- Figure 2: Global Influenza Vaccines Industry Volume Breakdown (K Unit, %) by Region 2024 & 2032
- Figure 3: North America Influenza Vaccines Industry Revenue (Million), by Country 2024 & 2032
- Figure 4: North America Influenza Vaccines Industry Volume (K Unit), by Country 2024 & 2032
- Figure 5: North America Influenza Vaccines Industry Revenue Share (%), by Country 2024 & 2032
- Figure 6: North America Influenza Vaccines Industry Volume Share (%), by Country 2024 & 2032
- Figure 7: Europe Influenza Vaccines Industry Revenue (Million), by Country 2024 & 2032
- Figure 8: Europe Influenza Vaccines Industry Volume (K Unit), by Country 2024 & 2032
- Figure 9: Europe Influenza Vaccines Industry Revenue Share (%), by Country 2024 & 2032
- Figure 10: Europe Influenza Vaccines Industry Volume Share (%), by Country 2024 & 2032
- Figure 11: Asia Pacific Influenza Vaccines Industry Revenue (Million), by Country 2024 & 2032
- Figure 12: Asia Pacific Influenza Vaccines Industry Volume (K Unit), by Country 2024 & 2032
- Figure 13: Asia Pacific Influenza Vaccines Industry Revenue Share (%), by Country 2024 & 2032
- Figure 14: Asia Pacific Influenza Vaccines Industry Volume Share (%), by Country 2024 & 2032
- Figure 15: Middle East and Africa Influenza Vaccines Industry Revenue (Million), by Country 2024 & 2032
- Figure 16: Middle East and Africa Influenza Vaccines Industry Volume (K Unit), by Country 2024 & 2032
- Figure 17: Middle East and Africa Influenza Vaccines Industry Revenue Share (%), by Country 2024 & 2032
- Figure 18: Middle East and Africa Influenza Vaccines Industry Volume Share (%), by Country 2024 & 2032
- Figure 19: South America Influenza Vaccines Industry Revenue (Million), by Country 2024 & 2032
- Figure 20: South America Influenza Vaccines Industry Volume (K Unit), by Country 2024 & 2032
- Figure 21: South America Influenza Vaccines Industry Revenue Share (%), by Country 2024 & 2032
- Figure 22: South America Influenza Vaccines Industry Volume Share (%), by Country 2024 & 2032
- Figure 23: North America Influenza Vaccines Industry Revenue (Million), by Vaccine Type 2024 & 2032
- Figure 24: North America Influenza Vaccines Industry Volume (K Unit), by Vaccine Type 2024 & 2032
- Figure 25: North America Influenza Vaccines Industry Revenue Share (%), by Vaccine Type 2024 & 2032
- Figure 26: North America Influenza Vaccines Industry Volume Share (%), by Vaccine Type 2024 & 2032
- Figure 27: North America Influenza Vaccines Industry Revenue (Million), by Type 2024 & 2032
- Figure 28: North America Influenza Vaccines Industry Volume (K Unit), by Type 2024 & 2032
- Figure 29: North America Influenza Vaccines Industry Revenue Share (%), by Type 2024 & 2032
- Figure 30: North America Influenza Vaccines Industry Volume Share (%), by Type 2024 & 2032
- Figure 31: North America Influenza Vaccines Industry Revenue (Million), by Technology 2024 & 2032
- Figure 32: North America Influenza Vaccines Industry Volume (K Unit), by Technology 2024 & 2032
- Figure 33: North America Influenza Vaccines Industry Revenue Share (%), by Technology 2024 & 2032
- Figure 34: North America Influenza Vaccines Industry Volume Share (%), by Technology 2024 & 2032
- Figure 35: North America Influenza Vaccines Industry Revenue (Million), by Age Group 2024 & 2032
- Figure 36: North America Influenza Vaccines Industry Volume (K Unit), by Age Group 2024 & 2032
- Figure 37: North America Influenza Vaccines Industry Revenue Share (%), by Age Group 2024 & 2032
- Figure 38: North America Influenza Vaccines Industry Volume Share (%), by Age Group 2024 & 2032
- Figure 39: North America Influenza Vaccines Industry Revenue (Million), by Route of Administration 2024 & 2032
- Figure 40: North America Influenza Vaccines Industry Volume (K Unit), by Route of Administration 2024 & 2032
- Figure 41: North America Influenza Vaccines Industry Revenue Share (%), by Route of Administration 2024 & 2032
- Figure 42: North America Influenza Vaccines Industry Volume Share (%), by Route of Administration 2024 & 2032
- Figure 43: North America Influenza Vaccines Industry Revenue (Million), by Country 2024 & 2032
- Figure 44: North America Influenza Vaccines Industry Volume (K Unit), by Country 2024 & 2032
- Figure 45: North America Influenza Vaccines Industry Revenue Share (%), by Country 2024 & 2032
- Figure 46: North America Influenza Vaccines Industry Volume Share (%), by Country 2024 & 2032
- Figure 47: Europe Influenza Vaccines Industry Revenue (Million), by Vaccine Type 2024 & 2032
- Figure 48: Europe Influenza Vaccines Industry Volume (K Unit), by Vaccine Type 2024 & 2032
- Figure 49: Europe Influenza Vaccines Industry Revenue Share (%), by Vaccine Type 2024 & 2032
- Figure 50: Europe Influenza Vaccines Industry Volume Share (%), by Vaccine Type 2024 & 2032
- Figure 51: Europe Influenza Vaccines Industry Revenue (Million), by Type 2024 & 2032
- Figure 52: Europe Influenza Vaccines Industry Volume (K Unit), by Type 2024 & 2032
- Figure 53: Europe Influenza Vaccines Industry Revenue Share (%), by Type 2024 & 2032
- Figure 54: Europe Influenza Vaccines Industry Volume Share (%), by Type 2024 & 2032
- Figure 55: Europe Influenza Vaccines Industry Revenue (Million), by Technology 2024 & 2032
- Figure 56: Europe Influenza Vaccines Industry Volume (K Unit), by Technology 2024 & 2032
- Figure 57: Europe Influenza Vaccines Industry Revenue Share (%), by Technology 2024 & 2032
- Figure 58: Europe Influenza Vaccines Industry Volume Share (%), by Technology 2024 & 2032
- Figure 59: Europe Influenza Vaccines Industry Revenue (Million), by Age Group 2024 & 2032
- Figure 60: Europe Influenza Vaccines Industry Volume (K Unit), by Age Group 2024 & 2032
- Figure 61: Europe Influenza Vaccines Industry Revenue Share (%), by Age Group 2024 & 2032
- Figure 62: Europe Influenza Vaccines Industry Volume Share (%), by Age Group 2024 & 2032
- Figure 63: Europe Influenza Vaccines Industry Revenue (Million), by Route of Administration 2024 & 2032
- Figure 64: Europe Influenza Vaccines Industry Volume (K Unit), by Route of Administration 2024 & 2032
- Figure 65: Europe Influenza Vaccines Industry Revenue Share (%), by Route of Administration 2024 & 2032
- Figure 66: Europe Influenza Vaccines Industry Volume Share (%), by Route of Administration 2024 & 2032
- Figure 67: Europe Influenza Vaccines Industry Revenue (Million), by Country 2024 & 2032
- Figure 68: Europe Influenza Vaccines Industry Volume (K Unit), by Country 2024 & 2032
- Figure 69: Europe Influenza Vaccines Industry Revenue Share (%), by Country 2024 & 2032
- Figure 70: Europe Influenza Vaccines Industry Volume Share (%), by Country 2024 & 2032
- Figure 71: Asia Pacific Influenza Vaccines Industry Revenue (Million), by Vaccine Type 2024 & 2032
- Figure 72: Asia Pacific Influenza Vaccines Industry Volume (K Unit), by Vaccine Type 2024 & 2032
- Figure 73: Asia Pacific Influenza Vaccines Industry Revenue Share (%), by Vaccine Type 2024 & 2032
- Figure 74: Asia Pacific Influenza Vaccines Industry Volume Share (%), by Vaccine Type 2024 & 2032
- Figure 75: Asia Pacific Influenza Vaccines Industry Revenue (Million), by Type 2024 & 2032
- Figure 76: Asia Pacific Influenza Vaccines Industry Volume (K Unit), by Type 2024 & 2032
- Figure 77: Asia Pacific Influenza Vaccines Industry Revenue Share (%), by Type 2024 & 2032
- Figure 78: Asia Pacific Influenza Vaccines Industry Volume Share (%), by Type 2024 & 2032
- Figure 79: Asia Pacific Influenza Vaccines Industry Revenue (Million), by Technology 2024 & 2032
- Figure 80: Asia Pacific Influenza Vaccines Industry Volume (K Unit), by Technology 2024 & 2032
- Figure 81: Asia Pacific Influenza Vaccines Industry Revenue Share (%), by Technology 2024 & 2032
- Figure 82: Asia Pacific Influenza Vaccines Industry Volume Share (%), by Technology 2024 & 2032
- Figure 83: Asia Pacific Influenza Vaccines Industry Revenue (Million), by Age Group 2024 & 2032
- Figure 84: Asia Pacific Influenza Vaccines Industry Volume (K Unit), by Age Group 2024 & 2032
- Figure 85: Asia Pacific Influenza Vaccines Industry Revenue Share (%), by Age Group 2024 & 2032
- Figure 86: Asia Pacific Influenza Vaccines Industry Volume Share (%), by Age Group 2024 & 2032
- Figure 87: Asia Pacific Influenza Vaccines Industry Revenue (Million), by Route of Administration 2024 & 2032
- Figure 88: Asia Pacific Influenza Vaccines Industry Volume (K Unit), by Route of Administration 2024 & 2032
- Figure 89: Asia Pacific Influenza Vaccines Industry Revenue Share (%), by Route of Administration 2024 & 2032
- Figure 90: Asia Pacific Influenza Vaccines Industry Volume Share (%), by Route of Administration 2024 & 2032
- Figure 91: Asia Pacific Influenza Vaccines Industry Revenue (Million), by Country 2024 & 2032
- Figure 92: Asia Pacific Influenza Vaccines Industry Volume (K Unit), by Country 2024 & 2032
- Figure 93: Asia Pacific Influenza Vaccines Industry Revenue Share (%), by Country 2024 & 2032
- Figure 94: Asia Pacific Influenza Vaccines Industry Volume Share (%), by Country 2024 & 2032
- Figure 95: Middle East and Africa Influenza Vaccines Industry Revenue (Million), by Vaccine Type 2024 & 2032
- Figure 96: Middle East and Africa Influenza Vaccines Industry Volume (K Unit), by Vaccine Type 2024 & 2032
- Figure 97: Middle East and Africa Influenza Vaccines Industry Revenue Share (%), by Vaccine Type 2024 & 2032
- Figure 98: Middle East and Africa Influenza Vaccines Industry Volume Share (%), by Vaccine Type 2024 & 2032
- Figure 99: Middle East and Africa Influenza Vaccines Industry Revenue (Million), by Type 2024 & 2032
- Figure 100: Middle East and Africa Influenza Vaccines Industry Volume (K Unit), by Type 2024 & 2032
- Figure 101: Middle East and Africa Influenza Vaccines Industry Revenue Share (%), by Type 2024 & 2032
- Figure 102: Middle East and Africa Influenza Vaccines Industry Volume Share (%), by Type 2024 & 2032
- Figure 103: Middle East and Africa Influenza Vaccines Industry Revenue (Million), by Technology 2024 & 2032
- Figure 104: Middle East and Africa Influenza Vaccines Industry Volume (K Unit), by Technology 2024 & 2032
- Figure 105: Middle East and Africa Influenza Vaccines Industry Revenue Share (%), by Technology 2024 & 2032
- Figure 106: Middle East and Africa Influenza Vaccines Industry Volume Share (%), by Technology 2024 & 2032
- Figure 107: Middle East and Africa Influenza Vaccines Industry Revenue (Million), by Age Group 2024 & 2032
- Figure 108: Middle East and Africa Influenza Vaccines Industry Volume (K Unit), by Age Group 2024 & 2032
- Figure 109: Middle East and Africa Influenza Vaccines Industry Revenue Share (%), by Age Group 2024 & 2032
- Figure 110: Middle East and Africa Influenza Vaccines Industry Volume Share (%), by Age Group 2024 & 2032
- Figure 111: Middle East and Africa Influenza Vaccines Industry Revenue (Million), by Route of Administration 2024 & 2032
- Figure 112: Middle East and Africa Influenza Vaccines Industry Volume (K Unit), by Route of Administration 2024 & 2032
- Figure 113: Middle East and Africa Influenza Vaccines Industry Revenue Share (%), by Route of Administration 2024 & 2032
- Figure 114: Middle East and Africa Influenza Vaccines Industry Volume Share (%), by Route of Administration 2024 & 2032
- Figure 115: Middle East and Africa Influenza Vaccines Industry Revenue (Million), by Country 2024 & 2032
- Figure 116: Middle East and Africa Influenza Vaccines Industry Volume (K Unit), by Country 2024 & 2032
- Figure 117: Middle East and Africa Influenza Vaccines Industry Revenue Share (%), by Country 2024 & 2032
- Figure 118: Middle East and Africa Influenza Vaccines Industry Volume Share (%), by Country 2024 & 2032
- Figure 119: South America Influenza Vaccines Industry Revenue (Million), by Vaccine Type 2024 & 2032
- Figure 120: South America Influenza Vaccines Industry Volume (K Unit), by Vaccine Type 2024 & 2032
- Figure 121: South America Influenza Vaccines Industry Revenue Share (%), by Vaccine Type 2024 & 2032
- Figure 122: South America Influenza Vaccines Industry Volume Share (%), by Vaccine Type 2024 & 2032
- Figure 123: South America Influenza Vaccines Industry Revenue (Million), by Type 2024 & 2032
- Figure 124: South America Influenza Vaccines Industry Volume (K Unit), by Type 2024 & 2032
- Figure 125: South America Influenza Vaccines Industry Revenue Share (%), by Type 2024 & 2032
- Figure 126: South America Influenza Vaccines Industry Volume Share (%), by Type 2024 & 2032
- Figure 127: South America Influenza Vaccines Industry Revenue (Million), by Technology 2024 & 2032
- Figure 128: South America Influenza Vaccines Industry Volume (K Unit), by Technology 2024 & 2032
- Figure 129: South America Influenza Vaccines Industry Revenue Share (%), by Technology 2024 & 2032
- Figure 130: South America Influenza Vaccines Industry Volume Share (%), by Technology 2024 & 2032
- Figure 131: South America Influenza Vaccines Industry Revenue (Million), by Age Group 2024 & 2032
- Figure 132: South America Influenza Vaccines Industry Volume (K Unit), by Age Group 2024 & 2032
- Figure 133: South America Influenza Vaccines Industry Revenue Share (%), by Age Group 2024 & 2032
- Figure 134: South America Influenza Vaccines Industry Volume Share (%), by Age Group 2024 & 2032
- Figure 135: South America Influenza Vaccines Industry Revenue (Million), by Route of Administration 2024 & 2032
- Figure 136: South America Influenza Vaccines Industry Volume (K Unit), by Route of Administration 2024 & 2032
- Figure 137: South America Influenza Vaccines Industry Revenue Share (%), by Route of Administration 2024 & 2032
- Figure 138: South America Influenza Vaccines Industry Volume Share (%), by Route of Administration 2024 & 2032
- Figure 139: South America Influenza Vaccines Industry Revenue (Million), by Country 2024 & 2032
- Figure 140: South America Influenza Vaccines Industry Volume (K Unit), by Country 2024 & 2032
- Figure 141: South America Influenza Vaccines Industry Revenue Share (%), by Country 2024 & 2032
- Figure 142: South America Influenza Vaccines Industry Volume Share (%), by Country 2024 & 2032
List of Tables
- Table 1: Global Influenza Vaccines Industry Revenue Million Forecast, by Region 2019 & 2032
- Table 2: Global Influenza Vaccines Industry Volume K Unit Forecast, by Region 2019 & 2032
- Table 3: Global Influenza Vaccines Industry Revenue Million Forecast, by Vaccine Type 2019 & 2032
- Table 4: Global Influenza Vaccines Industry Volume K Unit Forecast, by Vaccine Type 2019 & 2032
- Table 5: Global Influenza Vaccines Industry Revenue Million Forecast, by Type 2019 & 2032
- Table 6: Global Influenza Vaccines Industry Volume K Unit Forecast, by Type 2019 & 2032
- Table 7: Global Influenza Vaccines Industry Revenue Million Forecast, by Technology 2019 & 2032
- Table 8: Global Influenza Vaccines Industry Volume K Unit Forecast, by Technology 2019 & 2032
- Table 9: Global Influenza Vaccines Industry Revenue Million Forecast, by Age Group 2019 & 2032
- Table 10: Global Influenza Vaccines Industry Volume K Unit Forecast, by Age Group 2019 & 2032
- Table 11: Global Influenza Vaccines Industry Revenue Million Forecast, by Route of Administration 2019 & 2032
- Table 12: Global Influenza Vaccines Industry Volume K Unit Forecast, by Route of Administration 2019 & 2032
- Table 13: Global Influenza Vaccines Industry Revenue Million Forecast, by Region 2019 & 2032
- Table 14: Global Influenza Vaccines Industry Volume K Unit Forecast, by Region 2019 & 2032
- Table 15: Global Influenza Vaccines Industry Revenue Million Forecast, by Country 2019 & 2032
- Table 16: Global Influenza Vaccines Industry Volume K Unit Forecast, by Country 2019 & 2032
- Table 17: Global Influenza Vaccines Industry Revenue Million Forecast, by Country 2019 & 2032
- Table 18: Global Influenza Vaccines Industry Volume K Unit Forecast, by Country 2019 & 2032
- Table 19: Global Influenza Vaccines Industry Revenue Million Forecast, by Country 2019 & 2032
- Table 20: Global Influenza Vaccines Industry Volume K Unit Forecast, by Country 2019 & 2032
- Table 21: Global Influenza Vaccines Industry Revenue Million Forecast, by Country 2019 & 2032
- Table 22: Global Influenza Vaccines Industry Volume K Unit Forecast, by Country 2019 & 2032
- Table 23: Global Influenza Vaccines Industry Revenue Million Forecast, by Country 2019 & 2032
- Table 24: Global Influenza Vaccines Industry Volume K Unit Forecast, by Country 2019 & 2032
- Table 25: Global Influenza Vaccines Industry Revenue Million Forecast, by Vaccine Type 2019 & 2032
- Table 26: Global Influenza Vaccines Industry Volume K Unit Forecast, by Vaccine Type 2019 & 2032
- Table 27: Global Influenza Vaccines Industry Revenue Million Forecast, by Type 2019 & 2032
- Table 28: Global Influenza Vaccines Industry Volume K Unit Forecast, by Type 2019 & 2032
- Table 29: Global Influenza Vaccines Industry Revenue Million Forecast, by Technology 2019 & 2032
- Table 30: Global Influenza Vaccines Industry Volume K Unit Forecast, by Technology 2019 & 2032
- Table 31: Global Influenza Vaccines Industry Revenue Million Forecast, by Age Group 2019 & 2032
- Table 32: Global Influenza Vaccines Industry Volume K Unit Forecast, by Age Group 2019 & 2032
- Table 33: Global Influenza Vaccines Industry Revenue Million Forecast, by Route of Administration 2019 & 2032
- Table 34: Global Influenza Vaccines Industry Volume K Unit Forecast, by Route of Administration 2019 & 2032
- Table 35: Global Influenza Vaccines Industry Revenue Million Forecast, by Country 2019 & 2032
- Table 36: Global Influenza Vaccines Industry Volume K Unit Forecast, by Country 2019 & 2032
- Table 37: United States Influenza Vaccines Industry Revenue (Million) Forecast, by Application 2019 & 2032
- Table 38: United States Influenza Vaccines Industry Volume (K Unit) Forecast, by Application 2019 & 2032
- Table 39: Canada Influenza Vaccines Industry Revenue (Million) Forecast, by Application 2019 & 2032
- Table 40: Canada Influenza Vaccines Industry Volume (K Unit) Forecast, by Application 2019 & 2032
- Table 41: Mexico Influenza Vaccines Industry Revenue (Million) Forecast, by Application 2019 & 2032
- Table 42: Mexico Influenza Vaccines Industry Volume (K Unit) Forecast, by Application 2019 & 2032
- Table 43: Global Influenza Vaccines Industry Revenue Million Forecast, by Vaccine Type 2019 & 2032
- Table 44: Global Influenza Vaccines Industry Volume K Unit Forecast, by Vaccine Type 2019 & 2032
- Table 45: Global Influenza Vaccines Industry Revenue Million Forecast, by Type 2019 & 2032
- Table 46: Global Influenza Vaccines Industry Volume K Unit Forecast, by Type 2019 & 2032
- Table 47: Global Influenza Vaccines Industry Revenue Million Forecast, by Technology 2019 & 2032
- Table 48: Global Influenza Vaccines Industry Volume K Unit Forecast, by Technology 2019 & 2032
- Table 49: Global Influenza Vaccines Industry Revenue Million Forecast, by Age Group 2019 & 2032
- Table 50: Global Influenza Vaccines Industry Volume K Unit Forecast, by Age Group 2019 & 2032
- Table 51: Global Influenza Vaccines Industry Revenue Million Forecast, by Route of Administration 2019 & 2032
- Table 52: Global Influenza Vaccines Industry Volume K Unit Forecast, by Route of Administration 2019 & 2032
- Table 53: Global Influenza Vaccines Industry Revenue Million Forecast, by Country 2019 & 2032
- Table 54: Global Influenza Vaccines Industry Volume K Unit Forecast, by Country 2019 & 2032
- Table 55: Germany Influenza Vaccines Industry Revenue (Million) Forecast, by Application 2019 & 2032
- Table 56: Germany Influenza Vaccines Industry Volume (K Unit) Forecast, by Application 2019 & 2032
- Table 57: United Kingdom Influenza Vaccines Industry Revenue (Million) Forecast, by Application 2019 & 2032
- Table 58: United Kingdom Influenza Vaccines Industry Volume (K Unit) Forecast, by Application 2019 & 2032
- Table 59: France Influenza Vaccines Industry Revenue (Million) Forecast, by Application 2019 & 2032
- Table 60: France Influenza Vaccines Industry Volume (K Unit) Forecast, by Application 2019 & 2032
- Table 61: Spain Influenza Vaccines Industry Revenue (Million) Forecast, by Application 2019 & 2032
- Table 62: Spain Influenza Vaccines Industry Volume (K Unit) Forecast, by Application 2019 & 2032
- Table 63: Italy Influenza Vaccines Industry Revenue (Million) Forecast, by Application 2019 & 2032
- Table 64: Italy Influenza Vaccines Industry Volume (K Unit) Forecast, by Application 2019 & 2032
- Table 65: Rest of Europe Influenza Vaccines Industry Revenue (Million) Forecast, by Application 2019 & 2032
- Table 66: Rest of Europe Influenza Vaccines Industry Volume (K Unit) Forecast, by Application 2019 & 2032
- Table 67: Global Influenza Vaccines Industry Revenue Million Forecast, by Vaccine Type 2019 & 2032
- Table 68: Global Influenza Vaccines Industry Volume K Unit Forecast, by Vaccine Type 2019 & 2032
- Table 69: Global Influenza Vaccines Industry Revenue Million Forecast, by Type 2019 & 2032
- Table 70: Global Influenza Vaccines Industry Volume K Unit Forecast, by Type 2019 & 2032
- Table 71: Global Influenza Vaccines Industry Revenue Million Forecast, by Technology 2019 & 2032
- Table 72: Global Influenza Vaccines Industry Volume K Unit Forecast, by Technology 2019 & 2032
- Table 73: Global Influenza Vaccines Industry Revenue Million Forecast, by Age Group 2019 & 2032
- Table 74: Global Influenza Vaccines Industry Volume K Unit Forecast, by Age Group 2019 & 2032
- Table 75: Global Influenza Vaccines Industry Revenue Million Forecast, by Route of Administration 2019 & 2032
- Table 76: Global Influenza Vaccines Industry Volume K Unit Forecast, by Route of Administration 2019 & 2032
- Table 77: Global Influenza Vaccines Industry Revenue Million Forecast, by Country 2019 & 2032
- Table 78: Global Influenza Vaccines Industry Volume K Unit Forecast, by Country 2019 & 2032
- Table 79: China Influenza Vaccines Industry Revenue (Million) Forecast, by Application 2019 & 2032
- Table 80: China Influenza Vaccines Industry Volume (K Unit) Forecast, by Application 2019 & 2032
- Table 81: Japan Influenza Vaccines Industry Revenue (Million) Forecast, by Application 2019 & 2032
- Table 82: Japan Influenza Vaccines Industry Volume (K Unit) Forecast, by Application 2019 & 2032
- Table 83: India Influenza Vaccines Industry Revenue (Million) Forecast, by Application 2019 & 2032
- Table 84: India Influenza Vaccines Industry Volume (K Unit) Forecast, by Application 2019 & 2032
- Table 85: Austalia Influenza Vaccines Industry Revenue (Million) Forecast, by Application 2019 & 2032
- Table 86: Austalia Influenza Vaccines Industry Volume (K Unit) Forecast, by Application 2019 & 2032
- Table 87: South Korea Influenza Vaccines Industry Revenue (Million) Forecast, by Application 2019 & 2032
- Table 88: South Korea Influenza Vaccines Industry Volume (K Unit) Forecast, by Application 2019 & 2032
- Table 89: Rest of Asia Pacific Influenza Vaccines Industry Revenue (Million) Forecast, by Application 2019 & 2032
- Table 90: Rest of Asia Pacific Influenza Vaccines Industry Volume (K Unit) Forecast, by Application 2019 & 2032
- Table 91: Global Influenza Vaccines Industry Revenue Million Forecast, by Vaccine Type 2019 & 2032
- Table 92: Global Influenza Vaccines Industry Volume K Unit Forecast, by Vaccine Type 2019 & 2032
- Table 93: Global Influenza Vaccines Industry Revenue Million Forecast, by Type 2019 & 2032
- Table 94: Global Influenza Vaccines Industry Volume K Unit Forecast, by Type 2019 & 2032
- Table 95: Global Influenza Vaccines Industry Revenue Million Forecast, by Technology 2019 & 2032
- Table 96: Global Influenza Vaccines Industry Volume K Unit Forecast, by Technology 2019 & 2032
- Table 97: Global Influenza Vaccines Industry Revenue Million Forecast, by Age Group 2019 & 2032
- Table 98: Global Influenza Vaccines Industry Volume K Unit Forecast, by Age Group 2019 & 2032
- Table 99: Global Influenza Vaccines Industry Revenue Million Forecast, by Route of Administration 2019 & 2032
- Table 100: Global Influenza Vaccines Industry Volume K Unit Forecast, by Route of Administration 2019 & 2032
- Table 101: Global Influenza Vaccines Industry Revenue Million Forecast, by Country 2019 & 2032
- Table 102: Global Influenza Vaccines Industry Volume K Unit Forecast, by Country 2019 & 2032
- Table 103: GCC Influenza Vaccines Industry Revenue (Million) Forecast, by Application 2019 & 2032
- Table 104: GCC Influenza Vaccines Industry Volume (K Unit) Forecast, by Application 2019 & 2032
- Table 105: South Africa Influenza Vaccines Industry Revenue (Million) Forecast, by Application 2019 & 2032
- Table 106: South Africa Influenza Vaccines Industry Volume (K Unit) Forecast, by Application 2019 & 2032
- Table 107: Rest of Middle East and Africa Influenza Vaccines Industry Revenue (Million) Forecast, by Application 2019 & 2032
- Table 108: Rest of Middle East and Africa Influenza Vaccines Industry Volume (K Unit) Forecast, by Application 2019 & 2032
- Table 109: Global Influenza Vaccines Industry Revenue Million Forecast, by Vaccine Type 2019 & 2032
- Table 110: Global Influenza Vaccines Industry Volume K Unit Forecast, by Vaccine Type 2019 & 2032
- Table 111: Global Influenza Vaccines Industry Revenue Million Forecast, by Type 2019 & 2032
- Table 112: Global Influenza Vaccines Industry Volume K Unit Forecast, by Type 2019 & 2032
- Table 113: Global Influenza Vaccines Industry Revenue Million Forecast, by Technology 2019 & 2032
- Table 114: Global Influenza Vaccines Industry Volume K Unit Forecast, by Technology 2019 & 2032
- Table 115: Global Influenza Vaccines Industry Revenue Million Forecast, by Age Group 2019 & 2032
- Table 116: Global Influenza Vaccines Industry Volume K Unit Forecast, by Age Group 2019 & 2032
- Table 117: Global Influenza Vaccines Industry Revenue Million Forecast, by Route of Administration 2019 & 2032
- Table 118: Global Influenza Vaccines Industry Volume K Unit Forecast, by Route of Administration 2019 & 2032
- Table 119: Global Influenza Vaccines Industry Revenue Million Forecast, by Country 2019 & 2032
- Table 120: Global Influenza Vaccines Industry Volume K Unit Forecast, by Country 2019 & 2032
- Table 121: Brazil Influenza Vaccines Industry Revenue (Million) Forecast, by Application 2019 & 2032
- Table 122: Brazil Influenza Vaccines Industry Volume (K Unit) Forecast, by Application 2019 & 2032
- Table 123: Argentina Influenza Vaccines Industry Revenue (Million) Forecast, by Application 2019 & 2032
- Table 124: Argentina Influenza Vaccines Industry Volume (K Unit) Forecast, by Application 2019 & 2032
- Table 125: Rest of South America Influenza Vaccines Industry Revenue (Million) Forecast, by Application 2019 & 2032
- Table 126: Rest of South America Influenza Vaccines Industry Volume (K Unit) Forecast, by Application 2019 & 2032
Frequently Asked Questions
1. What is the projected Compound Annual Growth Rate (CAGR) of the Influenza Vaccines Industry?
The projected CAGR is approximately 5.65%.
2. Which companies are prominent players in the Influenza Vaccines Industry?
Key companies in the market include BIKEN, Viatris Inc (Mylan), Sinovac Biotech Ltd, Sanofi, Merck & Co Inc, AstraZeneca PLC, Abbott Laboratories, CSL Limited, Gamma Vaccines Pvt Ltd, Emergent BioSolutions, GlaxoSmithKline PLC, Pfizer Inc.
3. What are the main segments of the Influenza Vaccines Industry?
The market segments include Vaccine Type, Type, Technology, Age Group, Route of Administration.
4. Can you provide details about the market size?
The market size is estimated to be USD XX Million as of 2022.
5. What are some drivers contributing to market growth?
Rising Government Initiatives for Spreading Awareness; Continuous Advancement in Developing New Vaccines.
6. What are the notable trends driving market growth?
The Quadrivalent Segment is Expected to Hold a Major Share in the Market over the Forecast Period.
7. Are there any restraints impacting market growth?
Requires High R&D Budget; Longer Timeline Required for New Vaccines.
8. Can you provide examples of recent developments in the market?
September 2022: Pfizer Inc announced that the first participants have been dosed in a pivotal phase 3 clinical trial to evaluate the efficacy, safety, tolerability, and immunogenicity of the company's quadrivalent modified RNA influenza vaccine candidate.
9. What pricing options are available for accessing the report?
Pricing options include single-user, multi-user, and enterprise licenses priced at USD 4750, USD 5250, and USD 8750 respectively.
10. Is the market size provided in terms of value or volume?
The market size is provided in terms of value, measured in Million and volume, measured in K Unit.
11. Are there any specific market keywords associated with the report?
Yes, the market keyword associated with the report is "Influenza Vaccines Industry," which aids in identifying and referencing the specific market segment covered.
12. How do I determine which pricing option suits my needs best?
The pricing options vary based on user requirements and access needs. Individual users may opt for single-user licenses, while businesses requiring broader access may choose multi-user or enterprise licenses for cost-effective access to the report.
13. Are there any additional resources or data provided in the Influenza Vaccines Industry report?
While the report offers comprehensive insights, it's advisable to review the specific contents or supplementary materials provided to ascertain if additional resources or data are available.
14. How can I stay updated on further developments or reports in the Influenza Vaccines Industry?
To stay informed about further developments, trends, and reports in the Influenza Vaccines Industry, consider subscribing to industry newsletters, following relevant companies and organizations, or regularly checking reputable industry news sources and publications.
Methodology
Step 1 - Identification of Relevant Samples Size from Population Database


Step 2 - Approaches for Defining Global Market Size (Value, Volume* & Price*)

Note*: In applicable scenarios
Step 3 - Data Sources
Primary Research
- Web Analytics
- Survey Reports
- Research Institute
- Latest Research Reports
- Opinion Leaders
Secondary Research
- Annual Reports
- White Paper
- Latest Press Release
- Industry Association
- Paid Database
- Investor Presentations

Step 4 - Data Triangulation
Involves using different sources of information in order to increase the validity of a study
These sources are likely to be stakeholders in a program - participants, other researchers, program staff, other community members, and so on.
Then we put all data in single framework & apply various statistical tools to find out the dynamic on the market.
During the analysis stage, feedback from the stakeholder groups would be compared to determine areas of agreement as well as areas of divergence


