

Key Insights
The global Inertial Systems market in transportation is poised for substantial expansion, propelled by the rapid integration of autonomous vehicles, drones, and advanced driver-assistance systems (ADAS). With a projected Compound Annual Growth Rate (CAGR) of 15.87%, the market is estimated to reach $6.45 billion by 2025. Key growth catalysts include the escalating demand for precise navigation in autonomous systems, the widespread adoption of drones across diverse industries, and the imperative for enhanced safety features in commercial fleets. The market is segmented by component (accelerometers, gyroscopes, IMUs, INS), application (autonomous vehicles, drones, industrial automation), and end-user (automotive OEMs, Tier 1 suppliers). North America currently leads market share, driven by early technology adoption and a robust automotive sector. However, the Asia-Pacific region is expected to experience the fastest growth, fueled by rapid industrialization and significant infrastructure investments.
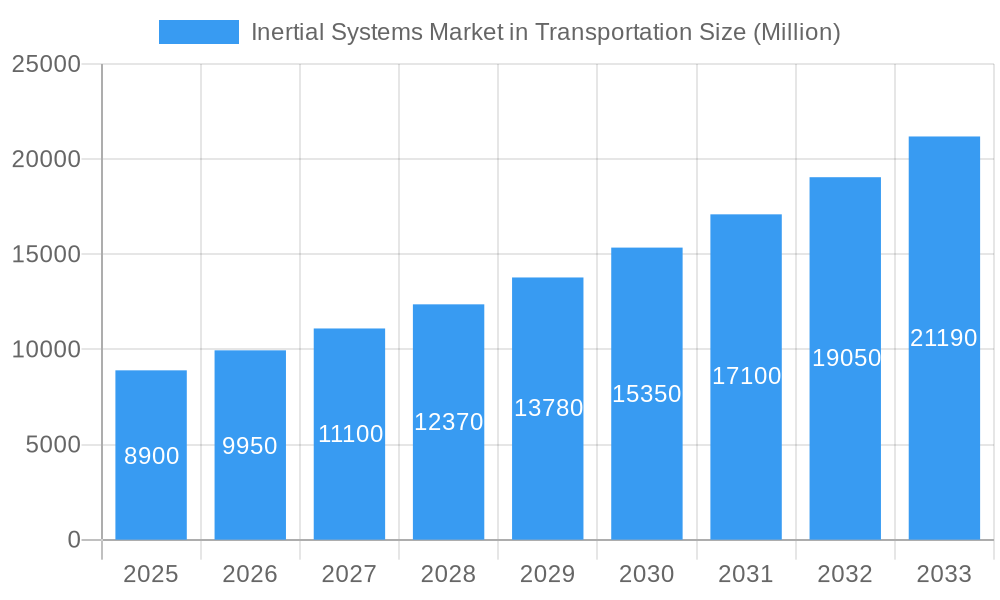
Inertial Systems Market in Transportation Market Size (In Billion)
Technological advancements, including sensor miniaturization and enhanced accuracy, are pivotal trends. The synergistic integration of inertial systems with complementary navigation technologies like GPS and LiDAR is elevating overall system performance and reliability. Despite these advancements, high initial investment costs and data security concerns present notable market restraints. Future expansion will be significantly driven by the demand for high-precision inertial systems in autonomous driving and the increasing utilization of drones for logistics, surveillance, and beyond.
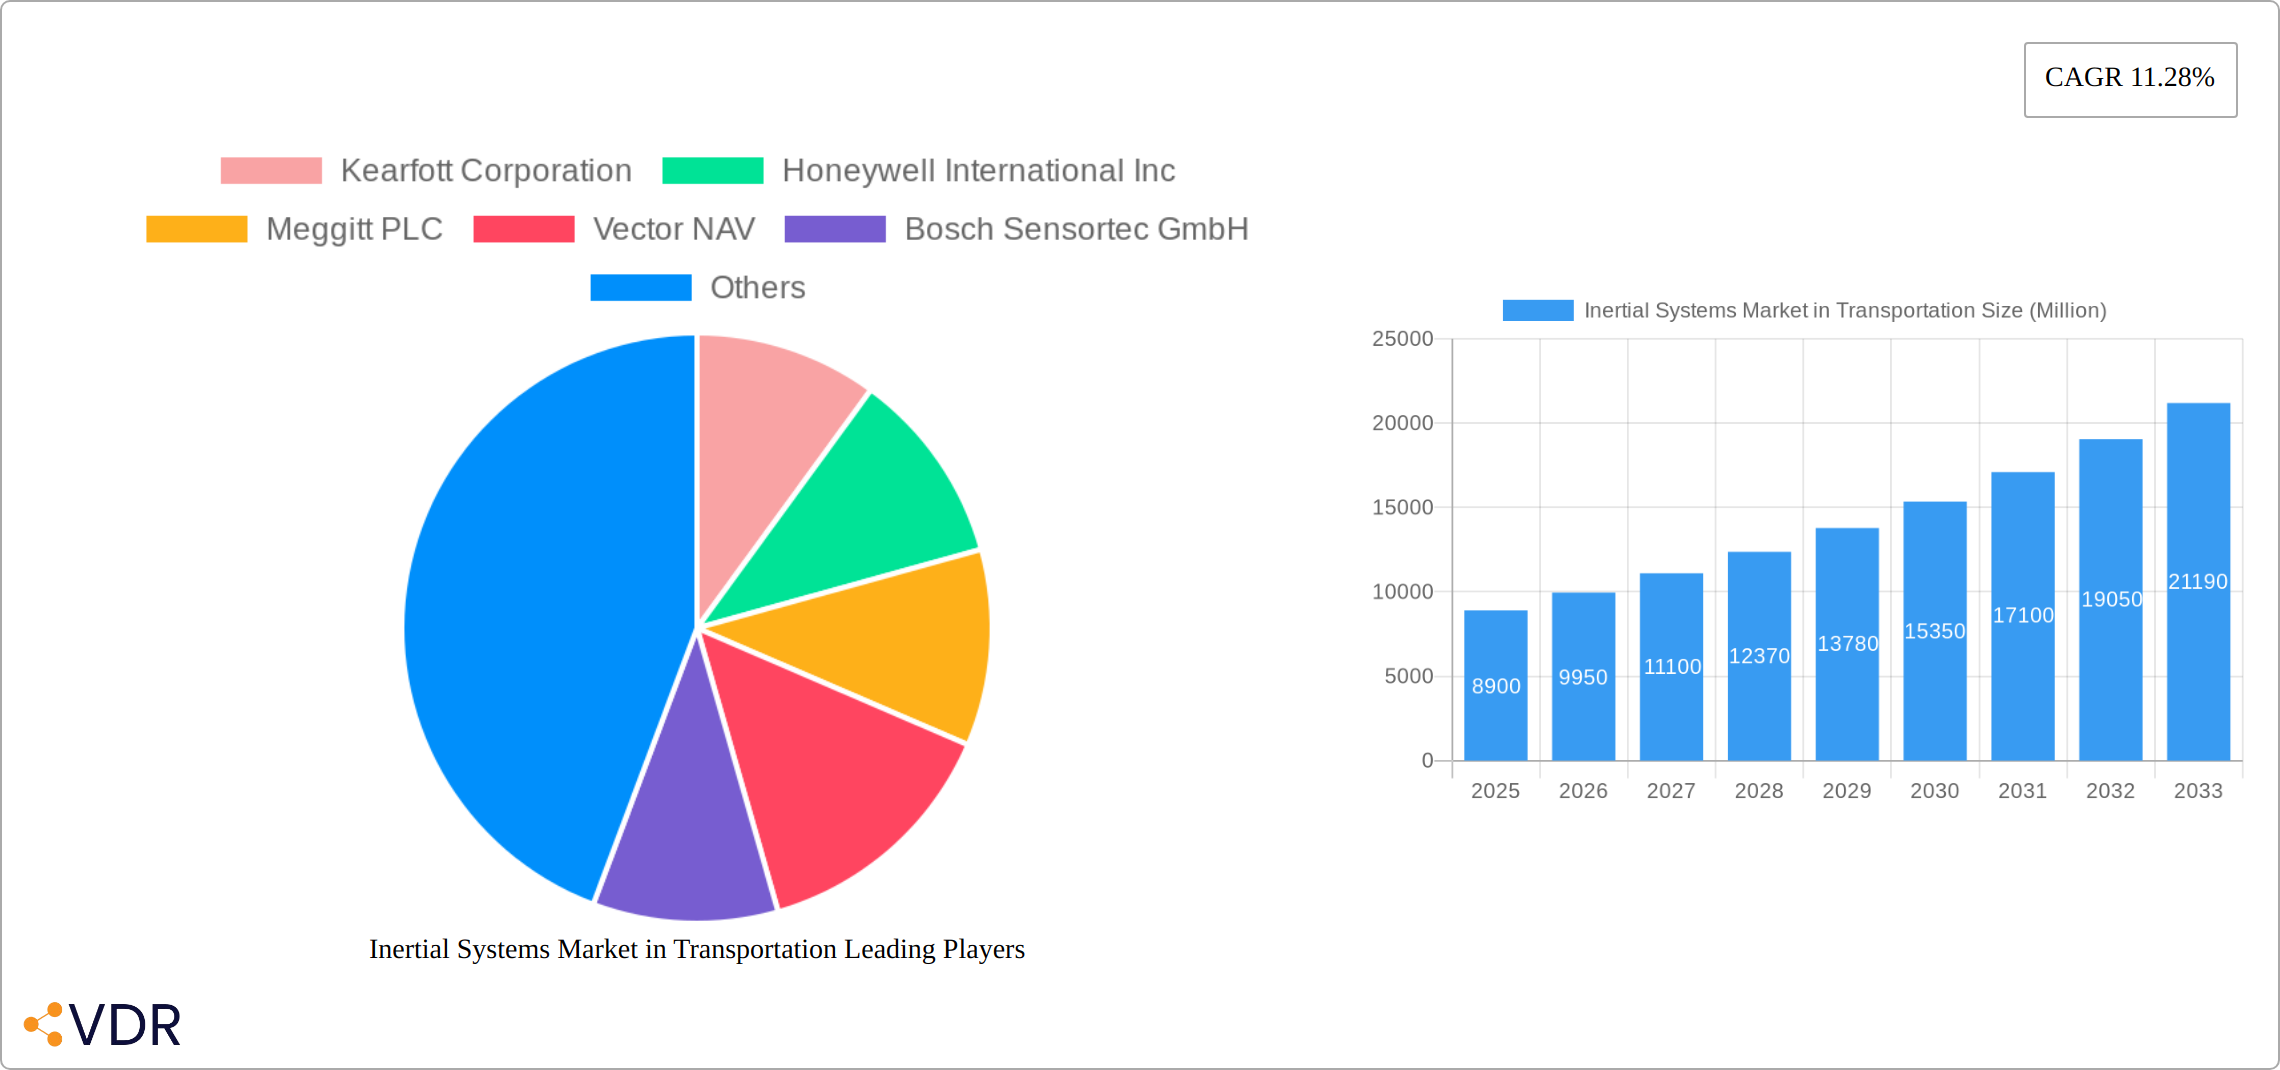
Inertial Systems Market in Transportation Company Market Share
Inertial Systems Market in Transportation: A Comprehensive Market Report (2019-2033)
This comprehensive report provides an in-depth analysis of the Inertial Systems market within the Transportation sector, offering invaluable insights for industry professionals, investors, and strategic decision-makers. We analyze market dynamics, growth trends, dominant segments, and key players, providing a complete picture of this rapidly evolving landscape. The report covers the period 2019-2033, with a focus on the forecast period 2025-2033 and a base year of 2025. The total market size is predicted to reach xx Million units by 2033.
Inertial Systems Market in Transportation Market Dynamics & Structure
The transportation Inertial Systems market is experiencing dynamic growth, shaped by a complex interplay of factors. This section analyzes the market's structure, key players, technological advancements, regulatory influences, and competitive dynamics to provide a comprehensive understanding of this evolving landscape. Leading players such as Honeywell International Inc, Bosch Sensortec GmbH, and others hold significant market share, though a number of smaller, specialized companies contribute to a competitive environment. The market is further influenced by continuous technological innovation, regulatory pressures, and strategic industry consolidation.
- Market Concentration and Competitive Landscape: While a few major players dominate (holding approximately xx% of the market share), the market exhibits a moderately concentrated structure with significant participation from numerous smaller, specialized firms. This fosters a dynamic and innovative marketplace.
- Technological Innovation: Advancements are driving market expansion. Key drivers include: breakthroughs in MEMS technology resulting in smaller, more efficient, and more accurate sensors; the integration of AI/ML algorithms for improved data processing and enhanced system performance; and a continuous push towards miniaturization and reduced power consumption, extending battery life and reducing overall system weight.
- Regulatory Landscape and Safety Standards: Stringent safety regulations, particularly those governing autonomous vehicles and drones, are significantly impacting market growth. Compliance with these regulations is paramount, presenting both opportunities (for companies offering compliant solutions) and challenges (for those needing to adapt to new standards). This regulatory landscape is a major catalyst for innovation and market expansion.
- Mergers and Acquisitions (M&A) Activity: Consolidation is evident through a moderate level of M&A activity (xx deals in the last 5 years). This trend indicates larger companies are strategically acquiring smaller firms with specialized technologies to expand their product portfolios and enhance their competitive positioning.
- Competitive Substitutes and Market Differentiation: Although Inertial Systems provide critical functionality for numerous applications, alternative technologies like GPS and vision systems pose competitive pressure. However, the inherent advantages of inertial systems – particularly their reliability in GPS-denied environments – ensure their continued importance and market relevance.
- End-User Demographics and Market Segmentation: The largest portion of the market is comprised of automotive OEMs and Tier 1 suppliers. However, other industrial and commercial applications are experiencing significant growth and contribute to the overall market expansion.
Inertial Systems Market in Transportation Growth Trends & Insights
The Inertial Systems market in transportation is poised for robust growth. We project a Compound Annual Growth Rate (CAGR) of xx% during the forecast period (2025-2033). This projected growth is fueled by several key factors, including the increasing adoption of autonomous vehicles and drones, the escalating demand for precise navigation in industrial applications, and the continuous stream of technological advancements. The market penetration rate is estimated at xx% in 2025 and is projected to reach xx% by 2033. Our analysis incorporates various factors: changing consumer preferences towards enhanced safety and efficiency in transportation, the influence of disruptive technologies, and the historical market size evolution (2019-2024) to create a robust and reliable forecast. This detailed analysis leverages both quantitative and qualitative data for a comprehensive understanding of market trajectory.
Dominant Regions, Countries, or Segments in Inertial Systems Market in Transportation
This section identifies the key geographical regions and market segments driving growth. North America is expected to retain its leading position, driven by robust demand from the automotive and aerospace sectors. Europe and the Asia-Pacific region are also demonstrating substantial growth, fueled by government initiatives supporting autonomous vehicle development and the expansion of industrial applications. This geographical diversity reflects the broad applicability of Inertial Systems across various transportation sectors and global markets.
- Leading Component Segment: Inertial Measurement Units (IMUs) are projected to maintain market dominance due to their widespread use across diverse transportation systems.
- Leading Application Segment: The autonomous vehicle sector is anticipated to be a significant growth driver, reflecting the increasing adoption of self-driving technologies and the associated need for high-precision navigation capabilities.
- Leading End-User Segment: Automotive OEMs and Tier 1 suppliers remain the primary end-users, representing the largest market share, a trend likely to continue in the foreseeable future.
- Key Regional Growth Drivers: North America benefits from robust automotive and aerospace sectors; Europe's focus on autonomous vehicle technology and stringent safety regulations contributes to its growth; and the Asia-Pacific region experiences growth due to rapid industrialization and ongoing technological advancements.
Inertial Systems Market in Transportation Product Landscape
The Inertial Systems market features a diverse range of products, including accelerometers, gyroscopes, IMUs, and INS, each with unique performance characteristics and applications. Recent innovations focus on enhancing accuracy, miniaturization, power efficiency, and cost-effectiveness. The integration of advanced signal processing algorithms and the development of high-performance MEMS-based sensors are key differentiators in this competitive market. Unique selling propositions (USPs) include improved resistance to shock and vibration, extended operating temperature ranges, and enhanced reliability in challenging environments.
Key Drivers, Barriers & Challenges in Inertial Systems Market in Transportation
Key Drivers:
- The growing adoption of autonomous vehicles and drones is a major driver, demanding high-precision inertial navigation.
- Increasing demand for improved safety and efficiency in transportation systems fuels market growth.
- Advancements in MEMS technology lead to smaller, lighter, and more cost-effective inertial sensors.
Challenges and Restraints:
- High initial investment costs associated with implementing new inertial navigation systems can be a barrier.
- The accuracy of inertial sensors can be affected by environmental factors, limiting their performance in challenging conditions.
- Intense competition among established and emerging players can put downward pressure on prices.
- Supply chain disruptions can affect the availability of critical components and raw materials.
Emerging Opportunities in Inertial Systems Market in Transportation
Emerging opportunities lie in the development of highly integrated systems combining inertial sensors with other technologies such as GPS and vision systems to create more robust navigation solutions. The expansion into new application areas, like robotics and smart infrastructure, presents further growth potential. The demand for more energy-efficient inertial sensors and the exploration of new materials for improved sensor performance are also significant opportunities.
Growth Accelerators in the Inertial Systems Market in Transportation Industry
Sustained long-term growth will be driven by ongoing technological advancements, resulting in increased sensor accuracy and reduced power consumption. Strategic partnerships between sensor manufacturers and automotive/aerospace companies are crucial for fostering innovation and accelerating market penetration. Expansion into new application areas, such as advanced driver-assistance systems (ADAS) and industrial robotics, will unlock substantial new market opportunities, further fueling market expansion.
Key Players Shaping the Inertial Systems Market in Transportation Market
- Kearfott Corporation
- Honeywell International Inc
- Meggitt PLC
- Vector NAV
- Bosch Sensortec GmbH
- Rockwell Collins
- KVH Industries Inc
- Invensense Inc
- Epson Europe Electronic
- Thames Group
- ST Microelectronics
- Silicon Sensing Systems Ltd
- Ixblue
- Analog Devices Inc
- Northrop Grumman Corporation
- Safran Group
- UTC Aerospace Systems
Notable Milestones in Inertial Systems Market in Transportation Sector
- January 2021: Honeywell, with DARPA funding, announces development of next-generation inertial sensors with significantly improved accuracy.
- December 2021: Inertial Labs acquires Memsense, expanding its IMU capabilities and accelerating technology development for autonomous vehicles and other applications.
In-Depth Inertial Systems Market in Transportation Market Outlook
The future of the Inertial Systems market in transportation is promising, with continued growth propelled by technological innovation, increasing adoption in autonomous vehicles and drones, and expansion into new applications. Strategic partnerships and investments in research and development (R&D) will be critical for maintaining a competitive advantage. The market is poised for significant expansion, offering lucrative opportunities for companies capable of providing high-precision, cost-effective, and reliable inertial navigation systems. This positive outlook underscores the enduring importance of Inertial Systems in the evolving landscape of transportation technology.
Inertial Systems Market in Transportation Segmentation
-
1. Component
- 1.1. Accelerometer
- 1.2. Gyroscope
- 1.3. Inertial Measurement Systems (IMU)
- 1.4. Inertial Navigation Systems (INS)
- 1.5. Other Components
Inertial Systems Market in Transportation Segmentation By Geography
- 1. North America
- 2. Europe
- 3. Asia Pacific
- 4. Latin America
- 5. Middle East and Africa
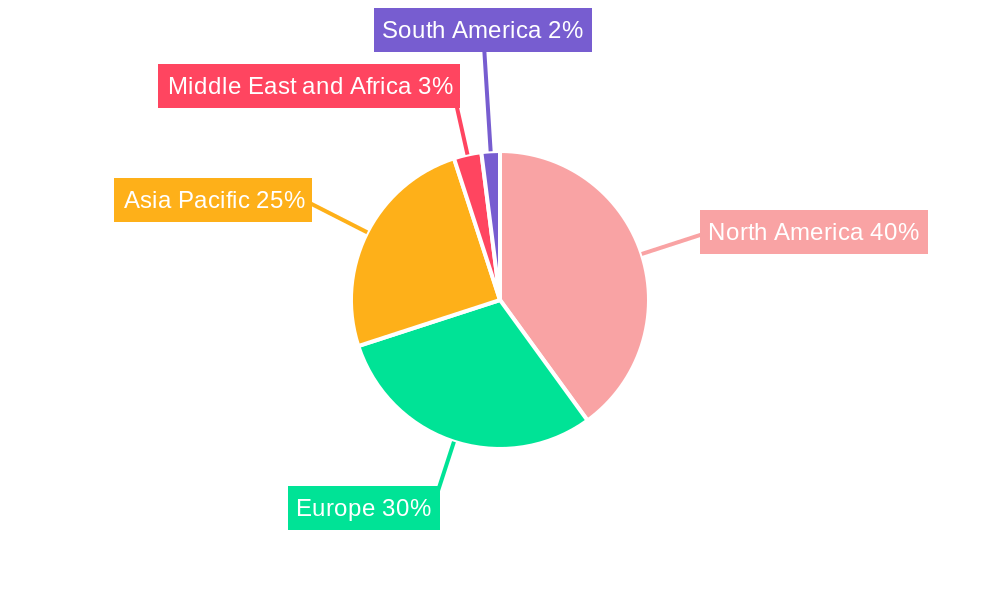
Inertial Systems Market in Transportation Regional Market Share
Geographic Coverage of Inertial Systems Market in Transportation
Inertial Systems Market in Transportation REPORT HIGHLIGHTS
| Aspects | Details |
|---|---|
| Study Period | 2020-2034 |
| Base Year | 2025 |
| Estimated Year | 2026 |
| Forecast Period | 2026-2034 |
| Historical Period | 2020-2025 |
| Growth Rate | CAGR of 15.87% from 2020-2034 |
| Segmentation |
|
Table of Contents
- 1. Introduction
- 1.1. Research Scope
- 1.2. Market Segmentation
- 1.3. Research Methodology
- 1.4. Definitions and Assumptions
- 2. Executive Summary
- 2.1. Introduction
- 3. Market Dynamics
- 3.1. Introduction
- 3.2. Market Drivers
- 3.2.1. Emergence of MEMS Technology; Rapid Rise of Unmanned Vehicles in Both Defense and Civilian Applications
- 3.3. Market Restrains
- 3.3.1. Integration Drift Error is a Major Concern in Navigation Systems
- 3.4. Market Trends
- 3.4.1. Rise in Demand for Automotive MEMS in the Market
- 4. Market Factor Analysis
- 4.1. Porters Five Forces
- 4.2. Supply/Value Chain
- 4.3. PESTEL analysis
- 4.4. Market Entropy
- 4.5. Patent/Trademark Analysis
- 5. Global Inertial Systems Market in Transportation Analysis, Insights and Forecast, 2020-2032
- 5.1. Market Analysis, Insights and Forecast - by Component
- 5.1.1. Accelerometer
- 5.1.2. Gyroscope
- 5.1.3. Inertial Measurement Systems (IMU)
- 5.1.4. Inertial Navigation Systems (INS)
- 5.1.5. Other Components
- 5.2. Market Analysis, Insights and Forecast - by Region
- 5.2.1. North America
- 5.2.2. Europe
- 5.2.3. Asia Pacific
- 5.2.4. Latin America
- 5.2.5. Middle East and Africa
- 5.1. Market Analysis, Insights and Forecast - by Component
- 6. North America Inertial Systems Market in Transportation Analysis, Insights and Forecast, 2020-2032
- 6.1. Market Analysis, Insights and Forecast - by Component
- 6.1.1. Accelerometer
- 6.1.2. Gyroscope
- 6.1.3. Inertial Measurement Systems (IMU)
- 6.1.4. Inertial Navigation Systems (INS)
- 6.1.5. Other Components
- 6.1. Market Analysis, Insights and Forecast - by Component
- 7. Europe Inertial Systems Market in Transportation Analysis, Insights and Forecast, 2020-2032
- 7.1. Market Analysis, Insights and Forecast - by Component
- 7.1.1. Accelerometer
- 7.1.2. Gyroscope
- 7.1.3. Inertial Measurement Systems (IMU)
- 7.1.4. Inertial Navigation Systems (INS)
- 7.1.5. Other Components
- 7.1. Market Analysis, Insights and Forecast - by Component
- 8. Asia Pacific Inertial Systems Market in Transportation Analysis, Insights and Forecast, 2020-2032
- 8.1. Market Analysis, Insights and Forecast - by Component
- 8.1.1. Accelerometer
- 8.1.2. Gyroscope
- 8.1.3. Inertial Measurement Systems (IMU)
- 8.1.4. Inertial Navigation Systems (INS)
- 8.1.5. Other Components
- 8.1. Market Analysis, Insights and Forecast - by Component
- 9. Latin America Inertial Systems Market in Transportation Analysis, Insights and Forecast, 2020-2032
- 9.1. Market Analysis, Insights and Forecast - by Component
- 9.1.1. Accelerometer
- 9.1.2. Gyroscope
- 9.1.3. Inertial Measurement Systems (IMU)
- 9.1.4. Inertial Navigation Systems (INS)
- 9.1.5. Other Components
- 9.1. Market Analysis, Insights and Forecast - by Component
- 10. Middle East and Africa Inertial Systems Market in Transportation Analysis, Insights and Forecast, 2020-2032
- 10.1. Market Analysis, Insights and Forecast - by Component
- 10.1.1. Accelerometer
- 10.1.2. Gyroscope
- 10.1.3. Inertial Measurement Systems (IMU)
- 10.1.4. Inertial Navigation Systems (INS)
- 10.1.5. Other Components
- 10.1. Market Analysis, Insights and Forecast - by Component
- 11. Competitive Analysis
- 11.1. Global Market Share Analysis 2025
- 11.2. Company Profiles
- 11.2.1 Kearfott Corporation
- 11.2.1.1. Overview
- 11.2.1.2. Products
- 11.2.1.3. SWOT Analysis
- 11.2.1.4. Recent Developments
- 11.2.1.5. Financials (Based on Availability)
- 11.2.2 Honeywell International Inc
- 11.2.2.1. Overview
- 11.2.2.2. Products
- 11.2.2.3. SWOT Analysis
- 11.2.2.4. Recent Developments
- 11.2.2.5. Financials (Based on Availability)
- 11.2.3 Meggitt PLC
- 11.2.3.1. Overview
- 11.2.3.2. Products
- 11.2.3.3. SWOT Analysis
- 11.2.3.4. Recent Developments
- 11.2.3.5. Financials (Based on Availability)
- 11.2.4 Vector NAV
- 11.2.4.1. Overview
- 11.2.4.2. Products
- 11.2.4.3. SWOT Analysis
- 11.2.4.4. Recent Developments
- 11.2.4.5. Financials (Based on Availability)
- 11.2.5 Bosch Sensortec GmbH
- 11.2.5.1. Overview
- 11.2.5.2. Products
- 11.2.5.3. SWOT Analysis
- 11.2.5.4. Recent Developments
- 11.2.5.5. Financials (Based on Availability)
- 11.2.6 Rockwell Collins
- 11.2.6.1. Overview
- 11.2.6.2. Products
- 11.2.6.3. SWOT Analysis
- 11.2.6.4. Recent Developments
- 11.2.6.5. Financials (Based on Availability)
- 11.2.7 KVH Industries Inc
- 11.2.7.1. Overview
- 11.2.7.2. Products
- 11.2.7.3. SWOT Analysis
- 11.2.7.4. Recent Developments
- 11.2.7.5. Financials (Based on Availability)
- 11.2.8 Invensense Inc
- 11.2.8.1. Overview
- 11.2.8.2. Products
- 11.2.8.3. SWOT Analysis
- 11.2.8.4. Recent Developments
- 11.2.8.5. Financials (Based on Availability)
- 11.2.9 Epson Europe Electronic
- 11.2.9.1. Overview
- 11.2.9.2. Products
- 11.2.9.3. SWOT Analysis
- 11.2.9.4. Recent Developments
- 11.2.9.5. Financials (Based on Availability)
- 11.2.10 Thames Group
- 11.2.10.1. Overview
- 11.2.10.2. Products
- 11.2.10.3. SWOT Analysis
- 11.2.10.4. Recent Developments
- 11.2.10.5. Financials (Based on Availability)
- 11.2.11 ST Microelectronics
- 11.2.11.1. Overview
- 11.2.11.2. Products
- 11.2.11.3. SWOT Analysis
- 11.2.11.4. Recent Developments
- 11.2.11.5. Financials (Based on Availability)
- 11.2.12 Silicon Sensing Systems Ltd
- 11.2.12.1. Overview
- 11.2.12.2. Products
- 11.2.12.3. SWOT Analysis
- 11.2.12.4. Recent Developments
- 11.2.12.5. Financials (Based on Availability)
- 11.2.13 Ixbluesas
- 11.2.13.1. Overview
- 11.2.13.2. Products
- 11.2.13.3. SWOT Analysis
- 11.2.13.4. Recent Developments
- 11.2.13.5. Financials (Based on Availability)
- 11.2.14 Analog Devices Inc
- 11.2.14.1. Overview
- 11.2.14.2. Products
- 11.2.14.3. SWOT Analysis
- 11.2.14.4. Recent Developments
- 11.2.14.5. Financials (Based on Availability)
- 11.2.15 Northrop Grumman Corporation
- 11.2.15.1. Overview
- 11.2.15.2. Products
- 11.2.15.3. SWOT Analysis
- 11.2.15.4. Recent Developments
- 11.2.15.5. Financials (Based on Availability)
- 11.2.16 Safran Group
- 11.2.16.1. Overview
- 11.2.16.2. Products
- 11.2.16.3. SWOT Analysis
- 11.2.16.4. Recent Developments
- 11.2.16.5. Financials (Based on Availability)
- 11.2.17 UTC Aerospace Systems
- 11.2.17.1. Overview
- 11.2.17.2. Products
- 11.2.17.3. SWOT Analysis
- 11.2.17.4. Recent Developments
- 11.2.17.5. Financials (Based on Availability)
- 11.2.1 Kearfott Corporation
List of Figures
- Figure 1: Global Inertial Systems Market in Transportation Revenue Breakdown (billion, %) by Region 2025 & 2033
- Figure 2: North America Inertial Systems Market in Transportation Revenue (billion), by Component 2025 & 2033
- Figure 3: North America Inertial Systems Market in Transportation Revenue Share (%), by Component 2025 & 2033
- Figure 4: North America Inertial Systems Market in Transportation Revenue (billion), by Country 2025 & 2033
- Figure 5: North America Inertial Systems Market in Transportation Revenue Share (%), by Country 2025 & 2033
- Figure 6: Europe Inertial Systems Market in Transportation Revenue (billion), by Component 2025 & 2033
- Figure 7: Europe Inertial Systems Market in Transportation Revenue Share (%), by Component 2025 & 2033
- Figure 8: Europe Inertial Systems Market in Transportation Revenue (billion), by Country 2025 & 2033
- Figure 9: Europe Inertial Systems Market in Transportation Revenue Share (%), by Country 2025 & 2033
- Figure 10: Asia Pacific Inertial Systems Market in Transportation Revenue (billion), by Component 2025 & 2033
- Figure 11: Asia Pacific Inertial Systems Market in Transportation Revenue Share (%), by Component 2025 & 2033
- Figure 12: Asia Pacific Inertial Systems Market in Transportation Revenue (billion), by Country 2025 & 2033
- Figure 13: Asia Pacific Inertial Systems Market in Transportation Revenue Share (%), by Country 2025 & 2033
- Figure 14: Latin America Inertial Systems Market in Transportation Revenue (billion), by Component 2025 & 2033
- Figure 15: Latin America Inertial Systems Market in Transportation Revenue Share (%), by Component 2025 & 2033
- Figure 16: Latin America Inertial Systems Market in Transportation Revenue (billion), by Country 2025 & 2033
- Figure 17: Latin America Inertial Systems Market in Transportation Revenue Share (%), by Country 2025 & 2033
- Figure 18: Middle East and Africa Inertial Systems Market in Transportation Revenue (billion), by Component 2025 & 2033
- Figure 19: Middle East and Africa Inertial Systems Market in Transportation Revenue Share (%), by Component 2025 & 2033
- Figure 20: Middle East and Africa Inertial Systems Market in Transportation Revenue (billion), by Country 2025 & 2033
- Figure 21: Middle East and Africa Inertial Systems Market in Transportation Revenue Share (%), by Country 2025 & 2033
List of Tables
- Table 1: Global Inertial Systems Market in Transportation Revenue billion Forecast, by Component 2020 & 2033
- Table 2: Global Inertial Systems Market in Transportation Revenue billion Forecast, by Region 2020 & 2033
- Table 3: Global Inertial Systems Market in Transportation Revenue billion Forecast, by Component 2020 & 2033
- Table 4: Global Inertial Systems Market in Transportation Revenue billion Forecast, by Country 2020 & 2033
- Table 5: Global Inertial Systems Market in Transportation Revenue billion Forecast, by Component 2020 & 2033
- Table 6: Global Inertial Systems Market in Transportation Revenue billion Forecast, by Country 2020 & 2033
- Table 7: Global Inertial Systems Market in Transportation Revenue billion Forecast, by Component 2020 & 2033
- Table 8: Global Inertial Systems Market in Transportation Revenue billion Forecast, by Country 2020 & 2033
- Table 9: Global Inertial Systems Market in Transportation Revenue billion Forecast, by Component 2020 & 2033
- Table 10: Global Inertial Systems Market in Transportation Revenue billion Forecast, by Country 2020 & 2033
- Table 11: Global Inertial Systems Market in Transportation Revenue billion Forecast, by Component 2020 & 2033
- Table 12: Global Inertial Systems Market in Transportation Revenue billion Forecast, by Country 2020 & 2033
Frequently Asked Questions
1. What is the projected Compound Annual Growth Rate (CAGR) of the Inertial Systems Market in Transportation?
The projected CAGR is approximately 15.87%.
2. Which companies are prominent players in the Inertial Systems Market in Transportation?
Key companies in the market include Kearfott Corporation, Honeywell International Inc, Meggitt PLC, Vector NAV, Bosch Sensortec GmbH, Rockwell Collins, KVH Industries Inc, Invensense Inc, Epson Europe Electronic, Thames Group, ST Microelectronics, Silicon Sensing Systems Ltd, Ixbluesas, Analog Devices Inc, Northrop Grumman Corporation, Safran Group, UTC Aerospace Systems.
3. What are the main segments of the Inertial Systems Market in Transportation?
The market segments include Component.
4. Can you provide details about the market size?
The market size is estimated to be USD 6.45 billion as of 2022.
5. What are some drivers contributing to market growth?
Emergence of MEMS Technology; Rapid Rise of Unmanned Vehicles in Both Defense and Civilian Applications.
6. What are the notable trends driving market growth?
Rise in Demand for Automotive MEMS in the Market.
7. Are there any restraints impacting market growth?
Integration Drift Error is a Major Concern in Navigation Systems.
8. Can you provide examples of recent developments in the market?
January 2021- Honeywell, with funding from the U.S. Defense Advanced Research Projects Agency (DARPA), is creating the next generation of inertial sensor technology that will be used in both commercial and defense navigation applications. Recently, Honeywell labs have shown the new sensors to be greater than an order of magnitude more accurate than Honeywell's HG1930 inertial measurement unit (IMU) product, a tactical-grade product with more than 150,000 units currently in use.
9. What pricing options are available for accessing the report?
Pricing options include single-user, multi-user, and enterprise licenses priced at USD 3800, USD 4500, and USD 5800 respectively.
10. Is the market size provided in terms of value or volume?
The market size is provided in terms of value, measured in billion.
11. Are there any specific market keywords associated with the report?
Yes, the market keyword associated with the report is "Inertial Systems Market in Transportation," which aids in identifying and referencing the specific market segment covered.
12. How do I determine which pricing option suits my needs best?
The pricing options vary based on user requirements and access needs. Individual users may opt for single-user licenses, while businesses requiring broader access may choose multi-user or enterprise licenses for cost-effective access to the report.
13. Are there any additional resources or data provided in the Inertial Systems Market in Transportation report?
While the report offers comprehensive insights, it's advisable to review the specific contents or supplementary materials provided to ascertain if additional resources or data are available.
14. How can I stay updated on further developments or reports in the Inertial Systems Market in Transportation?
To stay informed about further developments, trends, and reports in the Inertial Systems Market in Transportation, consider subscribing to industry newsletters, following relevant companies and organizations, or regularly checking reputable industry news sources and publications.
Methodology
Step 1 - Identification of Relevant Samples Size from Population Database


Step 2 - Approaches for Defining Global Market Size (Value, Volume* & Price*)

Note*: In applicable scenarios
Step 3 - Data Sources
Primary Research
- Web Analytics
- Survey Reports
- Research Institute
- Latest Research Reports
- Opinion Leaders
Secondary Research
- Annual Reports
- White Paper
- Latest Press Release
- Industry Association
- Paid Database
- Investor Presentations

Step 4 - Data Triangulation
Involves using different sources of information in order to increase the validity of a study
These sources are likely to be stakeholders in a program - participants, other researchers, program staff, other community members, and so on.
Then we put all data in single framework & apply various statistical tools to find out the dynamic on the market.
During the analysis stage, feedback from the stakeholder groups would be compared to determine areas of agreement as well as areas of divergence