

Key Insights
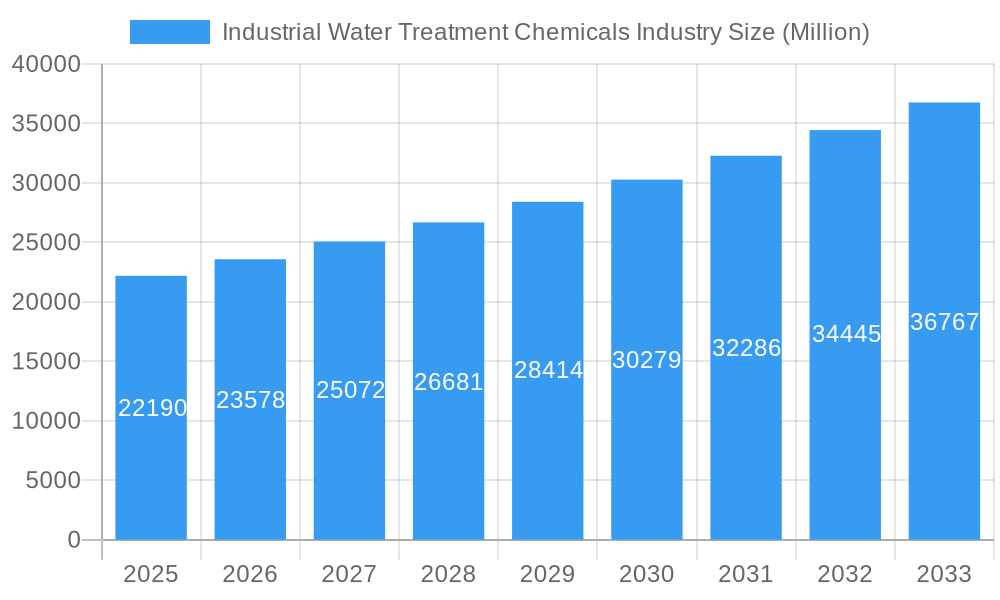
The Industrial Water Treatment Chemicals market is experiencing robust growth, projected to reach \$22.19 billion in 2025 and exhibiting a Compound Annual Growth Rate (CAGR) of 6.04% from 2025 to 2033. This expansion is driven by several key factors. Stringent environmental regulations globally are mandating stricter water quality standards across various industries, particularly manufacturing, power generation, and oil & gas. This necessitates increased usage of water treatment chemicals for effective purification and wastewater management. Furthermore, the growing awareness of water scarcity and the need for water reuse and recycling are significantly boosting market demand. Technological advancements in water treatment technologies, including the development of more efficient and sustainable chemicals, are also contributing to market growth. Major players like BWA Water Additives, Chemifloc LTD, Kemira, Kurita Water Industries Ltd, Lenntech B.V., Lonza, DuPont de Nemours Inc, Ecolab, SNF, Solenis, and SUEZ are actively shaping the market landscape through innovation and strategic acquisitions. The market is segmented by chemical type (coagulants, flocculants, biocides, etc.), application (cooling water treatment, boiler water treatment, etc.), and geography. Competitive rivalry is intense, with companies focusing on product differentiation, cost optimization, and expanding their geographic reach to maintain market share.
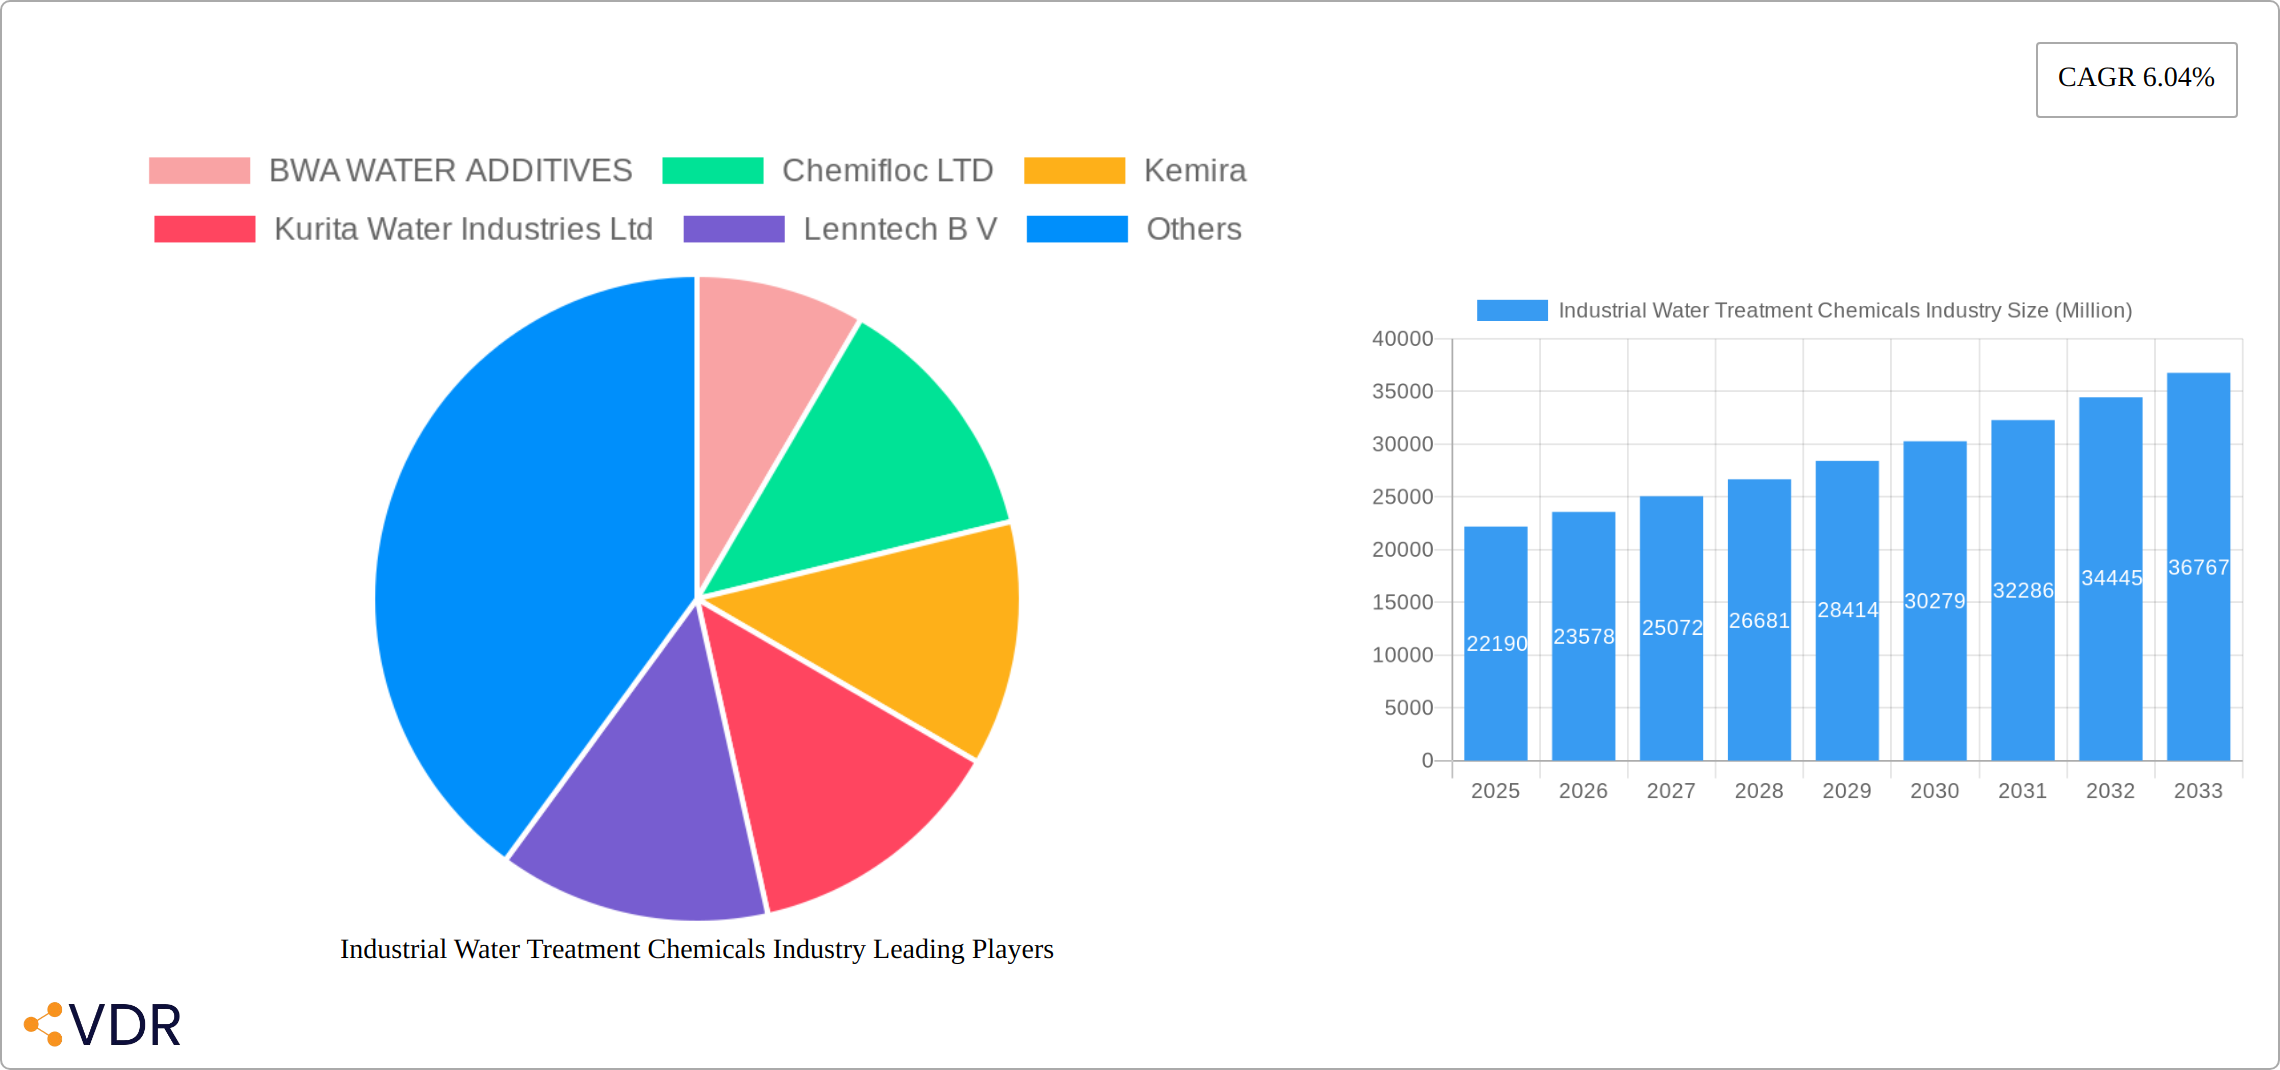
Industrial Water Treatment Chemicals Industry Market Size (In Billion)
The forecast period from 2025 to 2033 anticipates continued growth fueled by expanding industrialization, particularly in developing economies. However, challenges such as fluctuating raw material prices and the potential for stricter environmental regulations could impact market dynamics. Nevertheless, the long-term outlook remains positive, driven by the increasing demand for clean and sustainable water management practices. Market players are increasingly focusing on developing environmentally friendly and cost-effective solutions to address the growing concerns regarding sustainability and operational costs. This trend is expected to drive innovation and further fuel market growth in the coming years. The development of advanced water treatment technologies and the adoption of circular economy principles are expected to significantly influence the market trajectory.
Industrial Water Treatment Chemicals Industry Company Market Share
Industrial Water Treatment Chemicals Market Report: 2019-2033
This comprehensive report provides an in-depth analysis of the Industrial Water Treatment Chemicals market, encompassing market dynamics, growth trends, regional insights, product landscapes, and key player strategies. The report covers the period 2019-2033, with a focus on the 2025-2033 forecast period. The study includes detailed profiles of major players, including BWA WATER ADDITIVES, Chemifloc LTD, Kemira, Kurita Water Industries Ltd, Lenntech B V, Lonza, DuPont de Nemours Inc, Ecolab, SNF, Solenis, and SUEZ (list not exhaustive). This report is an essential resource for industry professionals, investors, and anyone seeking a comprehensive understanding of this dynamic market. The market value is presented in Million USD.
Industrial Water Treatment Chemicals Industry Market Dynamics & Structure
The industrial water treatment chemicals market is characterized by moderate concentration, with a few major players holding significant market share. Technological innovation, driven by stricter environmental regulations and the need for improved water efficiency, is a key market driver. The market also faces challenges from the availability of competitive product substitutes and fluctuating raw material prices. Mergers and acquisitions (M&A) activity is frequent, shaping the competitive landscape and driving consolidation. The end-user demographics are diverse, encompassing various industries like power generation, manufacturing, and food & beverage.
- Market Concentration: Moderately concentrated, with top 5 players holding approximately xx% of the market share in 2024.
- Technological Innovation: Focus on sustainable and environmentally friendly chemicals, automation, and advanced treatment technologies.
- Regulatory Frameworks: Stringent environmental regulations driving demand for advanced treatment solutions.
- Competitive Product Substitutes: Increased competition from alternative technologies (e.g., membrane filtration) and bio-based solutions.
- End-User Demographics: Diverse end-users, including power generation (xx%), manufacturing (xx%), and food & beverage (xx%).
- M&A Trends: High M&A activity, with xx deals recorded between 2019 and 2024, driven by expansion strategies and technological acquisition.
Industrial Water Treatment Chemicals Industry Growth Trends & Insights
The industrial water treatment chemicals market experienced steady growth during the historical period (2019-2024), driven by increasing industrialization, rising water scarcity, and stringent environmental regulations. The market size in 2024 was estimated at USD xx million, and it is projected to grow at a Compound Annual Growth Rate (CAGR) of xx% during the forecast period (2025-2033), reaching USD xx million by 2033. This growth is fuelled by increasing adoption of advanced water treatment technologies, rising demand from emerging economies, and growing focus on water reuse and recycling. Technological disruptions, particularly in areas like nanotechnology and AI-powered water management, are expected to further accelerate market growth. Changing consumer behavior, emphasizing sustainability and environmental responsibility, also plays a significant role. Market penetration is expected to increase from xx% in 2024 to xx% by 2033.
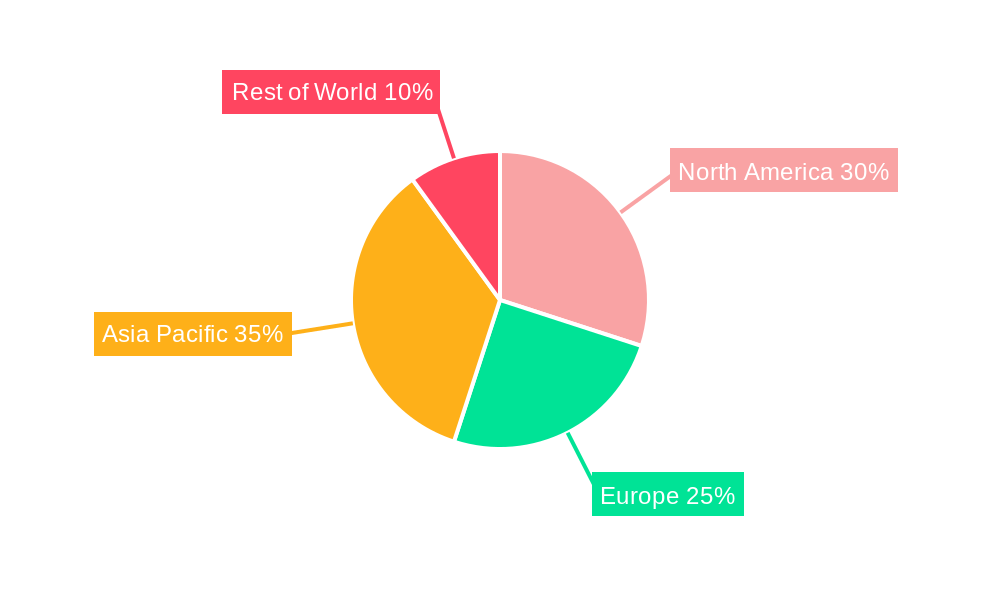
Dominant Regions, Countries, or Segments in Industrial Water Treatment Chemicals Industry
The industrial water treatment chemicals market is currently dominated by North America and Europe. This leadership stems from several factors: stringent environmental regulations enforcing efficient water management, robust industrial infrastructure creating high demand, and a heightened awareness of water conservation among businesses and consumers. However, the Asia-Pacific region is poised for the most significant growth in the coming years. This projected expansion is fueled by rapid industrialization, accelerating urbanization, and substantial investments in upgrading water infrastructure to meet the demands of a burgeoning population and expanding industrial base. Market segmentation reveals that municipal water treatment currently holds the largest market share, followed by industrial water treatment and the oil & gas sector. Precise market share figures for each segment are available upon request.
- North America: A robust regulatory landscape, coupled with advanced infrastructure and a strong emphasis on water conservation, positions North America as a key market leader.
- Europe: Stringent environmental regulations and a mature industrial base contribute to Europe's significant market presence. Emphasis on sustainability further drives demand for innovative and eco-friendly solutions.
- Asia-Pacific: Rapid industrial and urban expansion, coupled with significant investment in water infrastructure projects, fuels substantial growth potential in the Asia-Pacific region. This region represents a key area for future market expansion.
- Key Drivers: The market is driven by a confluence of factors including increasingly stringent environmental regulations globally, consistent industrial growth, growing water scarcity and stress in many regions necessitating water reuse and recycling initiatives, and proactive government support through targeted initiatives and policies.
Industrial Water Treatment Chemicals Industry Product Landscape
The industrial water treatment chemicals market is characterized by a diverse range of products designed to address various water treatment needs. These include coagulants, flocculants, disinfectants, scale inhibitors, corrosion inhibitors, and biocides. A key trend is the development of eco-friendly, high-performance chemicals that deliver improved efficiency while minimizing environmental impact. This innovation leverages advancements in nanotechnology, bio-based formulations, and the creation of tailored solutions to meet the specific requirements of diverse industrial applications. The competitive landscape emphasizes unique selling propositions focusing on enhanced performance characteristics, a reduced environmental footprint, and demonstrable cost-effectiveness.
Key Drivers, Barriers & Challenges in Industrial Water Treatment Chemicals Industry
Key Drivers:
- Stringent Environmental Regulations: Globally increasing pressure to adopt efficient and sustainable water treatment solutions is a primary driver of market growth.
- Industrialization and Urbanization: The continuous expansion of industrial and urban areas directly translates to a rising demand for robust and reliable water treatment capabilities.
- Water Scarcity and Stress: The growing scarcity of water resources in many regions is accelerating the adoption of water reuse and recycling technologies, creating significant opportunities in the market.
Challenges and Restraints:
- Fluctuating Raw Material Prices: Volatility in raw material costs significantly impacts production expenses and overall profitability, posing a challenge to market stability.
- Supply Chain Disruptions: Geopolitical instability and resource constraints frequently disrupt supply chains, impacting production timelines and market reliability.
- Intense Competition: The market is characterized by intense competition among both established players and new entrants, requiring continuous innovation and adaptation.
- Regulatory Hurdles: Navigating varying regulatory landscapes and compliance requirements across different regions presents a significant hurdle for businesses operating in this sector.
Emerging Opportunities in Industrial Water Treatment Chemicals Industry
- Emerging Economies: The rising demand for effective water treatment solutions in developing nations presents substantial growth opportunities.
- Sustainable Technologies: The increasing focus on sustainable and environmentally friendly water treatment technologies is driving innovation and market expansion.
- Specialized Applications: The development of innovative applications for industrial water treatment in niche sectors like pharmaceuticals and microelectronics presents unique opportunities for specialized chemical solutions.
- Water Reuse and Recycling: Growing interest in water reuse and recycling technologies is creating a significant market for chemicals supporting these processes.
Growth Accelerators in the Industrial Water Treatment Chemicals Industry Industry
Several key factors are accelerating growth within the industrial water treatment chemicals industry. Technological advancements in water treatment processes, such as membrane filtration and advanced oxidation processes (AOPs), are significantly enhancing treatment efficiency and driving market expansion. Strategic partnerships and collaborations between chemical manufacturers and water treatment companies are fostering innovation and facilitating market penetration. Furthermore, supportive government initiatives promoting water conservation and sustainable water management are creating a favorable regulatory environment, stimulating investment and growth within the sector.
Key Players Shaping the Industrial Water Treatment Chemicals Market
- BWA WATER ADDITIVES
- Chemifloc LTD
- Kemira
- Kurita Water Industries Ltd
- Lenntech B V
- Lonza
- DuPont de Nemours Inc
- Ecolab
- SNF
- Solenis
- SUEZ
Notable Milestones in Industrial Water Treatment Chemicals Industry Sector
- March 2023: Solenis acquired Diversey for USD 4.6 billion, significantly expanding its market presence in industrial water treatment.
- January 2023: Shrieve Chemical Company acquired Chem One, strengthening its position in the distribution of industrial chemicals, including those for water treatment.
In-Depth Industrial Water Treatment Chemicals Industry Market Outlook
The industrial water treatment chemicals market is poised for continued growth, driven by sustained demand from various industrial sectors and a strong focus on sustainable water management practices. Strategic investments in research and development, coupled with expansion into emerging markets, will further shape the market landscape. Companies with a strong focus on innovation and sustainability are well-positioned to capitalize on emerging opportunities and drive future growth.
Industrial Water Treatment Chemicals Industry Segmentation
-
1. Product Type
- 1.1. Antifoams
- 1.2. Oxygen Scavengers
- 1.3. Corrosion Inhibitors
- 1.4. Biocides and Disinfactants
- 1.5. Oxidants
- 1.6. pH Conditioners
- 1.7. Sludge Conditioners
- 1.8. Scale inhibitors
- 1.9. Other Product Types
-
2. End-user Industry
- 2.1. Oil and Gas
- 2.2. Power
- 2.3. Paper
- 2.4. Metal and mining
- 2.5. Chemical
- 2.6. Other End-user Industries
Industrial Water Treatment Chemicals Industry Segmentation By Geography
-
1. North America
- 1.1. United States
- 1.2. Mexico
- 1.3. Canada
-
2. Europe
- 2.1. Germany
- 2.2. United Kingdom
- 2.3. France
- 2.4. Italy
- 2.5. Rest of Europe
-
3. Asia Pacific
- 3.1. China
- 3.2. India
- 3.3. Japan
- 3.4. South Korea
- 3.5. Rest of Asia Pacific
-
4. South America
- 4.1. Brazil
- 4.2. Argentina
- 4.3. Rest of South America
-
5. Middle East and Africa
- 5.1. Saudi Arabia
- 5.2. South Africa
- 5.3. United Arab Emirates
- 5.4. Rest of Middle East and Africa
Industrial Water Treatment Chemicals Industry Regional Market Share
Geographic Coverage of Industrial Water Treatment Chemicals Industry
Industrial Water Treatment Chemicals Industry REPORT HIGHLIGHTS
| Aspects | Details |
|---|---|
| Study Period | 2020-2034 |
| Base Year | 2025 |
| Estimated Year | 2026 |
| Forecast Period | 2026-2034 |
| Historical Period | 2020-2025 |
| Growth Rate | CAGR of 6.04% from 2020-2034 |
| Segmentation |
|
Table of Contents
- 1. Introduction
- 1.1. Research Scope
- 1.2. Market Segmentation
- 1.3. Research Objective
- 1.4. Definitions and Assumptions
- 2. Executive Summary
- 2.1. Market Snapshot
- 3. Market Dynamics
- 3.1. Market Drivers
- 3.2. Market Restrains
- 3.3. Market Trends
- 3.4. Market Opportunities
- 4. Market Factor Analysis
- 4.1. Porters Five Forces
- 4.1.1. Bargaining Power of Suppliers
- 4.1.2. Bargaining Power of Buyers
- 4.1.3. Threat of New Entrants
- 4.1.4. Threat of Substitutes
- 4.1.5. Competitive Rivalry
- 4.2. PESTEL analysis
- 4.3. BCG Analysis
- 4.3.1. Stars (High Growth, High Market Share)
- 4.3.2. Cash Cows (Low Growth, High Market Share)
- 4.3.3. Question Mark (High Growth, Low Market Share)
- 4.3.4. Dogs (Low Growth, Low Market Share)
- 4.4. Ansoff Matrix Analysis
- 4.5. Supply Chain Analysis
- 4.6. Regulatory Landscape
- 4.7. Current Market Potential and Opportunity Assessment (TAM–SAM–SOM Framework)
- 4.8. VDR Analyst Note
- 4.1. Porters Five Forces
- 5. Market Analysis, Insights and Forecast 2021-2033
- 5.1. Market Analysis, Insights and Forecast - by Product Type
- 5.1.1. Antifoams
- 5.1.2. Oxygen Scavengers
- 5.1.3. Corrosion Inhibitors
- 5.1.4. Biocides and Disinfactants
- 5.1.5. Oxidants
- 5.1.6. pH Conditioners
- 5.1.7. Sludge Conditioners
- 5.1.8. Scale inhibitors
- 5.1.9. Other Product Types
- 5.2. Market Analysis, Insights and Forecast - by End-user Industry
- 5.2.1. Oil and Gas
- 5.2.2. Power
- 5.2.3. Paper
- 5.2.4. Metal and mining
- 5.2.5. Chemical
- 5.2.6. Other End-user Industries
- 5.3. Market Analysis, Insights and Forecast - by Region
- 5.3.1. North America
- 5.3.2. Europe
- 5.3.3. Asia Pacific
- 5.3.4. South America
- 5.3.5. Middle East and Africa
- 5.1. Market Analysis, Insights and Forecast - by Product Type
- 6. Global Industrial Water Treatment Chemicals Industry Analysis, Insights and Forecast, 2021-2033
- 6.1. Market Analysis, Insights and Forecast - by Product Type
- 6.1.1. Antifoams
- 6.1.2. Oxygen Scavengers
- 6.1.3. Corrosion Inhibitors
- 6.1.4. Biocides and Disinfactants
- 6.1.5. Oxidants
- 6.1.6. pH Conditioners
- 6.1.7. Sludge Conditioners
- 6.1.8. Scale inhibitors
- 6.1.9. Other Product Types
- 6.2. Market Analysis, Insights and Forecast - by End-user Industry
- 6.2.1. Oil and Gas
- 6.2.2. Power
- 6.2.3. Paper
- 6.2.4. Metal and mining
- 6.2.5. Chemical
- 6.2.6. Other End-user Industries
- 6.1. Market Analysis, Insights and Forecast - by Product Type
- 7. North America Industrial Water Treatment Chemicals Industry Analysis, Insights and Forecast, 2021-2033
- 7.1. Market Analysis, Insights and Forecast - by Product Type
- 7.1.1. Antifoams
- 7.1.2. Oxygen Scavengers
- 7.1.3. Corrosion Inhibitors
- 7.1.4. Biocides and Disinfactants
- 7.1.5. Oxidants
- 7.1.6. pH Conditioners
- 7.1.7. Sludge Conditioners
- 7.1.8. Scale inhibitors
- 7.1.9. Other Product Types
- 7.2. Market Analysis, Insights and Forecast - by End-user Industry
- 7.2.1. Oil and Gas
- 7.2.2. Power
- 7.2.3. Paper
- 7.2.4. Metal and mining
- 7.2.5. Chemical
- 7.2.6. Other End-user Industries
- 7.1. Market Analysis, Insights and Forecast - by Product Type
- 8. Europe Industrial Water Treatment Chemicals Industry Analysis, Insights and Forecast, 2021-2033
- 8.1. Market Analysis, Insights and Forecast - by Product Type
- 8.1.1. Antifoams
- 8.1.2. Oxygen Scavengers
- 8.1.3. Corrosion Inhibitors
- 8.1.4. Biocides and Disinfactants
- 8.1.5. Oxidants
- 8.1.6. pH Conditioners
- 8.1.7. Sludge Conditioners
- 8.1.8. Scale inhibitors
- 8.1.9. Other Product Types
- 8.2. Market Analysis, Insights and Forecast - by End-user Industry
- 8.2.1. Oil and Gas
- 8.2.2. Power
- 8.2.3. Paper
- 8.2.4. Metal and mining
- 8.2.5. Chemical
- 8.2.6. Other End-user Industries
- 8.1. Market Analysis, Insights and Forecast - by Product Type
- 9. Asia Pacific Industrial Water Treatment Chemicals Industry Analysis, Insights and Forecast, 2021-2033
- 9.1. Market Analysis, Insights and Forecast - by Product Type
- 9.1.1. Antifoams
- 9.1.2. Oxygen Scavengers
- 9.1.3. Corrosion Inhibitors
- 9.1.4. Biocides and Disinfactants
- 9.1.5. Oxidants
- 9.1.6. pH Conditioners
- 9.1.7. Sludge Conditioners
- 9.1.8. Scale inhibitors
- 9.1.9. Other Product Types
- 9.2. Market Analysis, Insights and Forecast - by End-user Industry
- 9.2.1. Oil and Gas
- 9.2.2. Power
- 9.2.3. Paper
- 9.2.4. Metal and mining
- 9.2.5. Chemical
- 9.2.6. Other End-user Industries
- 9.1. Market Analysis, Insights and Forecast - by Product Type
- 10. South America Industrial Water Treatment Chemicals Industry Analysis, Insights and Forecast, 2021-2033
- 10.1. Market Analysis, Insights and Forecast - by Product Type
- 10.1.1. Antifoams
- 10.1.2. Oxygen Scavengers
- 10.1.3. Corrosion Inhibitors
- 10.1.4. Biocides and Disinfactants
- 10.1.5. Oxidants
- 10.1.6. pH Conditioners
- 10.1.7. Sludge Conditioners
- 10.1.8. Scale inhibitors
- 10.1.9. Other Product Types
- 10.2. Market Analysis, Insights and Forecast - by End-user Industry
- 10.2.1. Oil and Gas
- 10.2.2. Power
- 10.2.3. Paper
- 10.2.4. Metal and mining
- 10.2.5. Chemical
- 10.2.6. Other End-user Industries
- 10.1. Market Analysis, Insights and Forecast - by Product Type
- 11. Middle East and Africa Industrial Water Treatment Chemicals Industry Analysis, Insights and Forecast, 2021-2033
- 11.1. Market Analysis, Insights and Forecast - by Product Type
- 11.1.1. Antifoams
- 11.1.2. Oxygen Scavengers
- 11.1.3. Corrosion Inhibitors
- 11.1.4. Biocides and Disinfactants
- 11.1.5. Oxidants
- 11.1.6. pH Conditioners
- 11.1.7. Sludge Conditioners
- 11.1.8. Scale inhibitors
- 11.1.9. Other Product Types
- 11.2. Market Analysis, Insights and Forecast - by End-user Industry
- 11.2.1. Oil and Gas
- 11.2.2. Power
- 11.2.3. Paper
- 11.2.4. Metal and mining
- 11.2.5. Chemical
- 11.2.6. Other End-user Industries
- 11.1. Market Analysis, Insights and Forecast - by Product Type
- 12. Competitive Analysis
- 12.1. Company Profiles
- 12.1.1 BWA WATER ADDITIVES
- 12.1.1.1. Company Overview
- 12.1.1.2. Products
- 12.1.1.3. Company Financials
- 12.1.1.4. SWOT Analysis
- 12.1.2 Chemifloc LTD
- 12.1.2.1. Company Overview
- 12.1.2.2. Products
- 12.1.2.3. Company Financials
- 12.1.2.4. SWOT Analysis
- 12.1.3 Kemira
- 12.1.3.1. Company Overview
- 12.1.3.2. Products
- 12.1.3.3. Company Financials
- 12.1.3.4. SWOT Analysis
- 12.1.4 Kurita Water Industries Ltd
- 12.1.4.1. Company Overview
- 12.1.4.2. Products
- 12.1.4.3. Company Financials
- 12.1.4.4. SWOT Analysis
- 12.1.5 Lenntech B V
- 12.1.5.1. Company Overview
- 12.1.5.2. Products
- 12.1.5.3. Company Financials
- 12.1.5.4. SWOT Analysis
- 12.1.6 Lonza
- 12.1.6.1. Company Overview
- 12.1.6.2. Products
- 12.1.6.3. Company Financials
- 12.1.6.4. SWOT Analysis
- 12.1.7 DuPont de Nemours Inc
- 12.1.7.1. Company Overview
- 12.1.7.2. Products
- 12.1.7.3. Company Financials
- 12.1.7.4. SWOT Analysis
- 12.1.8 Ecolab
- 12.1.8.1. Company Overview
- 12.1.8.2. Products
- 12.1.8.3. Company Financials
- 12.1.8.4. SWOT Analysis
- 12.1.9 SNF
- 12.1.9.1. Company Overview
- 12.1.9.2. Products
- 12.1.9.3. Company Financials
- 12.1.9.4. SWOT Analysis
- 12.1.10 Solenis
- 12.1.10.1. Company Overview
- 12.1.10.2. Products
- 12.1.10.3. Company Financials
- 12.1.10.4. SWOT Analysis
- 12.1.11 SUEZ*List Not Exhaustive
- 12.1.11.1. Company Overview
- 12.1.11.2. Products
- 12.1.11.3. Company Financials
- 12.1.11.4. SWOT Analysis
- 12.1.1 BWA WATER ADDITIVES
- 12.2. Market Entropy
- 12.2.1 Company's Key Areas Served
- 12.2.2 Recent Developments
- 12.3. Company Market Share Analysis 2025
- 12.3.1 Top 5 Companies Market Share Analysis
- 12.3.2 Top 3 Companies Market Share Analysis
- 12.4. List of Potential Customers
- 13. Research Methodology
List of Figures
- Figure 1: Global Industrial Water Treatment Chemicals Industry Revenue Breakdown (Million, %) by Region 2025 & 2033
- Figure 2: Global Industrial Water Treatment Chemicals Industry Volume Breakdown (Billion, %) by Region 2025 & 2033
- Figure 3: North America Industrial Water Treatment Chemicals Industry Revenue (Million), by Product Type 2025 & 2033
- Figure 4: North America Industrial Water Treatment Chemicals Industry Volume (Billion), by Product Type 2025 & 2033
- Figure 5: North America Industrial Water Treatment Chemicals Industry Revenue Share (%), by Product Type 2025 & 2033
- Figure 6: North America Industrial Water Treatment Chemicals Industry Volume Share (%), by Product Type 2025 & 2033
- Figure 7: North America Industrial Water Treatment Chemicals Industry Revenue (Million), by End-user Industry 2025 & 2033
- Figure 8: North America Industrial Water Treatment Chemicals Industry Volume (Billion), by End-user Industry 2025 & 2033
- Figure 9: North America Industrial Water Treatment Chemicals Industry Revenue Share (%), by End-user Industry 2025 & 2033
- Figure 10: North America Industrial Water Treatment Chemicals Industry Volume Share (%), by End-user Industry 2025 & 2033
- Figure 11: North America Industrial Water Treatment Chemicals Industry Revenue (Million), by Country 2025 & 2033
- Figure 12: North America Industrial Water Treatment Chemicals Industry Volume (Billion), by Country 2025 & 2033
- Figure 13: North America Industrial Water Treatment Chemicals Industry Revenue Share (%), by Country 2025 & 2033
- Figure 14: North America Industrial Water Treatment Chemicals Industry Volume Share (%), by Country 2025 & 2033
- Figure 15: Europe Industrial Water Treatment Chemicals Industry Revenue (Million), by Product Type 2025 & 2033
- Figure 16: Europe Industrial Water Treatment Chemicals Industry Volume (Billion), by Product Type 2025 & 2033
- Figure 17: Europe Industrial Water Treatment Chemicals Industry Revenue Share (%), by Product Type 2025 & 2033
- Figure 18: Europe Industrial Water Treatment Chemicals Industry Volume Share (%), by Product Type 2025 & 2033
- Figure 19: Europe Industrial Water Treatment Chemicals Industry Revenue (Million), by End-user Industry 2025 & 2033
- Figure 20: Europe Industrial Water Treatment Chemicals Industry Volume (Billion), by End-user Industry 2025 & 2033
- Figure 21: Europe Industrial Water Treatment Chemicals Industry Revenue Share (%), by End-user Industry 2025 & 2033
- Figure 22: Europe Industrial Water Treatment Chemicals Industry Volume Share (%), by End-user Industry 2025 & 2033
- Figure 23: Europe Industrial Water Treatment Chemicals Industry Revenue (Million), by Country 2025 & 2033
- Figure 24: Europe Industrial Water Treatment Chemicals Industry Volume (Billion), by Country 2025 & 2033
- Figure 25: Europe Industrial Water Treatment Chemicals Industry Revenue Share (%), by Country 2025 & 2033
- Figure 26: Europe Industrial Water Treatment Chemicals Industry Volume Share (%), by Country 2025 & 2033
- Figure 27: Asia Pacific Industrial Water Treatment Chemicals Industry Revenue (Million), by Product Type 2025 & 2033
- Figure 28: Asia Pacific Industrial Water Treatment Chemicals Industry Volume (Billion), by Product Type 2025 & 2033
- Figure 29: Asia Pacific Industrial Water Treatment Chemicals Industry Revenue Share (%), by Product Type 2025 & 2033
- Figure 30: Asia Pacific Industrial Water Treatment Chemicals Industry Volume Share (%), by Product Type 2025 & 2033
- Figure 31: Asia Pacific Industrial Water Treatment Chemicals Industry Revenue (Million), by End-user Industry 2025 & 2033
- Figure 32: Asia Pacific Industrial Water Treatment Chemicals Industry Volume (Billion), by End-user Industry 2025 & 2033
- Figure 33: Asia Pacific Industrial Water Treatment Chemicals Industry Revenue Share (%), by End-user Industry 2025 & 2033
- Figure 34: Asia Pacific Industrial Water Treatment Chemicals Industry Volume Share (%), by End-user Industry 2025 & 2033
- Figure 35: Asia Pacific Industrial Water Treatment Chemicals Industry Revenue (Million), by Country 2025 & 2033
- Figure 36: Asia Pacific Industrial Water Treatment Chemicals Industry Volume (Billion), by Country 2025 & 2033
- Figure 37: Asia Pacific Industrial Water Treatment Chemicals Industry Revenue Share (%), by Country 2025 & 2033
- Figure 38: Asia Pacific Industrial Water Treatment Chemicals Industry Volume Share (%), by Country 2025 & 2033
- Figure 39: South America Industrial Water Treatment Chemicals Industry Revenue (Million), by Product Type 2025 & 2033
- Figure 40: South America Industrial Water Treatment Chemicals Industry Volume (Billion), by Product Type 2025 & 2033
- Figure 41: South America Industrial Water Treatment Chemicals Industry Revenue Share (%), by Product Type 2025 & 2033
- Figure 42: South America Industrial Water Treatment Chemicals Industry Volume Share (%), by Product Type 2025 & 2033
- Figure 43: South America Industrial Water Treatment Chemicals Industry Revenue (Million), by End-user Industry 2025 & 2033
- Figure 44: South America Industrial Water Treatment Chemicals Industry Volume (Billion), by End-user Industry 2025 & 2033
- Figure 45: South America Industrial Water Treatment Chemicals Industry Revenue Share (%), by End-user Industry 2025 & 2033
- Figure 46: South America Industrial Water Treatment Chemicals Industry Volume Share (%), by End-user Industry 2025 & 2033
- Figure 47: South America Industrial Water Treatment Chemicals Industry Revenue (Million), by Country 2025 & 2033
- Figure 48: South America Industrial Water Treatment Chemicals Industry Volume (Billion), by Country 2025 & 2033
- Figure 49: South America Industrial Water Treatment Chemicals Industry Revenue Share (%), by Country 2025 & 2033
- Figure 50: South America Industrial Water Treatment Chemicals Industry Volume Share (%), by Country 2025 & 2033
- Figure 51: Middle East and Africa Industrial Water Treatment Chemicals Industry Revenue (Million), by Product Type 2025 & 2033
- Figure 52: Middle East and Africa Industrial Water Treatment Chemicals Industry Volume (Billion), by Product Type 2025 & 2033
- Figure 53: Middle East and Africa Industrial Water Treatment Chemicals Industry Revenue Share (%), by Product Type 2025 & 2033
- Figure 54: Middle East and Africa Industrial Water Treatment Chemicals Industry Volume Share (%), by Product Type 2025 & 2033
- Figure 55: Middle East and Africa Industrial Water Treatment Chemicals Industry Revenue (Million), by End-user Industry 2025 & 2033
- Figure 56: Middle East and Africa Industrial Water Treatment Chemicals Industry Volume (Billion), by End-user Industry 2025 & 2033
- Figure 57: Middle East and Africa Industrial Water Treatment Chemicals Industry Revenue Share (%), by End-user Industry 2025 & 2033
- Figure 58: Middle East and Africa Industrial Water Treatment Chemicals Industry Volume Share (%), by End-user Industry 2025 & 2033
- Figure 59: Middle East and Africa Industrial Water Treatment Chemicals Industry Revenue (Million), by Country 2025 & 2033
- Figure 60: Middle East and Africa Industrial Water Treatment Chemicals Industry Volume (Billion), by Country 2025 & 2033
- Figure 61: Middle East and Africa Industrial Water Treatment Chemicals Industry Revenue Share (%), by Country 2025 & 2033
- Figure 62: Middle East and Africa Industrial Water Treatment Chemicals Industry Volume Share (%), by Country 2025 & 2033
List of Tables
- Table 1: Global Industrial Water Treatment Chemicals Industry Revenue Million Forecast, by Product Type 2020 & 2033
- Table 2: Global Industrial Water Treatment Chemicals Industry Volume Billion Forecast, by Product Type 2020 & 2033
- Table 3: Global Industrial Water Treatment Chemicals Industry Revenue Million Forecast, by End-user Industry 2020 & 2033
- Table 4: Global Industrial Water Treatment Chemicals Industry Volume Billion Forecast, by End-user Industry 2020 & 2033
- Table 5: Global Industrial Water Treatment Chemicals Industry Revenue Million Forecast, by Region 2020 & 2033
- Table 6: Global Industrial Water Treatment Chemicals Industry Volume Billion Forecast, by Region 2020 & 2033
- Table 7: Global Industrial Water Treatment Chemicals Industry Revenue Million Forecast, by Product Type 2020 & 2033
- Table 8: Global Industrial Water Treatment Chemicals Industry Volume Billion Forecast, by Product Type 2020 & 2033
- Table 9: Global Industrial Water Treatment Chemicals Industry Revenue Million Forecast, by End-user Industry 2020 & 2033
- Table 10: Global Industrial Water Treatment Chemicals Industry Volume Billion Forecast, by End-user Industry 2020 & 2033
- Table 11: Global Industrial Water Treatment Chemicals Industry Revenue Million Forecast, by Country 2020 & 2033
- Table 12: Global Industrial Water Treatment Chemicals Industry Volume Billion Forecast, by Country 2020 & 2033
- Table 13: United States Industrial Water Treatment Chemicals Industry Revenue (Million) Forecast, by Application 2020 & 2033
- Table 14: United States Industrial Water Treatment Chemicals Industry Volume (Billion) Forecast, by Application 2020 & 2033
- Table 15: Mexico Industrial Water Treatment Chemicals Industry Revenue (Million) Forecast, by Application 2020 & 2033
- Table 16: Mexico Industrial Water Treatment Chemicals Industry Volume (Billion) Forecast, by Application 2020 & 2033
- Table 17: Canada Industrial Water Treatment Chemicals Industry Revenue (Million) Forecast, by Application 2020 & 2033
- Table 18: Canada Industrial Water Treatment Chemicals Industry Volume (Billion) Forecast, by Application 2020 & 2033
- Table 19: Global Industrial Water Treatment Chemicals Industry Revenue Million Forecast, by Product Type 2020 & 2033
- Table 20: Global Industrial Water Treatment Chemicals Industry Volume Billion Forecast, by Product Type 2020 & 2033
- Table 21: Global Industrial Water Treatment Chemicals Industry Revenue Million Forecast, by End-user Industry 2020 & 2033
- Table 22: Global Industrial Water Treatment Chemicals Industry Volume Billion Forecast, by End-user Industry 2020 & 2033
- Table 23: Global Industrial Water Treatment Chemicals Industry Revenue Million Forecast, by Country 2020 & 2033
- Table 24: Global Industrial Water Treatment Chemicals Industry Volume Billion Forecast, by Country 2020 & 2033
- Table 25: Germany Industrial Water Treatment Chemicals Industry Revenue (Million) Forecast, by Application 2020 & 2033
- Table 26: Germany Industrial Water Treatment Chemicals Industry Volume (Billion) Forecast, by Application 2020 & 2033
- Table 27: United Kingdom Industrial Water Treatment Chemicals Industry Revenue (Million) Forecast, by Application 2020 & 2033
- Table 28: United Kingdom Industrial Water Treatment Chemicals Industry Volume (Billion) Forecast, by Application 2020 & 2033
- Table 29: France Industrial Water Treatment Chemicals Industry Revenue (Million) Forecast, by Application 2020 & 2033
- Table 30: France Industrial Water Treatment Chemicals Industry Volume (Billion) Forecast, by Application 2020 & 2033
- Table 31: Italy Industrial Water Treatment Chemicals Industry Revenue (Million) Forecast, by Application 2020 & 2033
- Table 32: Italy Industrial Water Treatment Chemicals Industry Volume (Billion) Forecast, by Application 2020 & 2033
- Table 33: Rest of Europe Industrial Water Treatment Chemicals Industry Revenue (Million) Forecast, by Application 2020 & 2033
- Table 34: Rest of Europe Industrial Water Treatment Chemicals Industry Volume (Billion) Forecast, by Application 2020 & 2033
- Table 35: Global Industrial Water Treatment Chemicals Industry Revenue Million Forecast, by Product Type 2020 & 2033
- Table 36: Global Industrial Water Treatment Chemicals Industry Volume Billion Forecast, by Product Type 2020 & 2033
- Table 37: Global Industrial Water Treatment Chemicals Industry Revenue Million Forecast, by End-user Industry 2020 & 2033
- Table 38: Global Industrial Water Treatment Chemicals Industry Volume Billion Forecast, by End-user Industry 2020 & 2033
- Table 39: Global Industrial Water Treatment Chemicals Industry Revenue Million Forecast, by Country 2020 & 2033
- Table 40: Global Industrial Water Treatment Chemicals Industry Volume Billion Forecast, by Country 2020 & 2033
- Table 41: China Industrial Water Treatment Chemicals Industry Revenue (Million) Forecast, by Application 2020 & 2033
- Table 42: China Industrial Water Treatment Chemicals Industry Volume (Billion) Forecast, by Application 2020 & 2033
- Table 43: India Industrial Water Treatment Chemicals Industry Revenue (Million) Forecast, by Application 2020 & 2033
- Table 44: India Industrial Water Treatment Chemicals Industry Volume (Billion) Forecast, by Application 2020 & 2033
- Table 45: Japan Industrial Water Treatment Chemicals Industry Revenue (Million) Forecast, by Application 2020 & 2033
- Table 46: Japan Industrial Water Treatment Chemicals Industry Volume (Billion) Forecast, by Application 2020 & 2033
- Table 47: South Korea Industrial Water Treatment Chemicals Industry Revenue (Million) Forecast, by Application 2020 & 2033
- Table 48: South Korea Industrial Water Treatment Chemicals Industry Volume (Billion) Forecast, by Application 2020 & 2033
- Table 49: Rest of Asia Pacific Industrial Water Treatment Chemicals Industry Revenue (Million) Forecast, by Application 2020 & 2033
- Table 50: Rest of Asia Pacific Industrial Water Treatment Chemicals Industry Volume (Billion) Forecast, by Application 2020 & 2033
- Table 51: Global Industrial Water Treatment Chemicals Industry Revenue Million Forecast, by Product Type 2020 & 2033
- Table 52: Global Industrial Water Treatment Chemicals Industry Volume Billion Forecast, by Product Type 2020 & 2033
- Table 53: Global Industrial Water Treatment Chemicals Industry Revenue Million Forecast, by End-user Industry 2020 & 2033
- Table 54: Global Industrial Water Treatment Chemicals Industry Volume Billion Forecast, by End-user Industry 2020 & 2033
- Table 55: Global Industrial Water Treatment Chemicals Industry Revenue Million Forecast, by Country 2020 & 2033
- Table 56: Global Industrial Water Treatment Chemicals Industry Volume Billion Forecast, by Country 2020 & 2033
- Table 57: Brazil Industrial Water Treatment Chemicals Industry Revenue (Million) Forecast, by Application 2020 & 2033
- Table 58: Brazil Industrial Water Treatment Chemicals Industry Volume (Billion) Forecast, by Application 2020 & 2033
- Table 59: Argentina Industrial Water Treatment Chemicals Industry Revenue (Million) Forecast, by Application 2020 & 2033
- Table 60: Argentina Industrial Water Treatment Chemicals Industry Volume (Billion) Forecast, by Application 2020 & 2033
- Table 61: Rest of South America Industrial Water Treatment Chemicals Industry Revenue (Million) Forecast, by Application 2020 & 2033
- Table 62: Rest of South America Industrial Water Treatment Chemicals Industry Volume (Billion) Forecast, by Application 2020 & 2033
- Table 63: Global Industrial Water Treatment Chemicals Industry Revenue Million Forecast, by Product Type 2020 & 2033
- Table 64: Global Industrial Water Treatment Chemicals Industry Volume Billion Forecast, by Product Type 2020 & 2033
- Table 65: Global Industrial Water Treatment Chemicals Industry Revenue Million Forecast, by End-user Industry 2020 & 2033
- Table 66: Global Industrial Water Treatment Chemicals Industry Volume Billion Forecast, by End-user Industry 2020 & 2033
- Table 67: Global Industrial Water Treatment Chemicals Industry Revenue Million Forecast, by Country 2020 & 2033
- Table 68: Global Industrial Water Treatment Chemicals Industry Volume Billion Forecast, by Country 2020 & 2033
- Table 69: Saudi Arabia Industrial Water Treatment Chemicals Industry Revenue (Million) Forecast, by Application 2020 & 2033
- Table 70: Saudi Arabia Industrial Water Treatment Chemicals Industry Volume (Billion) Forecast, by Application 2020 & 2033
- Table 71: South Africa Industrial Water Treatment Chemicals Industry Revenue (Million) Forecast, by Application 2020 & 2033
- Table 72: South Africa Industrial Water Treatment Chemicals Industry Volume (Billion) Forecast, by Application 2020 & 2033
- Table 73: United Arab Emirates Industrial Water Treatment Chemicals Industry Revenue (Million) Forecast, by Application 2020 & 2033
- Table 74: United Arab Emirates Industrial Water Treatment Chemicals Industry Volume (Billion) Forecast, by Application 2020 & 2033
- Table 75: Rest of Middle East and Africa Industrial Water Treatment Chemicals Industry Revenue (Million) Forecast, by Application 2020 & 2033
- Table 76: Rest of Middle East and Africa Industrial Water Treatment Chemicals Industry Volume (Billion) Forecast, by Application 2020 & 2033
Frequently Asked Questions
1. What is the projected Compound Annual Growth Rate (CAGR) of the Industrial Water Treatment Chemicals Industry?
The projected CAGR is approximately 6.04%.
2. Which companies are prominent players in the Industrial Water Treatment Chemicals Industry?
Key companies in the market include BWA WATER ADDITIVES, Chemifloc LTD, Kemira, Kurita Water Industries Ltd, Lenntech B V, Lonza, DuPont de Nemours Inc, Ecolab, SNF, Solenis, SUEZ*List Not Exhaustive.
3. What are the main segments of the Industrial Water Treatment Chemicals Industry?
The market segments include Product Type, End-user Industry.
4. Can you provide details about the market size?
The market size is estimated to be USD 22.19 Million as of 2022.
5. What are some drivers contributing to market growth?
Increasing Production of Shale Gas in the United States; Growing Production Activities in Chemical and Paper Industry; Other Drivers.
6. What are the notable trends driving market growth?
Power Industry to Dominate the Market.
7. Are there any restraints impacting market growth?
Increasing Production of Shale Gas in the United States; Growing Production Activities in Chemical and Paper Industry; Other Drivers.
8. Can you provide examples of recent developments in the market?
March 2023: Solenis, providing water treatment solutions for municipal and industrial water treatment, announced that it agreed to acquire Diversey, a cleaning solutions company primarily for industrial water treatment, for USD 4.6 billion.
9. What pricing options are available for accessing the report?
Pricing options include single-user, multi-user, and enterprise licenses priced at USD 4750, USD 5250, and USD 8750 respectively.
10. Is the market size provided in terms of value or volume?
The market size is provided in terms of value, measured in Million and volume, measured in Billion.
11. Are there any specific market keywords associated with the report?
Yes, the market keyword associated with the report is "Industrial Water Treatment Chemicals Industry," which aids in identifying and referencing the specific market segment covered.
12. How do I determine which pricing option suits my needs best?
The pricing options vary based on user requirements and access needs. Individual users may opt for single-user licenses, while businesses requiring broader access may choose multi-user or enterprise licenses for cost-effective access to the report.
13. Are there any additional resources or data provided in the Industrial Water Treatment Chemicals Industry report?
While the report offers comprehensive insights, it's advisable to review the specific contents or supplementary materials provided to ascertain if additional resources or data are available.
14. How can I stay updated on further developments or reports in the Industrial Water Treatment Chemicals Industry?
To stay informed about further developments, trends, and reports in the Industrial Water Treatment Chemicals Industry, consider subscribing to industry newsletters, following relevant companies and organizations, or regularly checking reputable industry news sources and publications.
Methodology
Step 1 - Identification of Relevant Samples Size from Population Database


Step 2 - Approaches for Defining Global Market Size (Value, Volume* & Price*)

Note*: In applicable scenarios
Step 3 - Data Sources
Primary Research
- Web Analytics
- Survey Reports
- Research Institute
- Latest Research Reports
- Opinion Leaders
Secondary Research
- Annual Reports
- White Paper
- Latest Press Release
- Industry Association
- Paid Database
- Investor Presentations

Step 4 - Data Triangulation
Involves using different sources of information in order to increase the validity of a study
These sources are likely to be stakeholders in a program - participants, other researchers, program staff, other community members, and so on.
Then we put all data in single framework & apply various statistical tools to find out the dynamic on the market.
During the analysis stage, feedback from the stakeholder groups would be compared to determine areas of agreement as well as areas of divergence