

Key Insights
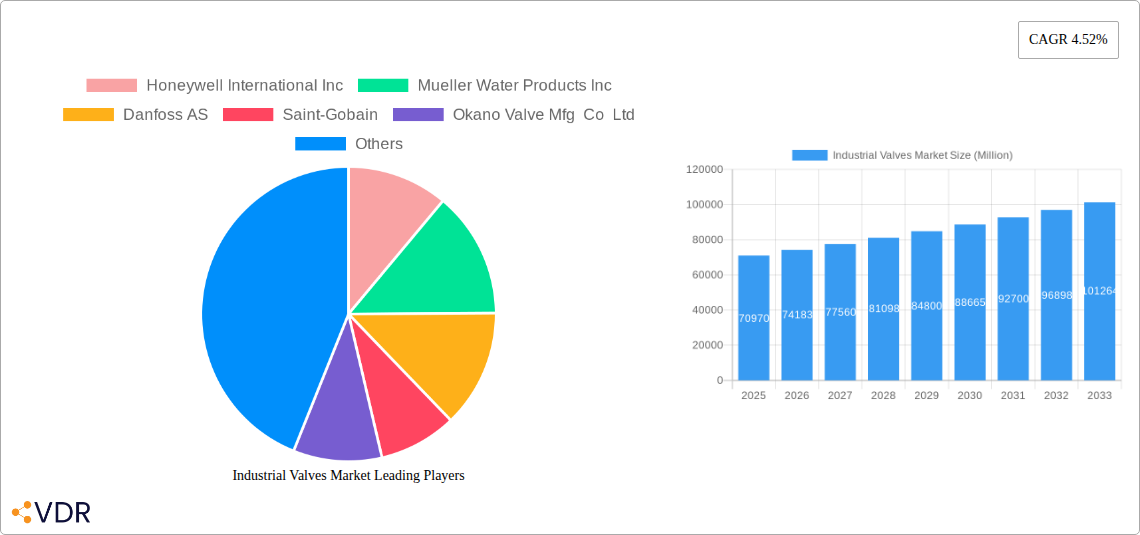
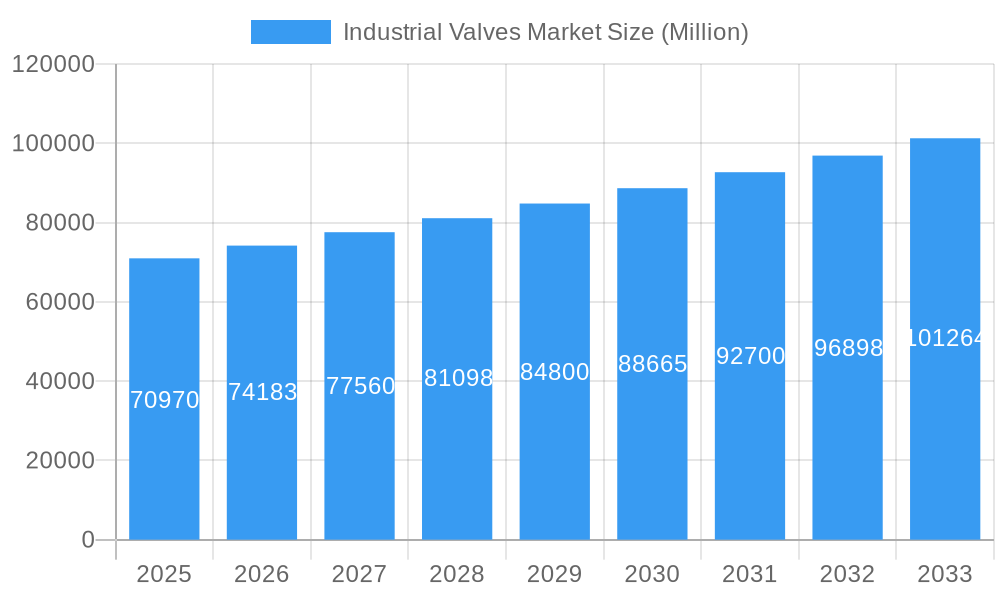
The global industrial valves market, valued at $70.97 billion in 2025, is projected to experience robust growth, driven by a Compound Annual Growth Rate (CAGR) of 4.52% from 2025 to 2033. This expansion is fueled by several key factors. Firstly, the increasing demand for automation and modernization across various industries, including oil and gas, water and wastewater management, and chemicals, necessitates the use of advanced and efficient industrial valves. Secondly, stringent environmental regulations and the growing focus on energy efficiency are prompting the adoption of valves with improved performance and reduced emissions. Furthermore, the rising investments in infrastructure projects globally, particularly in developing economies, are creating substantial opportunities for market growth. The market segmentation reveals a diverse landscape, with butterfly valves, ball valves, and globe valves dominating the type segment, while quarter-turn valves lead in the product segment. Geographically, North America and Europe currently hold significant market shares, but the Asia-Pacific region is poised for substantial growth due to rapid industrialization and infrastructure development.
Industrial Valves Market Market Size (In Billion)
However, the market faces certain challenges. Fluctuations in raw material prices, particularly for metals used in valve manufacturing, can impact profitability. Moreover, the increasing competition from both established players and new entrants necessitates continuous innovation and technological advancements to maintain a competitive edge. Despite these challenges, the long-term outlook for the industrial valves market remains positive, with consistent growth anticipated throughout the forecast period. The presence of major players like Honeywell, Mueller Water Products, and Danfoss, amongst others, indicates a robust and competitive landscape driving innovation and efficiency improvements within the sector. The market's growth is expected to be further propelled by increasing adoption of smart valves and integration with advanced control systems for enhanced operational efficiency and reduced maintenance costs.
Industrial Valves Market Company Market Share
Industrial Valves Market: A Comprehensive Market Report (2019-2033)
This comprehensive report provides an in-depth analysis of the Industrial Valves Market, encompassing market dynamics, growth trends, regional segmentation, product landscape, key players, and future outlook. The report covers the historical period from 2019 to 2024, the base year of 2025, and forecasts market performance through 2033. The market is segmented by type (Butterfly Valve, Ball Valve, Globe Valve, Gate Valve, Plug Valve, Other Types), product (Quarter-turn Valve, Multi-turn Valve, Other Products), and application (Power, Water and Wastewater Management, Chemicals, Oil and Gas, Other Applications). The total market size is projected to reach xx Million units by 2033.
Industrial Valves Market Dynamics & Structure
The Industrial Valves market is characterized by moderate concentration, with several major players holding significant market share. Technological innovation, particularly in materials science and automation, is a key driver, alongside stringent regulatory frameworks concerning safety and environmental impact. Competitive substitutes, such as alternative flow control mechanisms, exert pressure, while end-user demographics (particularly in developing economies experiencing infrastructure expansion) significantly influence demand. M&A activity has been notable, with several significant acquisitions shaping the competitive landscape.
- Market Concentration: Moderately concentrated, with top 10 players holding approximately 60% market share (estimated).
- Technological Innovation: Focus on smart valves, improved materials for extreme conditions, and remote monitoring capabilities.
- Regulatory Frameworks: Emphasis on safety, emission control, and energy efficiency standards influence product design and adoption.
- Competitive Substitutes: Alternative flow control technologies (e.g., advanced piping systems) pose competitive challenges.
- End-User Demographics: Growth in infrastructure projects and industrialization in developing economies drives substantial demand.
- M&A Trends: Significant acquisitions, such as the Flowserve Corporation acquisition of Velan Inc. in 2023 (USD 245 million), point to consolidation and strategic expansion.
Industrial Valves Market Growth Trends & Insights
The Industrial Valves market experienced steady growth between 2019 and 2024, driven primarily by rising industrial output and infrastructure development globally. The market is projected to exhibit a CAGR of xx% during the forecast period (2025-2033). Technological advancements, such as the adoption of smart valves and automation, are accelerating adoption rates and enhancing efficiency. Changing consumer behavior toward sustainability and environmental concerns are also influencing product development and demand. Specific metrics, including detailed CAGR projections for each segment, are available within the full report. The increasing adoption of automation and smart technologies across various industries also contributes significantly to the growth of the market.
Dominant Regions, Countries, or Segments in Industrial Valves Market
The Oil and Gas segment currently dominates the application market, accounting for approximately 35% of the total market share in 2025. Geographically, North America and Europe are leading regions, with strong industrial bases and robust infrastructure investments. However, Asia-Pacific is expected to exhibit the highest growth rate due to significant investments in energy and infrastructure projects. The Ball Valve and Butterfly Valve types are currently the dominant segments within the Type category.
- Key Drivers (Asia-Pacific): Rapid industrialization, significant infrastructure development (e.g., power plants, pipelines), and government initiatives promoting economic growth.
- Dominance Factors (North America & Europe): Established industrial base, technological advancements, stringent regulatory frameworks driving demand for high-quality, sophisticated valves.
- Growth Potential: Asia-Pacific and emerging markets offer significant untapped potential due to increasing industrialization and infrastructure projects.
Industrial Valves Market Product Landscape
The industrial valves market showcases a diverse range of products, from traditional designs to sophisticated smart valves equipped with advanced sensors and automation capabilities. Recent innovations focus on materials capable of handling extreme temperatures and pressures, improved sealing mechanisms, and enhanced durability. Unique selling propositions include energy efficiency, reduced maintenance requirements, and enhanced safety features. Technological advancements are driving the development of more compact, lightweight, and environmentally friendly valves.
Key Drivers, Barriers & Challenges in Industrial Valves Market
Key Drivers:
- Increased industrial production and infrastructure development globally.
- Growing demand for automation and smart technologies in industrial processes.
- Stringent regulatory requirements for safety and environmental compliance.
Key Challenges:
- Supply chain disruptions and volatility in raw material prices.
- Intense competition among established players and new entrants.
- Regulatory hurdles and compliance costs for manufacturers. These challenges, when aggregated, could impact market growth by an estimated xx% by 2030.
Emerging Opportunities in Industrial Valves Market
- Growing demand for energy-efficient and sustainable valves.
- Expansion into emerging markets with significant infrastructure development.
- Development of specialized valves for niche applications (e.g., renewable energy, advanced materials processing).
Growth Accelerators in the Industrial Valves Market Industry
Technological breakthroughs in materials science, automation, and digitalization are key growth catalysts. Strategic partnerships and collaborations between manufacturers and technology providers are fostering innovation and accelerating product development. Expanding into new geographic markets and tapping into emerging applications will further propel market growth. The increasing focus on Industry 4.0 and the digital transformation of industrial processes is a major driver of growth in this sector.
Key Players Shaping the Industrial Valves Market Market
- Honeywell International Inc
- Mueller Water Products Inc
- Danfoss AS
- Saint-Gobain
- Okano Valve Mfg Co Ltd
- ALFA LAVAL
- Flowserve Corporation
- The Weir Group PLC
- Georg Fischer Ltd
- NIBCO Inc
- Baker Hughes
- Hitachi Ltd
- Xylem*List Not Exhaustive
- Emerson Electric Co
- Zhejiang Dunan Valve Co Ltd
- CIRCOR International Inc
- AVK Holding AS
- ITT Inc
- KLINGER Group
- IMI
- Crane Co
- SLB
- Valvitalia SpA
- Curtiss-Wright Corporation
- TechnipFMC PLC
- KITZ Corporation
Notable Milestones in Industrial Valves Market Sector
- September 2023: Danfoss India opens a new 43,000 sq ft distribution center in Chennai, expanding its reach and capacity in the Indian market.
- February 2023: Flowserve Corporation acquires Velan Inc. for USD 245 million, strengthening its portfolio and market position.
- November 2022: IMI Saudi Industry unveils a new 5,000 m2 facility in Dammam, boosting local manufacturing and supporting Saudi Arabia's localization efforts.
- November 2022: James Walker introduces the Supagraf HT valve stem seal, designed for extreme temperature and corrosive environments.
In-Depth Industrial Valves Market Market Outlook
The Industrial Valves market is poised for sustained growth driven by ongoing technological innovation, increasing industrialization, and infrastructure development across numerous regions. Strategic investments in research and development, coupled with strategic acquisitions and partnerships, will further shape the competitive landscape and unlock new market opportunities. The focus on sustainability and energy efficiency will continue to influence product development and market demand. The anticipated growth trajectory indicates significant potential for expansion and investment in the coming years.
Industrial Valves Market Segmentation
-
1. Type
- 1.1. Butterfly Valve
- 1.2. Ball Valve
- 1.3. Globe Valve
- 1.4. Gate Valve
- 1.5. Plug Valve
- 1.6. Other Types
-
2. Product
- 2.1. Quarter-turn Valve
- 2.2. Multi-turn Valve
- 2.3. Other Products
-
3. Application
- 3.1. Power
- 3.2. Water and Wastewater Management
- 3.3. Chemicals
- 3.4. Oil and Gas
- 3.5. Other Ap
Industrial Valves Market Segmentation By Geography
-
1. Asia Pacific
- 1.1. China
- 1.2. India
- 1.3. Japan
- 1.4. South Korea
- 1.5. Indonesia
- 1.6. Vietnam
- 1.7. Malaysia
- 1.8. Thailand
- 1.9. Rest of Asia Pacific
-
2. North America
- 2.1. United States
- 2.2. Canada
- 2.3. Mexico
-
3. Europe
- 3.1. Germany
- 3.2. United Kingdom
- 3.3. Italy
- 3.4. France
- 3.5. NORDIC
- 3.6. Turkey
- 3.7. Russia
- 3.8. Spain
- 3.9. Rest of Europe
-
4. South America
- 4.1. Brazil
- 4.2. Argentina
- 4.3. Colombia
- 4.4. Rest of South America
-
5. Middle East and Africa
- 5.1. Saudi Arabia
- 5.2. South Africa
- 5.3. United Arab Emirates
- 5.4. Qatar
- 5.5. Nigeria
- 5.6. Egypt
- 5.7. Rest of Middle East and Africa
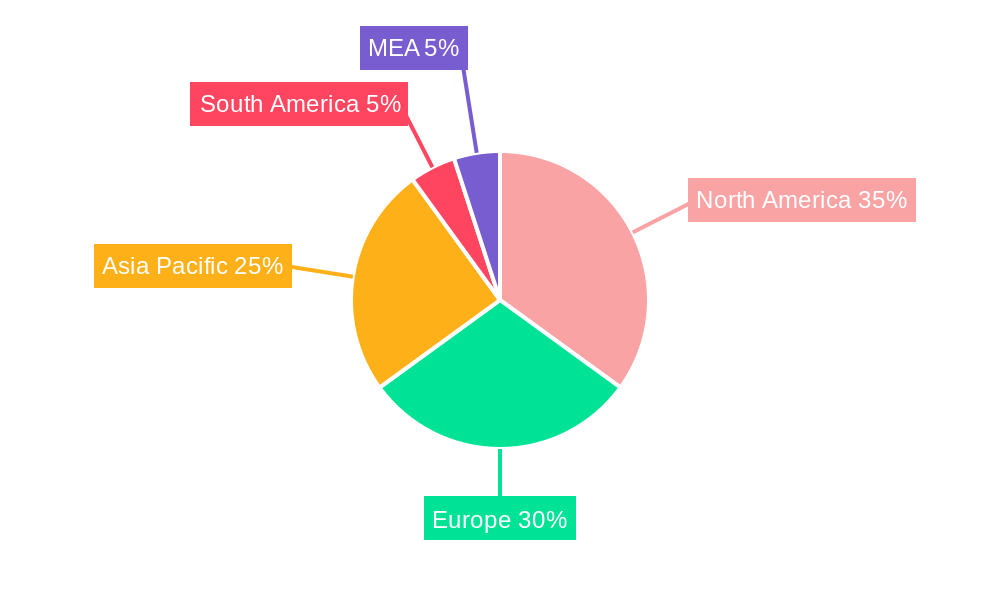
Industrial Valves Market Regional Market Share
Geographic Coverage of Industrial Valves Market
Industrial Valves Market REPORT HIGHLIGHTS
| Aspects | Details |
|---|---|
| Study Period | 2020-2034 |
| Base Year | 2025 |
| Estimated Year | 2026 |
| Forecast Period | 2026-2034 |
| Historical Period | 2020-2025 |
| Growth Rate | CAGR of 4.52% from 2020-2034 |
| Segmentation |
|
Table of Contents
- 1. Introduction
- 1.1. Research Scope
- 1.2. Market Segmentation
- 1.3. Research Objective
- 1.4. Definitions and Assumptions
- 2. Executive Summary
- 2.1. Market Snapshot
- 3. Market Dynamics
- 3.1. Market Drivers
- 3.2. Market Restrains
- 3.3. Market Trends
- 3.4. Market Opportunities
- 4. Market Factor Analysis
- 4.1. Porters Five Forces
- 4.1.1. Bargaining Power of Suppliers
- 4.1.2. Bargaining Power of Buyers
- 4.1.3. Threat of New Entrants
- 4.1.4. Threat of Substitutes
- 4.1.5. Competitive Rivalry
- 4.2. PESTEL analysis
- 4.3. BCG Analysis
- 4.3.1. Stars (High Growth, High Market Share)
- 4.3.2. Cash Cows (Low Growth, High Market Share)
- 4.3.3. Question Mark (High Growth, Low Market Share)
- 4.3.4. Dogs (Low Growth, Low Market Share)
- 4.4. Ansoff Matrix Analysis
- 4.5. Supply Chain Analysis
- 4.6. Regulatory Landscape
- 4.7. Current Market Potential and Opportunity Assessment (TAM–SAM–SOM Framework)
- 4.8. VDR Analyst Note
- 4.1. Porters Five Forces
- 5. Market Analysis, Insights and Forecast 2021-2033
- 5.1. Market Analysis, Insights and Forecast - by Type
- 5.1.1. Butterfly Valve
- 5.1.2. Ball Valve
- 5.1.3. Globe Valve
- 5.1.4. Gate Valve
- 5.1.5. Plug Valve
- 5.1.6. Other Types
- 5.2. Market Analysis, Insights and Forecast - by Product
- 5.2.1. Quarter-turn Valve
- 5.2.2. Multi-turn Valve
- 5.2.3. Other Products
- 5.3. Market Analysis, Insights and Forecast - by Application
- 5.3.1. Power
- 5.3.2. Water and Wastewater Management
- 5.3.3. Chemicals
- 5.3.4. Oil and Gas
- 5.3.5. Other Ap
- 5.4. Market Analysis, Insights and Forecast - by Region
- 5.4.1. Asia Pacific
- 5.4.2. North America
- 5.4.3. Europe
- 5.4.4. South America
- 5.4.5. Middle East and Africa
- 5.1. Market Analysis, Insights and Forecast - by Type
- 6. Global Industrial Valves Market Analysis, Insights and Forecast, 2021-2033
- 6.1. Market Analysis, Insights and Forecast - by Type
- 6.1.1. Butterfly Valve
- 6.1.2. Ball Valve
- 6.1.3. Globe Valve
- 6.1.4. Gate Valve
- 6.1.5. Plug Valve
- 6.1.6. Other Types
- 6.2. Market Analysis, Insights and Forecast - by Product
- 6.2.1. Quarter-turn Valve
- 6.2.2. Multi-turn Valve
- 6.2.3. Other Products
- 6.3. Market Analysis, Insights and Forecast - by Application
- 6.3.1. Power
- 6.3.2. Water and Wastewater Management
- 6.3.3. Chemicals
- 6.3.4. Oil and Gas
- 6.3.5. Other Ap
- 6.1. Market Analysis, Insights and Forecast - by Type
- 7. Asia Pacific Industrial Valves Market Analysis, Insights and Forecast, 2021-2033
- 7.1. Market Analysis, Insights and Forecast - by Type
- 7.1.1. Butterfly Valve
- 7.1.2. Ball Valve
- 7.1.3. Globe Valve
- 7.1.4. Gate Valve
- 7.1.5. Plug Valve
- 7.1.6. Other Types
- 7.2. Market Analysis, Insights and Forecast - by Product
- 7.2.1. Quarter-turn Valve
- 7.2.2. Multi-turn Valve
- 7.2.3. Other Products
- 7.3. Market Analysis, Insights and Forecast - by Application
- 7.3.1. Power
- 7.3.2. Water and Wastewater Management
- 7.3.3. Chemicals
- 7.3.4. Oil and Gas
- 7.3.5. Other Ap
- 7.1. Market Analysis, Insights and Forecast - by Type
- 8. North America Industrial Valves Market Analysis, Insights and Forecast, 2021-2033
- 8.1. Market Analysis, Insights and Forecast - by Type
- 8.1.1. Butterfly Valve
- 8.1.2. Ball Valve
- 8.1.3. Globe Valve
- 8.1.4. Gate Valve
- 8.1.5. Plug Valve
- 8.1.6. Other Types
- 8.2. Market Analysis, Insights and Forecast - by Product
- 8.2.1. Quarter-turn Valve
- 8.2.2. Multi-turn Valve
- 8.2.3. Other Products
- 8.3. Market Analysis, Insights and Forecast - by Application
- 8.3.1. Power
- 8.3.2. Water and Wastewater Management
- 8.3.3. Chemicals
- 8.3.4. Oil and Gas
- 8.3.5. Other Ap
- 8.1. Market Analysis, Insights and Forecast - by Type
- 9. Europe Industrial Valves Market Analysis, Insights and Forecast, 2021-2033
- 9.1. Market Analysis, Insights and Forecast - by Type
- 9.1.1. Butterfly Valve
- 9.1.2. Ball Valve
- 9.1.3. Globe Valve
- 9.1.4. Gate Valve
- 9.1.5. Plug Valve
- 9.1.6. Other Types
- 9.2. Market Analysis, Insights and Forecast - by Product
- 9.2.1. Quarter-turn Valve
- 9.2.2. Multi-turn Valve
- 9.2.3. Other Products
- 9.3. Market Analysis, Insights and Forecast - by Application
- 9.3.1. Power
- 9.3.2. Water and Wastewater Management
- 9.3.3. Chemicals
- 9.3.4. Oil and Gas
- 9.3.5. Other Ap
- 9.1. Market Analysis, Insights and Forecast - by Type
- 10. South America Industrial Valves Market Analysis, Insights and Forecast, 2021-2033
- 10.1. Market Analysis, Insights and Forecast - by Type
- 10.1.1. Butterfly Valve
- 10.1.2. Ball Valve
- 10.1.3. Globe Valve
- 10.1.4. Gate Valve
- 10.1.5. Plug Valve
- 10.1.6. Other Types
- 10.2. Market Analysis, Insights and Forecast - by Product
- 10.2.1. Quarter-turn Valve
- 10.2.2. Multi-turn Valve
- 10.2.3. Other Products
- 10.3. Market Analysis, Insights and Forecast - by Application
- 10.3.1. Power
- 10.3.2. Water and Wastewater Management
- 10.3.3. Chemicals
- 10.3.4. Oil and Gas
- 10.3.5. Other Ap
- 10.1. Market Analysis, Insights and Forecast - by Type
- 11. Middle East and Africa Industrial Valves Market Analysis, Insights and Forecast, 2021-2033
- 11.1. Market Analysis, Insights and Forecast - by Type
- 11.1.1. Butterfly Valve
- 11.1.2. Ball Valve
- 11.1.3. Globe Valve
- 11.1.4. Gate Valve
- 11.1.5. Plug Valve
- 11.1.6. Other Types
- 11.2. Market Analysis, Insights and Forecast - by Product
- 11.2.1. Quarter-turn Valve
- 11.2.2. Multi-turn Valve
- 11.2.3. Other Products
- 11.3. Market Analysis, Insights and Forecast - by Application
- 11.3.1. Power
- 11.3.2. Water and Wastewater Management
- 11.3.3. Chemicals
- 11.3.4. Oil and Gas
- 11.3.5. Other Ap
- 11.1. Market Analysis, Insights and Forecast - by Type
- 12. Competitive Analysis
- 12.1. Company Profiles
- 12.1.1 Honeywell International Inc
- 12.1.1.1. Company Overview
- 12.1.1.2. Products
- 12.1.1.3. Company Financials
- 12.1.1.4. SWOT Analysis
- 12.1.2 Mueller Water Products Inc
- 12.1.2.1. Company Overview
- 12.1.2.2. Products
- 12.1.2.3. Company Financials
- 12.1.2.4. SWOT Analysis
- 12.1.3 Danfoss AS
- 12.1.3.1. Company Overview
- 12.1.3.2. Products
- 12.1.3.3. Company Financials
- 12.1.3.4. SWOT Analysis
- 12.1.4 Saint-Gobain
- 12.1.4.1. Company Overview
- 12.1.4.2. Products
- 12.1.4.3. Company Financials
- 12.1.4.4. SWOT Analysis
- 12.1.5 Okano Valve Mfg Co Ltd
- 12.1.5.1. Company Overview
- 12.1.5.2. Products
- 12.1.5.3. Company Financials
- 12.1.5.4. SWOT Analysis
- 12.1.6 ALFA LAVAL
- 12.1.6.1. Company Overview
- 12.1.6.2. Products
- 12.1.6.3. Company Financials
- 12.1.6.4. SWOT Analysis
- 12.1.7 Flowserve Corporation
- 12.1.7.1. Company Overview
- 12.1.7.2. Products
- 12.1.7.3. Company Financials
- 12.1.7.4. SWOT Analysis
- 12.1.8 The Weir Group PLC
- 12.1.8.1. Company Overview
- 12.1.8.2. Products
- 12.1.8.3. Company Financials
- 12.1.8.4. SWOT Analysis
- 12.1.9 Georg Fischer Ltd
- 12.1.9.1. Company Overview
- 12.1.9.2. Products
- 12.1.9.3. Company Financials
- 12.1.9.4. SWOT Analysis
- 12.1.10 NIBCO Inc
- 12.1.10.1. Company Overview
- 12.1.10.2. Products
- 12.1.10.3. Company Financials
- 12.1.10.4. SWOT Analysis
- 12.1.11 Baker Hughes
- 12.1.11.1. Company Overview
- 12.1.11.2. Products
- 12.1.11.3. Company Financials
- 12.1.11.4. SWOT Analysis
- 12.1.12 Hitachi Ltd
- 12.1.12.1. Company Overview
- 12.1.12.2. Products
- 12.1.12.3. Company Financials
- 12.1.12.4. SWOT Analysis
- 12.1.13 Xylem*List Not Exhaustive
- 12.1.13.1. Company Overview
- 12.1.13.2. Products
- 12.1.13.3. Company Financials
- 12.1.13.4. SWOT Analysis
- 12.1.14 Emerson Electric Co
- 12.1.14.1. Company Overview
- 12.1.14.2. Products
- 12.1.14.3. Company Financials
- 12.1.14.4. SWOT Analysis
- 12.1.15 Zhejiang Dunan Valve Co Ltd
- 12.1.15.1. Company Overview
- 12.1.15.2. Products
- 12.1.15.3. Company Financials
- 12.1.15.4. SWOT Analysis
- 12.1.16 CIRCOR International Inc
- 12.1.16.1. Company Overview
- 12.1.16.2. Products
- 12.1.16.3. Company Financials
- 12.1.16.4. SWOT Analysis
- 12.1.17 AVK Holding AS
- 12.1.17.1. Company Overview
- 12.1.17.2. Products
- 12.1.17.3. Company Financials
- 12.1.17.4. SWOT Analysis
- 12.1.18 ITT Inc
- 12.1.18.1. Company Overview
- 12.1.18.2. Products
- 12.1.18.3. Company Financials
- 12.1.18.4. SWOT Analysis
- 12.1.19 KLINGER Group
- 12.1.19.1. Company Overview
- 12.1.19.2. Products
- 12.1.19.3. Company Financials
- 12.1.19.4. SWOT Analysis
- 12.1.20 IMI
- 12.1.20.1. Company Overview
- 12.1.20.2. Products
- 12.1.20.3. Company Financials
- 12.1.20.4. SWOT Analysis
- 12.1.21 Crane Co
- 12.1.21.1. Company Overview
- 12.1.21.2. Products
- 12.1.21.3. Company Financials
- 12.1.21.4. SWOT Analysis
- 12.1.22 SLB
- 12.1.22.1. Company Overview
- 12.1.22.2. Products
- 12.1.22.3. Company Financials
- 12.1.22.4. SWOT Analysis
- 12.1.23 Valvitalia SpA
- 12.1.23.1. Company Overview
- 12.1.23.2. Products
- 12.1.23.3. Company Financials
- 12.1.23.4. SWOT Analysis
- 12.1.24 Curtiss-Wright Corporation
- 12.1.24.1. Company Overview
- 12.1.24.2. Products
- 12.1.24.3. Company Financials
- 12.1.24.4. SWOT Analysis
- 12.1.25 TechnipFMC PLC
- 12.1.25.1. Company Overview
- 12.1.25.2. Products
- 12.1.25.3. Company Financials
- 12.1.25.4. SWOT Analysis
- 12.1.26 KITZ Corporation
- 12.1.26.1. Company Overview
- 12.1.26.2. Products
- 12.1.26.3. Company Financials
- 12.1.26.4. SWOT Analysis
- 12.1.1 Honeywell International Inc
- 12.2. Market Entropy
- 12.2.1 Company's Key Areas Served
- 12.2.2 Recent Developments
- 12.3. Company Market Share Analysis 2025
- 12.3.1 Top 5 Companies Market Share Analysis
- 12.3.2 Top 3 Companies Market Share Analysis
- 12.4. List of Potential Customers
- 13. Research Methodology
List of Figures
- Figure 1: Global Industrial Valves Market Revenue Breakdown (Million, %) by Region 2025 & 2033
- Figure 2: Asia Pacific Industrial Valves Market Revenue (Million), by Type 2025 & 2033
- Figure 3: Asia Pacific Industrial Valves Market Revenue Share (%), by Type 2025 & 2033
- Figure 4: Asia Pacific Industrial Valves Market Revenue (Million), by Product 2025 & 2033
- Figure 5: Asia Pacific Industrial Valves Market Revenue Share (%), by Product 2025 & 2033
- Figure 6: Asia Pacific Industrial Valves Market Revenue (Million), by Application 2025 & 2033
- Figure 7: Asia Pacific Industrial Valves Market Revenue Share (%), by Application 2025 & 2033
- Figure 8: Asia Pacific Industrial Valves Market Revenue (Million), by Country 2025 & 2033
- Figure 9: Asia Pacific Industrial Valves Market Revenue Share (%), by Country 2025 & 2033
- Figure 10: North America Industrial Valves Market Revenue (Million), by Type 2025 & 2033
- Figure 11: North America Industrial Valves Market Revenue Share (%), by Type 2025 & 2033
- Figure 12: North America Industrial Valves Market Revenue (Million), by Product 2025 & 2033
- Figure 13: North America Industrial Valves Market Revenue Share (%), by Product 2025 & 2033
- Figure 14: North America Industrial Valves Market Revenue (Million), by Application 2025 & 2033
- Figure 15: North America Industrial Valves Market Revenue Share (%), by Application 2025 & 2033
- Figure 16: North America Industrial Valves Market Revenue (Million), by Country 2025 & 2033
- Figure 17: North America Industrial Valves Market Revenue Share (%), by Country 2025 & 2033
- Figure 18: Europe Industrial Valves Market Revenue (Million), by Type 2025 & 2033
- Figure 19: Europe Industrial Valves Market Revenue Share (%), by Type 2025 & 2033
- Figure 20: Europe Industrial Valves Market Revenue (Million), by Product 2025 & 2033
- Figure 21: Europe Industrial Valves Market Revenue Share (%), by Product 2025 & 2033
- Figure 22: Europe Industrial Valves Market Revenue (Million), by Application 2025 & 2033
- Figure 23: Europe Industrial Valves Market Revenue Share (%), by Application 2025 & 2033
- Figure 24: Europe Industrial Valves Market Revenue (Million), by Country 2025 & 2033
- Figure 25: Europe Industrial Valves Market Revenue Share (%), by Country 2025 & 2033
- Figure 26: South America Industrial Valves Market Revenue (Million), by Type 2025 & 2033
- Figure 27: South America Industrial Valves Market Revenue Share (%), by Type 2025 & 2033
- Figure 28: South America Industrial Valves Market Revenue (Million), by Product 2025 & 2033
- Figure 29: South America Industrial Valves Market Revenue Share (%), by Product 2025 & 2033
- Figure 30: South America Industrial Valves Market Revenue (Million), by Application 2025 & 2033
- Figure 31: South America Industrial Valves Market Revenue Share (%), by Application 2025 & 2033
- Figure 32: South America Industrial Valves Market Revenue (Million), by Country 2025 & 2033
- Figure 33: South America Industrial Valves Market Revenue Share (%), by Country 2025 & 2033
- Figure 34: Middle East and Africa Industrial Valves Market Revenue (Million), by Type 2025 & 2033
- Figure 35: Middle East and Africa Industrial Valves Market Revenue Share (%), by Type 2025 & 2033
- Figure 36: Middle East and Africa Industrial Valves Market Revenue (Million), by Product 2025 & 2033
- Figure 37: Middle East and Africa Industrial Valves Market Revenue Share (%), by Product 2025 & 2033
- Figure 38: Middle East and Africa Industrial Valves Market Revenue (Million), by Application 2025 & 2033
- Figure 39: Middle East and Africa Industrial Valves Market Revenue Share (%), by Application 2025 & 2033
- Figure 40: Middle East and Africa Industrial Valves Market Revenue (Million), by Country 2025 & 2033
- Figure 41: Middle East and Africa Industrial Valves Market Revenue Share (%), by Country 2025 & 2033
List of Tables
- Table 1: Global Industrial Valves Market Revenue Million Forecast, by Type 2020 & 2033
- Table 2: Global Industrial Valves Market Revenue Million Forecast, by Product 2020 & 2033
- Table 3: Global Industrial Valves Market Revenue Million Forecast, by Application 2020 & 2033
- Table 4: Global Industrial Valves Market Revenue Million Forecast, by Region 2020 & 2033
- Table 5: Global Industrial Valves Market Revenue Million Forecast, by Type 2020 & 2033
- Table 6: Global Industrial Valves Market Revenue Million Forecast, by Product 2020 & 2033
- Table 7: Global Industrial Valves Market Revenue Million Forecast, by Application 2020 & 2033
- Table 8: Global Industrial Valves Market Revenue Million Forecast, by Country 2020 & 2033
- Table 9: China Industrial Valves Market Revenue (Million) Forecast, by Application 2020 & 2033
- Table 10: India Industrial Valves Market Revenue (Million) Forecast, by Application 2020 & 2033
- Table 11: Japan Industrial Valves Market Revenue (Million) Forecast, by Application 2020 & 2033
- Table 12: South Korea Industrial Valves Market Revenue (Million) Forecast, by Application 2020 & 2033
- Table 13: Indonesia Industrial Valves Market Revenue (Million) Forecast, by Application 2020 & 2033
- Table 14: Vietnam Industrial Valves Market Revenue (Million) Forecast, by Application 2020 & 2033
- Table 15: Malaysia Industrial Valves Market Revenue (Million) Forecast, by Application 2020 & 2033
- Table 16: Thailand Industrial Valves Market Revenue (Million) Forecast, by Application 2020 & 2033
- Table 17: Rest of Asia Pacific Industrial Valves Market Revenue (Million) Forecast, by Application 2020 & 2033
- Table 18: Global Industrial Valves Market Revenue Million Forecast, by Type 2020 & 2033
- Table 19: Global Industrial Valves Market Revenue Million Forecast, by Product 2020 & 2033
- Table 20: Global Industrial Valves Market Revenue Million Forecast, by Application 2020 & 2033
- Table 21: Global Industrial Valves Market Revenue Million Forecast, by Country 2020 & 2033
- Table 22: United States Industrial Valves Market Revenue (Million) Forecast, by Application 2020 & 2033
- Table 23: Canada Industrial Valves Market Revenue (Million) Forecast, by Application 2020 & 2033
- Table 24: Mexico Industrial Valves Market Revenue (Million) Forecast, by Application 2020 & 2033
- Table 25: Global Industrial Valves Market Revenue Million Forecast, by Type 2020 & 2033
- Table 26: Global Industrial Valves Market Revenue Million Forecast, by Product 2020 & 2033
- Table 27: Global Industrial Valves Market Revenue Million Forecast, by Application 2020 & 2033
- Table 28: Global Industrial Valves Market Revenue Million Forecast, by Country 2020 & 2033
- Table 29: Germany Industrial Valves Market Revenue (Million) Forecast, by Application 2020 & 2033
- Table 30: United Kingdom Industrial Valves Market Revenue (Million) Forecast, by Application 2020 & 2033
- Table 31: Italy Industrial Valves Market Revenue (Million) Forecast, by Application 2020 & 2033
- Table 32: France Industrial Valves Market Revenue (Million) Forecast, by Application 2020 & 2033
- Table 33: NORDIC Industrial Valves Market Revenue (Million) Forecast, by Application 2020 & 2033
- Table 34: Turkey Industrial Valves Market Revenue (Million) Forecast, by Application 2020 & 2033
- Table 35: Russia Industrial Valves Market Revenue (Million) Forecast, by Application 2020 & 2033
- Table 36: Spain Industrial Valves Market Revenue (Million) Forecast, by Application 2020 & 2033
- Table 37: Rest of Europe Industrial Valves Market Revenue (Million) Forecast, by Application 2020 & 2033
- Table 38: Global Industrial Valves Market Revenue Million Forecast, by Type 2020 & 2033
- Table 39: Global Industrial Valves Market Revenue Million Forecast, by Product 2020 & 2033
- Table 40: Global Industrial Valves Market Revenue Million Forecast, by Application 2020 & 2033
- Table 41: Global Industrial Valves Market Revenue Million Forecast, by Country 2020 & 2033
- Table 42: Brazil Industrial Valves Market Revenue (Million) Forecast, by Application 2020 & 2033
- Table 43: Argentina Industrial Valves Market Revenue (Million) Forecast, by Application 2020 & 2033
- Table 44: Colombia Industrial Valves Market Revenue (Million) Forecast, by Application 2020 & 2033
- Table 45: Rest of South America Industrial Valves Market Revenue (Million) Forecast, by Application 2020 & 2033
- Table 46: Global Industrial Valves Market Revenue Million Forecast, by Type 2020 & 2033
- Table 47: Global Industrial Valves Market Revenue Million Forecast, by Product 2020 & 2033
- Table 48: Global Industrial Valves Market Revenue Million Forecast, by Application 2020 & 2033
- Table 49: Global Industrial Valves Market Revenue Million Forecast, by Country 2020 & 2033
- Table 50: Saudi Arabia Industrial Valves Market Revenue (Million) Forecast, by Application 2020 & 2033
- Table 51: South Africa Industrial Valves Market Revenue (Million) Forecast, by Application 2020 & 2033
- Table 52: United Arab Emirates Industrial Valves Market Revenue (Million) Forecast, by Application 2020 & 2033
- Table 53: Qatar Industrial Valves Market Revenue (Million) Forecast, by Application 2020 & 2033
- Table 54: Nigeria Industrial Valves Market Revenue (Million) Forecast, by Application 2020 & 2033
- Table 55: Egypt Industrial Valves Market Revenue (Million) Forecast, by Application 2020 & 2033
- Table 56: Rest of Middle East and Africa Industrial Valves Market Revenue (Million) Forecast, by Application 2020 & 2033
Frequently Asked Questions
1. What is the projected Compound Annual Growth Rate (CAGR) of the Industrial Valves Market?
The projected CAGR is approximately 4.52%.
2. Which companies are prominent players in the Industrial Valves Market?
Key companies in the market include Honeywell International Inc, Mueller Water Products Inc, Danfoss AS, Saint-Gobain, Okano Valve Mfg Co Ltd, ALFA LAVAL, Flowserve Corporation, The Weir Group PLC, Georg Fischer Ltd, NIBCO Inc, Baker Hughes, Hitachi Ltd, Xylem*List Not Exhaustive, Emerson Electric Co, Zhejiang Dunan Valve Co Ltd, CIRCOR International Inc, AVK Holding AS, ITT Inc, KLINGER Group, IMI, Crane Co, SLB, Valvitalia SpA, Curtiss-Wright Corporation, TechnipFMC PLC, KITZ Corporation.
3. What are the main segments of the Industrial Valves Market?
The market segments include Type, Product, Application.
4. Can you provide details about the market size?
The market size is estimated to be USD 70.97 Million as of 2022.
5. What are some drivers contributing to market growth?
Growing Demand from the Power and Chemical Industry; Increase in Demand for Desalination Activity.
6. What are the notable trends driving market growth?
Increasing Demand from the Power Industry.
7. Are there any restraints impacting market growth?
Stagnant Industrial Growth in Developed Countries; Other Restraints.
8. Can you provide examples of recent developments in the market?
September 2023: Danfoss India opened a new India distribution center in Chennai, India, that is spread over 43,000 square feet and has a 4,000 pallet position facility to support growth plans. This new distribution unit will likely aggregate Danfoss products from Asia, Europe, Latin America, and Denmark.
9. What pricing options are available for accessing the report?
Pricing options include single-user, multi-user, and enterprise licenses priced at USD 4750, USD 5250, and USD 8750 respectively.
10. Is the market size provided in terms of value or volume?
The market size is provided in terms of value, measured in Million.
11. Are there any specific market keywords associated with the report?
Yes, the market keyword associated with the report is "Industrial Valves Market," which aids in identifying and referencing the specific market segment covered.
12. How do I determine which pricing option suits my needs best?
The pricing options vary based on user requirements and access needs. Individual users may opt for single-user licenses, while businesses requiring broader access may choose multi-user or enterprise licenses for cost-effective access to the report.
13. Are there any additional resources or data provided in the Industrial Valves Market report?
While the report offers comprehensive insights, it's advisable to review the specific contents or supplementary materials provided to ascertain if additional resources or data are available.
14. How can I stay updated on further developments or reports in the Industrial Valves Market?
To stay informed about further developments, trends, and reports in the Industrial Valves Market, consider subscribing to industry newsletters, following relevant companies and organizations, or regularly checking reputable industry news sources and publications.
Methodology
Step 1 - Identification of Relevant Samples Size from Population Database


Step 2 - Approaches for Defining Global Market Size (Value, Volume* & Price*)

Note*: In applicable scenarios
Step 3 - Data Sources
Primary Research
- Web Analytics
- Survey Reports
- Research Institute
- Latest Research Reports
- Opinion Leaders
Secondary Research
- Annual Reports
- White Paper
- Latest Press Release
- Industry Association
- Paid Database
- Investor Presentations

Step 4 - Data Triangulation
Involves using different sources of information in order to increase the validity of a study
These sources are likely to be stakeholders in a program - participants, other researchers, program staff, other community members, and so on.
Then we put all data in single framework & apply various statistical tools to find out the dynamic on the market.
During the analysis stage, feedback from the stakeholder groups would be compared to determine areas of agreement as well as areas of divergence