

Key Insights
The Industrial Radiography Equipment market, valued at $1.35 billion in 2025, is poised for significant expansion, projected to grow at a Compound Annual Growth Rate (CAGR) of 8.6% from 2025 to 2033. This robust growth is propelled by the escalating demand for non-destructive testing (NDT) across critical sectors such as aerospace, automotive, and energy. Stringent quality control and safety mandates are driving the widespread adoption of radiography for defect detection in manufactured components and infrastructure. Technological innovations, including the development of portable and digital radiography systems, are enhancing operational efficiency and image clarity, further contributing to market momentum. The transition to advanced imaging modalities like computed tomography (CT) and digital radiography (DR) is a key trend, offering superior resolution, expedited processing, and advanced data analysis capabilities over conventional film radiography.
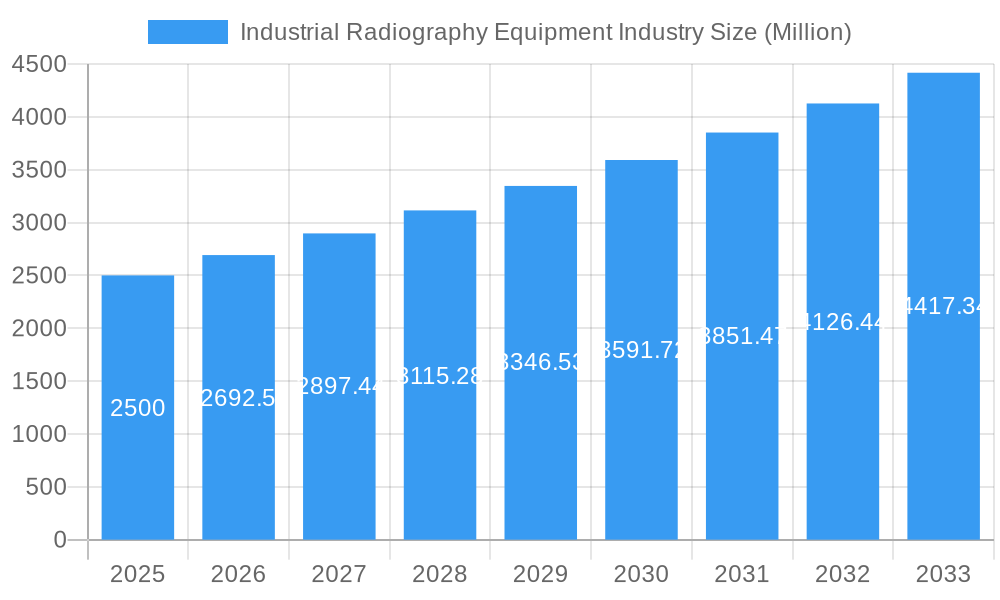
Industrial Radiography Equipment Industry Market Size (In Billion)
Despite these positive trends, market growth is tempered by challenges. Substantial initial capital investment for advanced equipment can pose a barrier for smaller enterprises. Additionally, a shortage of skilled technicians proficient in operating and interpreting radiographic data presents a hurdle. Nevertheless, market segmentation reveals substantial opportunities, particularly within the software and technology segments, driven by the increasing need for sophisticated image processing and analysis solutions. Geographically, while North America and Europe currently dominate, the Asia-Pacific region is anticipated to exhibit substantial growth, fueled by escalating industrialization and infrastructure development. This dynamic landscape presents significant opportunities for both established and emerging market participants. The competitive environment features a mix of established multinational corporations and specialized niche providers, fostering ongoing innovation and a diverse array of product offerings.
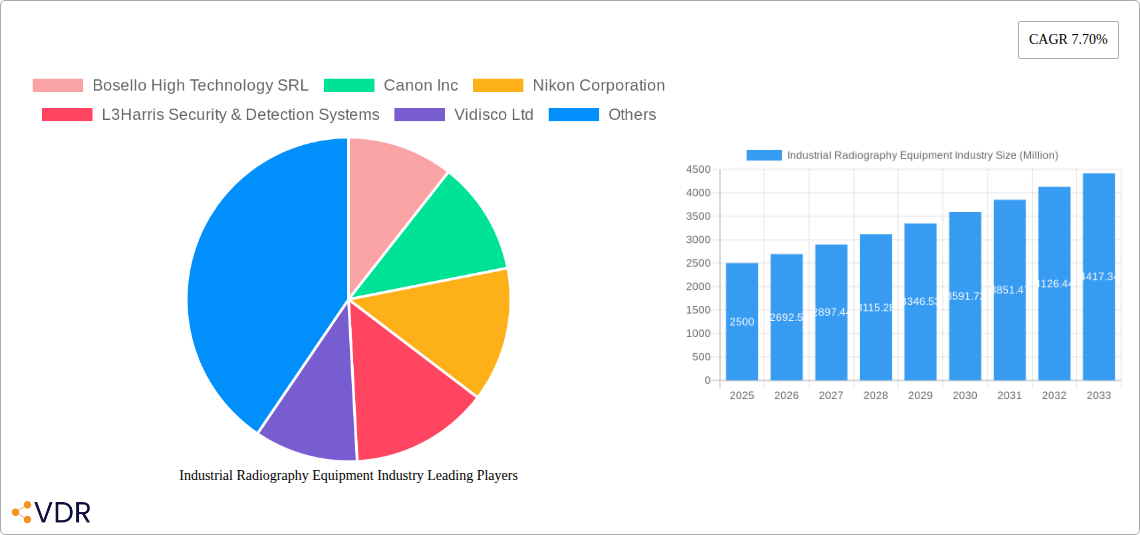
Industrial Radiography Equipment Industry Company Market Share
Industrial Radiography Equipment Market Report: 2019-2033
This comprehensive report provides a detailed analysis of the Industrial Radiography Equipment market, encompassing market dynamics, growth trends, regional dominance, product landscape, key players, and future outlook. The study covers the period 2019-2033, with a base year of 2025 and a forecast period of 2025-2033. The market is segmented by offering (Equipment, Software), technology (Film Radiography, Computed Radiography, Direct Radiography, Computed Tomography), and end-user industry (Aerospace, Food Industry, Construction, Oil and Gas, Automotive and Manufacturing, Energy and Power, Semiconductor and Electronics, Other End-user Industries). This report is essential for industry professionals, investors, and stakeholders seeking to understand and capitalize on the opportunities within this dynamic market. The market size is projected to reach xx Million units by 2033.
Industrial Radiography Equipment Industry Market Dynamics & Structure
The Industrial Radiography Equipment market is characterized by a moderately concentrated structure, with several key players holding significant market share. Technological innovation, driven by advancements in digital imaging and automation, is a primary growth driver. Stringent regulatory frameworks governing radiation safety influence market dynamics, while competitive pressure from substitute technologies (e.g., ultrasonic testing) presents challenges. The market is influenced by end-user demographics, with growth concentrated in industries with high safety and quality control requirements. M&A activity in the sector has been moderate, with xx deals recorded between 2019 and 2024, primarily focused on expanding product portfolios and geographic reach.
- Market Concentration: Moderately concentrated, with top 5 players holding approximately xx% market share in 2024.
- Technological Innovation: Focus on improving image quality, reducing exposure times, and enhancing automation.
- Regulatory Landscape: Stringent safety regulations, varying across regions, impact adoption rates and equipment specifications.
- Competitive Substitutes: Ultrasonic testing and other non-destructive testing methods compete for market share.
- M&A Activity: xx deals between 2019 and 2024, driven by expansion and technology acquisition.
- Innovation Barriers: High R&D costs, stringent regulatory approvals, and the need for skilled personnel.
Industrial Radiography Equipment Industry Growth Trends & Insights
The Industrial Radiography Equipment market experienced steady growth during the historical period (2019-2024), driven by increasing demand across various end-user industries. The market size reached xx Million units in 2024, exhibiting a CAGR of xx% during this period. Adoption rates are influenced by factors such as technological advancements, regulatory compliance, and cost considerations. Technological disruptions, such as the shift towards digital radiography, are reshaping the market landscape, while consumer behavior shifts towards greater automation and remote operation are becoming increasingly relevant. The forecast period (2025-2033) anticipates continued growth, with a projected CAGR of xx%, driven by increasing adoption in emerging markets and the expansion of high-growth end-user sectors like renewable energy and advanced manufacturing. Market penetration is expected to reach xx% by 2033. Specific industry trends like the adoption of AI-powered image analysis are also being factored into these projections.
Dominant Regions, Countries, or Segments in Industrial Radiography Equipment Industry
North America currently dominates the Industrial Radiography Equipment market, driven by a strong presence of key players, robust regulatory frameworks, and high demand from industries like aerospace and oil & gas. However, Asia-Pacific is projected to witness significant growth over the forecast period, fueled by rapid industrialization and infrastructure development. Within the segments, Computed Radiography and Direct Radiography are experiencing faster adoption rates due to their superior image quality and efficiency compared to film radiography. The automotive and manufacturing end-user industry segment displays the highest growth potential, due to stringent quality control standards and increasing production volumes.
- Key Drivers (North America): Established industrial base, stringent quality standards, strong regulatory framework.
- Key Drivers (Asia-Pacific): Rapid industrialization, infrastructure development, rising disposable income.
- Segment Dominance: Computed Radiography and Direct Radiography are leading segments due to their efficiency and image quality.
- End-User Dominance: Automotive and manufacturing industries exhibit high growth potential due to increasing production volumes and quality control demands.
Industrial Radiography Equipment Industry Product Landscape
The Industrial Radiography Equipment market features a diverse range of products, including portable and stationary X-ray units, digital detectors, and specialized software for image processing and analysis. Product innovations focus on enhancing image quality, reducing exposure times, improving portability, and integrating advanced features like automated defect detection. Unique selling propositions include real-time image analysis, advanced data management capabilities, and user-friendly interfaces. Technological advancements such as the integration of AI and machine learning are enabling improved diagnostic accuracy and automated reporting.
Key Drivers, Barriers & Challenges in Industrial Radiography Equipment Industry
Key Drivers:
- Increasing demand for non-destructive testing across various industries.
- Technological advancements enhancing image quality and efficiency.
- Stringent safety regulations driving adoption of advanced systems.
- Growing awareness of the importance of quality control and safety.
Key Challenges:
- High initial investment costs for advanced equipment.
- Skilled personnel shortages in operation and maintenance.
- Regulatory compliance complexities across different regions.
- Competition from substitute technologies and other inspection methods. Supply chain disruptions resulting in increased lead times and cost fluctuations are also a significant concern, impacting approximately xx% of manufacturers in 2024.
Emerging Opportunities in Industrial Radiography Equipment Industry
- Growing demand in emerging markets like India and Southeast Asia.
- Expanding applications in renewable energy and infrastructure projects.
- Integration of AI and machine learning for advanced image analysis.
- Development of portable and user-friendly systems for remote inspection.
- Increased focus on reducing radiation exposure for enhanced operator safety.
Growth Accelerators in the Industrial Radiography Equipment Industry Industry
Technological breakthroughs in digital imaging, coupled with strategic partnerships between equipment manufacturers and software developers, are driving market growth. Market expansion strategies, focusing on emerging markets and untapped applications within existing industries, are also significantly accelerating growth. The increasing adoption of cloud-based data management solutions further enhances the efficiency and accessibility of radiography data, boosting market expansion.
Key Players Shaping the Industrial Radiography Equipment Market
- Bosello High Technology SRL
- Canon Inc
- Nikon Corporation
- L3Harris Security & Detection Systems
- Vidisco Ltd
- Dürr NDT Gmbh & Co KG
- Teledyne Dalsa Inc
- North Star Imaging Inc
- YXLON International
- Hamamatsu Photonics K K
- Carestream Health Inc
- Hitachi Ltd
- General Electric Company
- Olympus Corporation
- Rigaku Corporation
Notable Milestones in Industrial Radiography Equipment Industry Sector
- 2020: Introduction of AI-powered image analysis software by YXLON International.
- 2021: Acquisition of Vidisco Ltd by Dürr NDT Gmbh & Co KG.
- 2022: Launch of a new portable X-ray system by Canon Inc.
- 2023: Development of a high-resolution digital detector by Hamamatsu Photonics K K.
- 2024: Partnership between GE and Teledyne Dalsa for development of advanced radiography systems.
In-Depth Industrial Radiography Equipment Industry Market Outlook
The Industrial Radiography Equipment market is poised for robust growth over the forecast period, driven by continuous technological advancements, expansion into new applications, and increasing demand from high-growth end-user industries. Strategic partnerships and M&A activity will continue to shape the market landscape. Companies that effectively adapt to evolving regulatory requirements and invest in innovation will be well-positioned to capture significant market share. The increasing focus on digitalization and automation, along with the integration of AI, presents compelling opportunities for both established players and new entrants.
Industrial Radiography Equipment Industry Segmentation
-
1. Offering
- 1.1. Equipment
- 1.2. Software
-
2. Technology
- 2.1. Film Radiography
- 2.2. Computed Radiography
- 2.3. Direct Radiography
- 2.4. Computed Tomography
-
3. End-user Industry
- 3.1. Aerospace
- 3.2. Food Industry
- 3.3. Construction
- 3.4. Oil and Gas
- 3.5. Automotive and Manufacturing
- 3.6. Energy and Power
- 3.7. Semiconductor and Electronics
- 3.8. Other End-user Industries
Industrial Radiography Equipment Industry Segmentation By Geography
- 1. North America
- 2. Europe
- 3. Asia Pacific
- 4. Latin America
- 5. Middle East and Africa
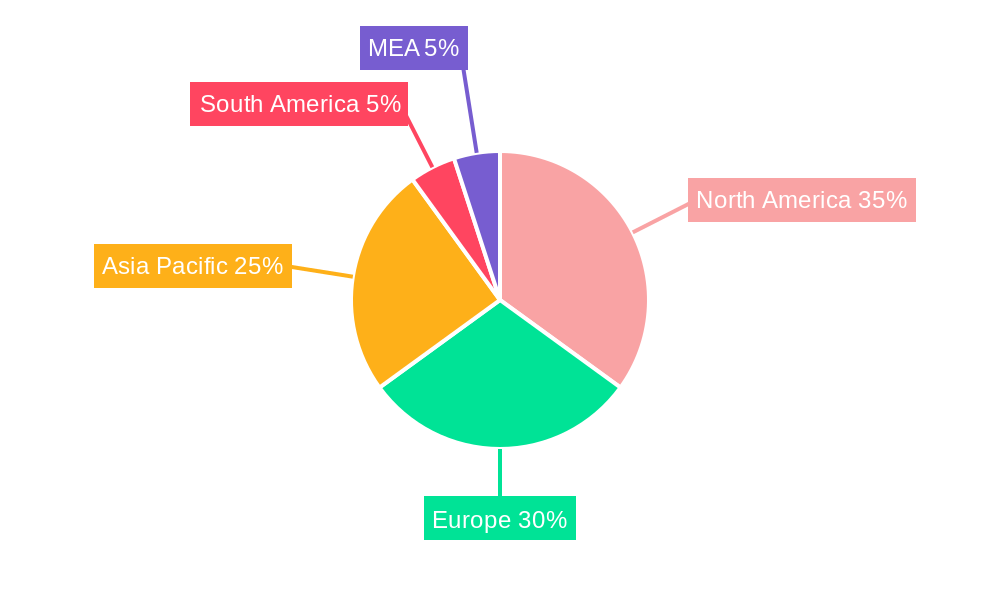
Industrial Radiography Equipment Industry Regional Market Share
Geographic Coverage of Industrial Radiography Equipment Industry
Industrial Radiography Equipment Industry REPORT HIGHLIGHTS
| Aspects | Details |
|---|---|
| Study Period | 2020-2034 |
| Base Year | 2025 |
| Estimated Year | 2026 |
| Forecast Period | 2026-2034 |
| Historical Period | 2020-2025 |
| Growth Rate | CAGR of 8.6% from 2020-2034 |
| Segmentation |
|
Table of Contents
- 1. Introduction
- 1.1. Research Scope
- 1.2. Market Segmentation
- 1.3. Research Objective
- 1.4. Definitions and Assumptions
- 2. Executive Summary
- 2.1. Market Snapshot
- 3. Market Dynamics
- 3.1. Market Drivers
- 3.2. Market Restrains
- 3.3. Market Trends
- 3.4. Market Opportunities
- 4. Market Factor Analysis
- 4.1. Porters Five Forces
- 4.1.1. Bargaining Power of Suppliers
- 4.1.2. Bargaining Power of Buyers
- 4.1.3. Threat of New Entrants
- 4.1.4. Threat of Substitutes
- 4.1.5. Competitive Rivalry
- 4.2. PESTEL analysis
- 4.3. BCG Analysis
- 4.3.1. Stars (High Growth, High Market Share)
- 4.3.2. Cash Cows (Low Growth, High Market Share)
- 4.3.3. Question Mark (High Growth, Low Market Share)
- 4.3.4. Dogs (Low Growth, Low Market Share)
- 4.4. Ansoff Matrix Analysis
- 4.5. Supply Chain Analysis
- 4.6. Regulatory Landscape
- 4.7. Current Market Potential and Opportunity Assessment (TAM–SAM–SOM Framework)
- 4.8. VDR Analyst Note
- 4.1. Porters Five Forces
- 5. Market Analysis, Insights and Forecast 2021-2033
- 5.1. Market Analysis, Insights and Forecast - by Offering
- 5.1.1. Equipment
- 5.1.2. Software
- 5.2. Market Analysis, Insights and Forecast - by Technology
- 5.2.1. Film Radiography
- 5.2.2. Computed Radiography
- 5.2.3. Direct Radiography
- 5.2.4. Computed Tomography
- 5.3. Market Analysis, Insights and Forecast - by End-user Industry
- 5.3.1. Aerospace
- 5.3.2. Food Industry
- 5.3.3. Construction
- 5.3.4. Oil and Gas
- 5.3.5. Automotive and Manufacturing
- 5.3.6. Energy and Power
- 5.3.7. Semiconductor and Electronics
- 5.3.8. Other End-user Industries
- 5.4. Market Analysis, Insights and Forecast - by Region
- 5.4.1. North America
- 5.4.2. Europe
- 5.4.3. Asia Pacific
- 5.4.4. Latin America
- 5.4.5. Middle East and Africa
- 5.1. Market Analysis, Insights and Forecast - by Offering
- 6. Global Industrial Radiography Equipment Industry Analysis, Insights and Forecast, 2021-2033
- 6.1. Market Analysis, Insights and Forecast - by Offering
- 6.1.1. Equipment
- 6.1.2. Software
- 6.2. Market Analysis, Insights and Forecast - by Technology
- 6.2.1. Film Radiography
- 6.2.2. Computed Radiography
- 6.2.3. Direct Radiography
- 6.2.4. Computed Tomography
- 6.3. Market Analysis, Insights and Forecast - by End-user Industry
- 6.3.1. Aerospace
- 6.3.2. Food Industry
- 6.3.3. Construction
- 6.3.4. Oil and Gas
- 6.3.5. Automotive and Manufacturing
- 6.3.6. Energy and Power
- 6.3.7. Semiconductor and Electronics
- 6.3.8. Other End-user Industries
- 6.1. Market Analysis, Insights and Forecast - by Offering
- 7. North America Industrial Radiography Equipment Industry Analysis, Insights and Forecast, 2021-2033
- 7.1. Market Analysis, Insights and Forecast - by Offering
- 7.1.1. Equipment
- 7.1.2. Software
- 7.2. Market Analysis, Insights and Forecast - by Technology
- 7.2.1. Film Radiography
- 7.2.2. Computed Radiography
- 7.2.3. Direct Radiography
- 7.2.4. Computed Tomography
- 7.3. Market Analysis, Insights and Forecast - by End-user Industry
- 7.3.1. Aerospace
- 7.3.2. Food Industry
- 7.3.3. Construction
- 7.3.4. Oil and Gas
- 7.3.5. Automotive and Manufacturing
- 7.3.6. Energy and Power
- 7.3.7. Semiconductor and Electronics
- 7.3.8. Other End-user Industries
- 7.1. Market Analysis, Insights and Forecast - by Offering
- 8. Europe Industrial Radiography Equipment Industry Analysis, Insights and Forecast, 2021-2033
- 8.1. Market Analysis, Insights and Forecast - by Offering
- 8.1.1. Equipment
- 8.1.2. Software
- 8.2. Market Analysis, Insights and Forecast - by Technology
- 8.2.1. Film Radiography
- 8.2.2. Computed Radiography
- 8.2.3. Direct Radiography
- 8.2.4. Computed Tomography
- 8.3. Market Analysis, Insights and Forecast - by End-user Industry
- 8.3.1. Aerospace
- 8.3.2. Food Industry
- 8.3.3. Construction
- 8.3.4. Oil and Gas
- 8.3.5. Automotive and Manufacturing
- 8.3.6. Energy and Power
- 8.3.7. Semiconductor and Electronics
- 8.3.8. Other End-user Industries
- 8.1. Market Analysis, Insights and Forecast - by Offering
- 9. Asia Pacific Industrial Radiography Equipment Industry Analysis, Insights and Forecast, 2021-2033
- 9.1. Market Analysis, Insights and Forecast - by Offering
- 9.1.1. Equipment
- 9.1.2. Software
- 9.2. Market Analysis, Insights and Forecast - by Technology
- 9.2.1. Film Radiography
- 9.2.2. Computed Radiography
- 9.2.3. Direct Radiography
- 9.2.4. Computed Tomography
- 9.3. Market Analysis, Insights and Forecast - by End-user Industry
- 9.3.1. Aerospace
- 9.3.2. Food Industry
- 9.3.3. Construction
- 9.3.4. Oil and Gas
- 9.3.5. Automotive and Manufacturing
- 9.3.6. Energy and Power
- 9.3.7. Semiconductor and Electronics
- 9.3.8. Other End-user Industries
- 9.1. Market Analysis, Insights and Forecast - by Offering
- 10. Latin America Industrial Radiography Equipment Industry Analysis, Insights and Forecast, 2021-2033
- 10.1. Market Analysis, Insights and Forecast - by Offering
- 10.1.1. Equipment
- 10.1.2. Software
- 10.2. Market Analysis, Insights and Forecast - by Technology
- 10.2.1. Film Radiography
- 10.2.2. Computed Radiography
- 10.2.3. Direct Radiography
- 10.2.4. Computed Tomography
- 10.3. Market Analysis, Insights and Forecast - by End-user Industry
- 10.3.1. Aerospace
- 10.3.2. Food Industry
- 10.3.3. Construction
- 10.3.4. Oil and Gas
- 10.3.5. Automotive and Manufacturing
- 10.3.6. Energy and Power
- 10.3.7. Semiconductor and Electronics
- 10.3.8. Other End-user Industries
- 10.1. Market Analysis, Insights and Forecast - by Offering
- 11. Middle East and Africa Industrial Radiography Equipment Industry Analysis, Insights and Forecast, 2021-2033
- 11.1. Market Analysis, Insights and Forecast - by Offering
- 11.1.1. Equipment
- 11.1.2. Software
- 11.2. Market Analysis, Insights and Forecast - by Technology
- 11.2.1. Film Radiography
- 11.2.2. Computed Radiography
- 11.2.3. Direct Radiography
- 11.2.4. Computed Tomography
- 11.3. Market Analysis, Insights and Forecast - by End-user Industry
- 11.3.1. Aerospace
- 11.3.2. Food Industry
- 11.3.3. Construction
- 11.3.4. Oil and Gas
- 11.3.5. Automotive and Manufacturing
- 11.3.6. Energy and Power
- 11.3.7. Semiconductor and Electronics
- 11.3.8. Other End-user Industries
- 11.1. Market Analysis, Insights and Forecast - by Offering
- 12. Competitive Analysis
- 12.1. Company Profiles
- 12.1.1 Bosello High Technology SRL
- 12.1.1.1. Company Overview
- 12.1.1.2. Products
- 12.1.1.3. Company Financials
- 12.1.1.4. SWOT Analysis
- 12.1.2 Canon Inc
- 12.1.2.1. Company Overview
- 12.1.2.2. Products
- 12.1.2.3. Company Financials
- 12.1.2.4. SWOT Analysis
- 12.1.3 Nikon Corporation
- 12.1.3.1. Company Overview
- 12.1.3.2. Products
- 12.1.3.3. Company Financials
- 12.1.3.4. SWOT Analysis
- 12.1.4 L3Harris Security & Detection Systems
- 12.1.4.1. Company Overview
- 12.1.4.2. Products
- 12.1.4.3. Company Financials
- 12.1.4.4. SWOT Analysis
- 12.1.5 Vidisco Ltd
- 12.1.5.1. Company Overview
- 12.1.5.2. Products
- 12.1.5.3. Company Financials
- 12.1.5.4. SWOT Analysis
- 12.1.6 Dürr NDT Gmbh & Co KG
- 12.1.6.1. Company Overview
- 12.1.6.2. Products
- 12.1.6.3. Company Financials
- 12.1.6.4. SWOT Analysis
- 12.1.7 Teledyne Dalsa Inc
- 12.1.7.1. Company Overview
- 12.1.7.2. Products
- 12.1.7.3. Company Financials
- 12.1.7.4. SWOT Analysis
- 12.1.8 North Star Imaging Inc
- 12.1.8.1. Company Overview
- 12.1.8.2. Products
- 12.1.8.3. Company Financials
- 12.1.8.4. SWOT Analysis
- 12.1.9 YXLON International
- 12.1.9.1. Company Overview
- 12.1.9.2. Products
- 12.1.9.3. Company Financials
- 12.1.9.4. SWOT Analysis
- 12.1.10 Hamamatsu Photonics K K
- 12.1.10.1. Company Overview
- 12.1.10.2. Products
- 12.1.10.3. Company Financials
- 12.1.10.4. SWOT Analysis
- 12.1.11 Carestream Health Inc
- 12.1.11.1. Company Overview
- 12.1.11.2. Products
- 12.1.11.3. Company Financials
- 12.1.11.4. SWOT Analysis
- 12.1.12 Hitachi Ltd
- 12.1.12.1. Company Overview
- 12.1.12.2. Products
- 12.1.12.3. Company Financials
- 12.1.12.4. SWOT Analysis
- 12.1.13 General Electric Company
- 12.1.13.1. Company Overview
- 12.1.13.2. Products
- 12.1.13.3. Company Financials
- 12.1.13.4. SWOT Analysis
- 12.1.14 Olympus Corporation
- 12.1.14.1. Company Overview
- 12.1.14.2. Products
- 12.1.14.3. Company Financials
- 12.1.14.4. SWOT Analysis
- 12.1.15 Rigaku Corporation
- 12.1.15.1. Company Overview
- 12.1.15.2. Products
- 12.1.15.3. Company Financials
- 12.1.15.4. SWOT Analysis
- 12.1.1 Bosello High Technology SRL
- 12.2. Market Entropy
- 12.2.1 Company's Key Areas Served
- 12.2.2 Recent Developments
- 12.3. Company Market Share Analysis 2025
- 12.3.1 Top 5 Companies Market Share Analysis
- 12.3.2 Top 3 Companies Market Share Analysis
- 12.4. List of Potential Customers
- 13. Research Methodology
List of Figures
- Figure 1: Global Industrial Radiography Equipment Industry Revenue Breakdown (billion, %) by Region 2025 & 2033
- Figure 2: Global Industrial Radiography Equipment Industry Volume Breakdown (K Unit, %) by Region 2025 & 2033
- Figure 3: North America Industrial Radiography Equipment Industry Revenue (billion), by Offering 2025 & 2033
- Figure 4: North America Industrial Radiography Equipment Industry Volume (K Unit), by Offering 2025 & 2033
- Figure 5: North America Industrial Radiography Equipment Industry Revenue Share (%), by Offering 2025 & 2033
- Figure 6: North America Industrial Radiography Equipment Industry Volume Share (%), by Offering 2025 & 2033
- Figure 7: North America Industrial Radiography Equipment Industry Revenue (billion), by Technology 2025 & 2033
- Figure 8: North America Industrial Radiography Equipment Industry Volume (K Unit), by Technology 2025 & 2033
- Figure 9: North America Industrial Radiography Equipment Industry Revenue Share (%), by Technology 2025 & 2033
- Figure 10: North America Industrial Radiography Equipment Industry Volume Share (%), by Technology 2025 & 2033
- Figure 11: North America Industrial Radiography Equipment Industry Revenue (billion), by End-user Industry 2025 & 2033
- Figure 12: North America Industrial Radiography Equipment Industry Volume (K Unit), by End-user Industry 2025 & 2033
- Figure 13: North America Industrial Radiography Equipment Industry Revenue Share (%), by End-user Industry 2025 & 2033
- Figure 14: North America Industrial Radiography Equipment Industry Volume Share (%), by End-user Industry 2025 & 2033
- Figure 15: North America Industrial Radiography Equipment Industry Revenue (billion), by Country 2025 & 2033
- Figure 16: North America Industrial Radiography Equipment Industry Volume (K Unit), by Country 2025 & 2033
- Figure 17: North America Industrial Radiography Equipment Industry Revenue Share (%), by Country 2025 & 2033
- Figure 18: North America Industrial Radiography Equipment Industry Volume Share (%), by Country 2025 & 2033
- Figure 19: Europe Industrial Radiography Equipment Industry Revenue (billion), by Offering 2025 & 2033
- Figure 20: Europe Industrial Radiography Equipment Industry Volume (K Unit), by Offering 2025 & 2033
- Figure 21: Europe Industrial Radiography Equipment Industry Revenue Share (%), by Offering 2025 & 2033
- Figure 22: Europe Industrial Radiography Equipment Industry Volume Share (%), by Offering 2025 & 2033
- Figure 23: Europe Industrial Radiography Equipment Industry Revenue (billion), by Technology 2025 & 2033
- Figure 24: Europe Industrial Radiography Equipment Industry Volume (K Unit), by Technology 2025 & 2033
- Figure 25: Europe Industrial Radiography Equipment Industry Revenue Share (%), by Technology 2025 & 2033
- Figure 26: Europe Industrial Radiography Equipment Industry Volume Share (%), by Technology 2025 & 2033
- Figure 27: Europe Industrial Radiography Equipment Industry Revenue (billion), by End-user Industry 2025 & 2033
- Figure 28: Europe Industrial Radiography Equipment Industry Volume (K Unit), by End-user Industry 2025 & 2033
- Figure 29: Europe Industrial Radiography Equipment Industry Revenue Share (%), by End-user Industry 2025 & 2033
- Figure 30: Europe Industrial Radiography Equipment Industry Volume Share (%), by End-user Industry 2025 & 2033
- Figure 31: Europe Industrial Radiography Equipment Industry Revenue (billion), by Country 2025 & 2033
- Figure 32: Europe Industrial Radiography Equipment Industry Volume (K Unit), by Country 2025 & 2033
- Figure 33: Europe Industrial Radiography Equipment Industry Revenue Share (%), by Country 2025 & 2033
- Figure 34: Europe Industrial Radiography Equipment Industry Volume Share (%), by Country 2025 & 2033
- Figure 35: Asia Pacific Industrial Radiography Equipment Industry Revenue (billion), by Offering 2025 & 2033
- Figure 36: Asia Pacific Industrial Radiography Equipment Industry Volume (K Unit), by Offering 2025 & 2033
- Figure 37: Asia Pacific Industrial Radiography Equipment Industry Revenue Share (%), by Offering 2025 & 2033
- Figure 38: Asia Pacific Industrial Radiography Equipment Industry Volume Share (%), by Offering 2025 & 2033
- Figure 39: Asia Pacific Industrial Radiography Equipment Industry Revenue (billion), by Technology 2025 & 2033
- Figure 40: Asia Pacific Industrial Radiography Equipment Industry Volume (K Unit), by Technology 2025 & 2033
- Figure 41: Asia Pacific Industrial Radiography Equipment Industry Revenue Share (%), by Technology 2025 & 2033
- Figure 42: Asia Pacific Industrial Radiography Equipment Industry Volume Share (%), by Technology 2025 & 2033
- Figure 43: Asia Pacific Industrial Radiography Equipment Industry Revenue (billion), by End-user Industry 2025 & 2033
- Figure 44: Asia Pacific Industrial Radiography Equipment Industry Volume (K Unit), by End-user Industry 2025 & 2033
- Figure 45: Asia Pacific Industrial Radiography Equipment Industry Revenue Share (%), by End-user Industry 2025 & 2033
- Figure 46: Asia Pacific Industrial Radiography Equipment Industry Volume Share (%), by End-user Industry 2025 & 2033
- Figure 47: Asia Pacific Industrial Radiography Equipment Industry Revenue (billion), by Country 2025 & 2033
- Figure 48: Asia Pacific Industrial Radiography Equipment Industry Volume (K Unit), by Country 2025 & 2033
- Figure 49: Asia Pacific Industrial Radiography Equipment Industry Revenue Share (%), by Country 2025 & 2033
- Figure 50: Asia Pacific Industrial Radiography Equipment Industry Volume Share (%), by Country 2025 & 2033
- Figure 51: Latin America Industrial Radiography Equipment Industry Revenue (billion), by Offering 2025 & 2033
- Figure 52: Latin America Industrial Radiography Equipment Industry Volume (K Unit), by Offering 2025 & 2033
- Figure 53: Latin America Industrial Radiography Equipment Industry Revenue Share (%), by Offering 2025 & 2033
- Figure 54: Latin America Industrial Radiography Equipment Industry Volume Share (%), by Offering 2025 & 2033
- Figure 55: Latin America Industrial Radiography Equipment Industry Revenue (billion), by Technology 2025 & 2033
- Figure 56: Latin America Industrial Radiography Equipment Industry Volume (K Unit), by Technology 2025 & 2033
- Figure 57: Latin America Industrial Radiography Equipment Industry Revenue Share (%), by Technology 2025 & 2033
- Figure 58: Latin America Industrial Radiography Equipment Industry Volume Share (%), by Technology 2025 & 2033
- Figure 59: Latin America Industrial Radiography Equipment Industry Revenue (billion), by End-user Industry 2025 & 2033
- Figure 60: Latin America Industrial Radiography Equipment Industry Volume (K Unit), by End-user Industry 2025 & 2033
- Figure 61: Latin America Industrial Radiography Equipment Industry Revenue Share (%), by End-user Industry 2025 & 2033
- Figure 62: Latin America Industrial Radiography Equipment Industry Volume Share (%), by End-user Industry 2025 & 2033
- Figure 63: Latin America Industrial Radiography Equipment Industry Revenue (billion), by Country 2025 & 2033
- Figure 64: Latin America Industrial Radiography Equipment Industry Volume (K Unit), by Country 2025 & 2033
- Figure 65: Latin America Industrial Radiography Equipment Industry Revenue Share (%), by Country 2025 & 2033
- Figure 66: Latin America Industrial Radiography Equipment Industry Volume Share (%), by Country 2025 & 2033
- Figure 67: Middle East and Africa Industrial Radiography Equipment Industry Revenue (billion), by Offering 2025 & 2033
- Figure 68: Middle East and Africa Industrial Radiography Equipment Industry Volume (K Unit), by Offering 2025 & 2033
- Figure 69: Middle East and Africa Industrial Radiography Equipment Industry Revenue Share (%), by Offering 2025 & 2033
- Figure 70: Middle East and Africa Industrial Radiography Equipment Industry Volume Share (%), by Offering 2025 & 2033
- Figure 71: Middle East and Africa Industrial Radiography Equipment Industry Revenue (billion), by Technology 2025 & 2033
- Figure 72: Middle East and Africa Industrial Radiography Equipment Industry Volume (K Unit), by Technology 2025 & 2033
- Figure 73: Middle East and Africa Industrial Radiography Equipment Industry Revenue Share (%), by Technology 2025 & 2033
- Figure 74: Middle East and Africa Industrial Radiography Equipment Industry Volume Share (%), by Technology 2025 & 2033
- Figure 75: Middle East and Africa Industrial Radiography Equipment Industry Revenue (billion), by End-user Industry 2025 & 2033
- Figure 76: Middle East and Africa Industrial Radiography Equipment Industry Volume (K Unit), by End-user Industry 2025 & 2033
- Figure 77: Middle East and Africa Industrial Radiography Equipment Industry Revenue Share (%), by End-user Industry 2025 & 2033
- Figure 78: Middle East and Africa Industrial Radiography Equipment Industry Volume Share (%), by End-user Industry 2025 & 2033
- Figure 79: Middle East and Africa Industrial Radiography Equipment Industry Revenue (billion), by Country 2025 & 2033
- Figure 80: Middle East and Africa Industrial Radiography Equipment Industry Volume (K Unit), by Country 2025 & 2033
- Figure 81: Middle East and Africa Industrial Radiography Equipment Industry Revenue Share (%), by Country 2025 & 2033
- Figure 82: Middle East and Africa Industrial Radiography Equipment Industry Volume Share (%), by Country 2025 & 2033
List of Tables
- Table 1: Global Industrial Radiography Equipment Industry Revenue billion Forecast, by Offering 2020 & 2033
- Table 2: Global Industrial Radiography Equipment Industry Volume K Unit Forecast, by Offering 2020 & 2033
- Table 3: Global Industrial Radiography Equipment Industry Revenue billion Forecast, by Technology 2020 & 2033
- Table 4: Global Industrial Radiography Equipment Industry Volume K Unit Forecast, by Technology 2020 & 2033
- Table 5: Global Industrial Radiography Equipment Industry Revenue billion Forecast, by End-user Industry 2020 & 2033
- Table 6: Global Industrial Radiography Equipment Industry Volume K Unit Forecast, by End-user Industry 2020 & 2033
- Table 7: Global Industrial Radiography Equipment Industry Revenue billion Forecast, by Region 2020 & 2033
- Table 8: Global Industrial Radiography Equipment Industry Volume K Unit Forecast, by Region 2020 & 2033
- Table 9: Global Industrial Radiography Equipment Industry Revenue billion Forecast, by Offering 2020 & 2033
- Table 10: Global Industrial Radiography Equipment Industry Volume K Unit Forecast, by Offering 2020 & 2033
- Table 11: Global Industrial Radiography Equipment Industry Revenue billion Forecast, by Technology 2020 & 2033
- Table 12: Global Industrial Radiography Equipment Industry Volume K Unit Forecast, by Technology 2020 & 2033
- Table 13: Global Industrial Radiography Equipment Industry Revenue billion Forecast, by End-user Industry 2020 & 2033
- Table 14: Global Industrial Radiography Equipment Industry Volume K Unit Forecast, by End-user Industry 2020 & 2033
- Table 15: Global Industrial Radiography Equipment Industry Revenue billion Forecast, by Country 2020 & 2033
- Table 16: Global Industrial Radiography Equipment Industry Volume K Unit Forecast, by Country 2020 & 2033
- Table 17: Global Industrial Radiography Equipment Industry Revenue billion Forecast, by Offering 2020 & 2033
- Table 18: Global Industrial Radiography Equipment Industry Volume K Unit Forecast, by Offering 2020 & 2033
- Table 19: Global Industrial Radiography Equipment Industry Revenue billion Forecast, by Technology 2020 & 2033
- Table 20: Global Industrial Radiography Equipment Industry Volume K Unit Forecast, by Technology 2020 & 2033
- Table 21: Global Industrial Radiography Equipment Industry Revenue billion Forecast, by End-user Industry 2020 & 2033
- Table 22: Global Industrial Radiography Equipment Industry Volume K Unit Forecast, by End-user Industry 2020 & 2033
- Table 23: Global Industrial Radiography Equipment Industry Revenue billion Forecast, by Country 2020 & 2033
- Table 24: Global Industrial Radiography Equipment Industry Volume K Unit Forecast, by Country 2020 & 2033
- Table 25: Global Industrial Radiography Equipment Industry Revenue billion Forecast, by Offering 2020 & 2033
- Table 26: Global Industrial Radiography Equipment Industry Volume K Unit Forecast, by Offering 2020 & 2033
- Table 27: Global Industrial Radiography Equipment Industry Revenue billion Forecast, by Technology 2020 & 2033
- Table 28: Global Industrial Radiography Equipment Industry Volume K Unit Forecast, by Technology 2020 & 2033
- Table 29: Global Industrial Radiography Equipment Industry Revenue billion Forecast, by End-user Industry 2020 & 2033
- Table 30: Global Industrial Radiography Equipment Industry Volume K Unit Forecast, by End-user Industry 2020 & 2033
- Table 31: Global Industrial Radiography Equipment Industry Revenue billion Forecast, by Country 2020 & 2033
- Table 32: Global Industrial Radiography Equipment Industry Volume K Unit Forecast, by Country 2020 & 2033
- Table 33: Global Industrial Radiography Equipment Industry Revenue billion Forecast, by Offering 2020 & 2033
- Table 34: Global Industrial Radiography Equipment Industry Volume K Unit Forecast, by Offering 2020 & 2033
- Table 35: Global Industrial Radiography Equipment Industry Revenue billion Forecast, by Technology 2020 & 2033
- Table 36: Global Industrial Radiography Equipment Industry Volume K Unit Forecast, by Technology 2020 & 2033
- Table 37: Global Industrial Radiography Equipment Industry Revenue billion Forecast, by End-user Industry 2020 & 2033
- Table 38: Global Industrial Radiography Equipment Industry Volume K Unit Forecast, by End-user Industry 2020 & 2033
- Table 39: Global Industrial Radiography Equipment Industry Revenue billion Forecast, by Country 2020 & 2033
- Table 40: Global Industrial Radiography Equipment Industry Volume K Unit Forecast, by Country 2020 & 2033
- Table 41: Global Industrial Radiography Equipment Industry Revenue billion Forecast, by Offering 2020 & 2033
- Table 42: Global Industrial Radiography Equipment Industry Volume K Unit Forecast, by Offering 2020 & 2033
- Table 43: Global Industrial Radiography Equipment Industry Revenue billion Forecast, by Technology 2020 & 2033
- Table 44: Global Industrial Radiography Equipment Industry Volume K Unit Forecast, by Technology 2020 & 2033
- Table 45: Global Industrial Radiography Equipment Industry Revenue billion Forecast, by End-user Industry 2020 & 2033
- Table 46: Global Industrial Radiography Equipment Industry Volume K Unit Forecast, by End-user Industry 2020 & 2033
- Table 47: Global Industrial Radiography Equipment Industry Revenue billion Forecast, by Country 2020 & 2033
- Table 48: Global Industrial Radiography Equipment Industry Volume K Unit Forecast, by Country 2020 & 2033
Frequently Asked Questions
1. What is the projected Compound Annual Growth Rate (CAGR) of the Industrial Radiography Equipment Industry?
The projected CAGR is approximately 8.6%.
2. Which companies are prominent players in the Industrial Radiography Equipment Industry?
Key companies in the market include Bosello High Technology SRL, Canon Inc, Nikon Corporation, L3Harris Security & Detection Systems, Vidisco Ltd, Dürr NDT Gmbh & Co KG, Teledyne Dalsa Inc, North Star Imaging Inc, YXLON International, Hamamatsu Photonics K K, Carestream Health Inc, Hitachi Ltd, General Electric Company, Olympus Corporation, Rigaku Corporation.
3. What are the main segments of the Industrial Radiography Equipment Industry?
The market segments include Offering, Technology, End-user Industry.
4. Can you provide details about the market size?
The market size is estimated to be USD 1.35 billion as of 2022.
5. What are some drivers contributing to market growth?
; Growing Demand for Portable and Miniaturized Equipment; Recovering Demand from the Oil and Gas Industry.
6. What are the notable trends driving market growth?
Recovering Demand from Oil and Gas Industry will Drive the Market.
7. Are there any restraints impacting market growth?
Lack in Awareness.
8. Can you provide examples of recent developments in the market?
N/A
9. What pricing options are available for accessing the report?
Pricing options include single-user, multi-user, and enterprise licenses priced at USD 4750, USD 5250, and USD 8750 respectively.
10. Is the market size provided in terms of value or volume?
The market size is provided in terms of value, measured in billion and volume, measured in K Unit.
11. Are there any specific market keywords associated with the report?
Yes, the market keyword associated with the report is "Industrial Radiography Equipment Industry," which aids in identifying and referencing the specific market segment covered.
12. How do I determine which pricing option suits my needs best?
The pricing options vary based on user requirements and access needs. Individual users may opt for single-user licenses, while businesses requiring broader access may choose multi-user or enterprise licenses for cost-effective access to the report.
13. Are there any additional resources or data provided in the Industrial Radiography Equipment Industry report?
While the report offers comprehensive insights, it's advisable to review the specific contents or supplementary materials provided to ascertain if additional resources or data are available.
14. How can I stay updated on further developments or reports in the Industrial Radiography Equipment Industry?
To stay informed about further developments, trends, and reports in the Industrial Radiography Equipment Industry, consider subscribing to industry newsletters, following relevant companies and organizations, or regularly checking reputable industry news sources and publications.
Methodology
Step 1 - Identification of Relevant Samples Size from Population Database


Step 2 - Approaches for Defining Global Market Size (Value, Volume* & Price*)

Note*: In applicable scenarios
Step 3 - Data Sources
Primary Research
- Web Analytics
- Survey Reports
- Research Institute
- Latest Research Reports
- Opinion Leaders
Secondary Research
- Annual Reports
- White Paper
- Latest Press Release
- Industry Association
- Paid Database
- Investor Presentations

Step 4 - Data Triangulation
Involves using different sources of information in order to increase the validity of a study
These sources are likely to be stakeholders in a program - participants, other researchers, program staff, other community members, and so on.
Then we put all data in single framework & apply various statistical tools to find out the dynamic on the market.
During the analysis stage, feedback from the stakeholder groups would be compared to determine areas of agreement as well as areas of divergence