

Key Insights
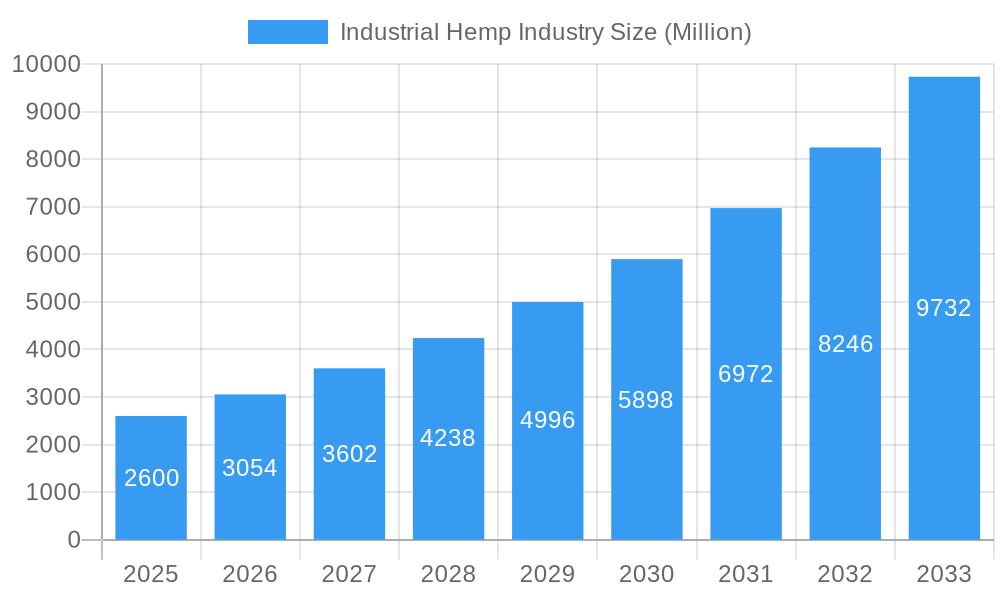
The industrial hemp market, valued at $2.6 billion in 2025, is experiencing robust growth, projected to expand at a Compound Annual Growth Rate (CAGR) exceeding 17% from 2025 to 2033. This surge is driven by increasing demand across diverse sectors, primarily fueled by the burgeoning CBD market, growing applications in textiles, construction materials (hempcrete), and bioplastics, and the rising awareness of hemp's sustainability and environmentally friendly attributes. Government regulations and policies promoting hemp cultivation and product development are further bolstering market expansion. The market is segmented by product type (CBD oil, hemp seeds, fiber, etc.), application (cosmetics, food & beverages, pharmaceuticals, etc.), and geography. Competition is intense, with established players like International Flavors & Fragrances and Firmenich alongside emerging companies like Charlotte's Web Holdings and GenCanna vying for market share. Challenges include inconsistent regulations across different regions, the need for standardization of hemp products, and overcoming consumer misconceptions about hemp's relationship to marijuana.
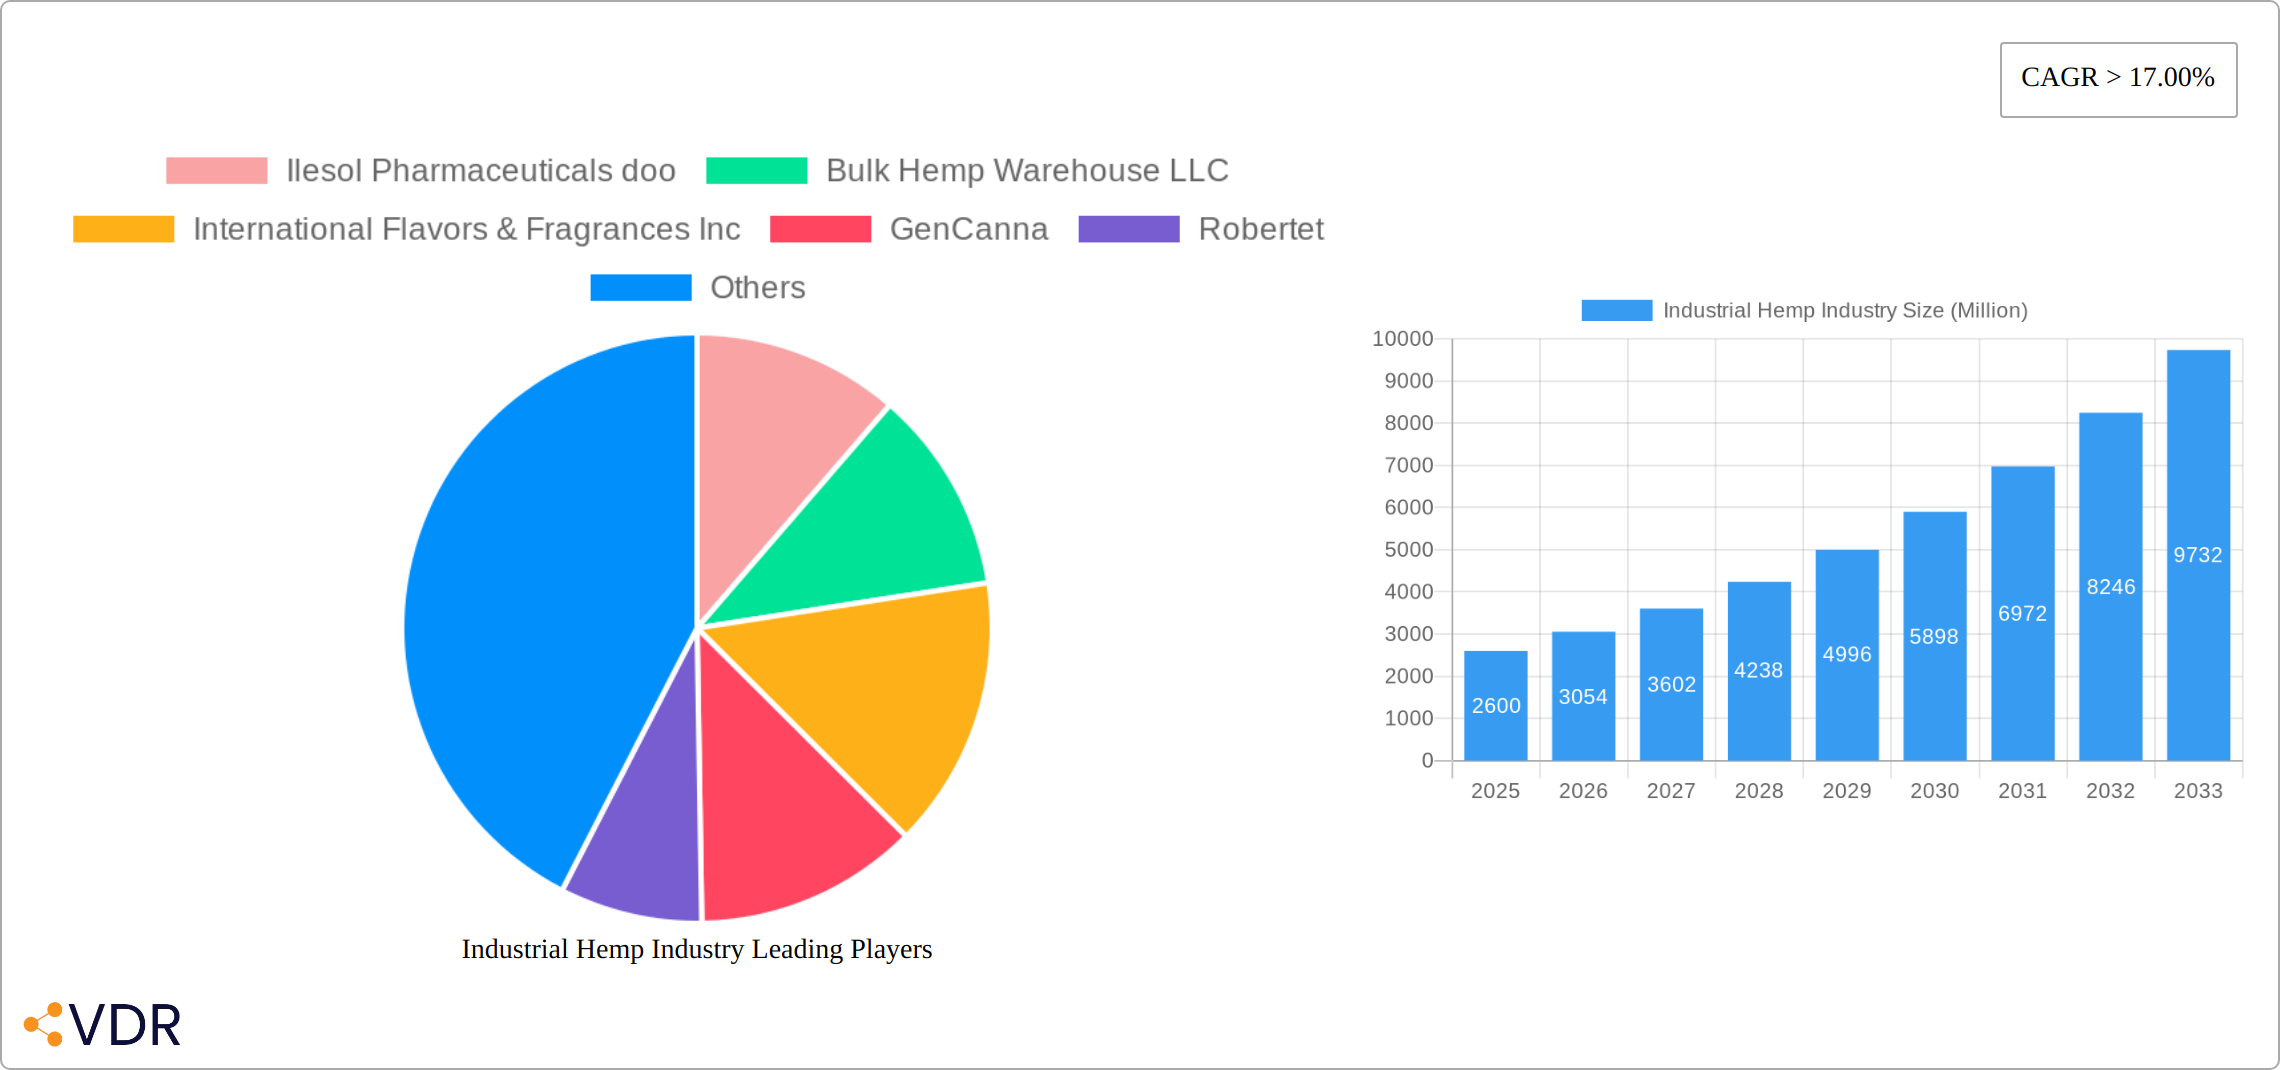
Industrial Hemp Industry Market Size (In Billion)
The projected growth trajectory indicates significant opportunities for investment and innovation within the industrial hemp industry. Future market success will hinge on companies' ability to adapt to evolving regulations, develop high-quality, standardized products, and effectively communicate the benefits of hemp to consumers. Technological advancements in hemp processing and extraction are crucial for optimizing production efficiency and reducing costs. Furthermore, strategic partnerships and collaborations between industry stakeholders will be vital in promoting sustainable and responsible hemp cultivation practices. Expansion into new applications, such as bioremediation and the development of innovative hemp-based materials, presents considerable potential for long-term market growth. The continued focus on sustainability and eco-friendly solutions further positions the industrial hemp industry for considerable future expansion.
Industrial Hemp Industry Company Market Share
Industrial Hemp Industry: A Comprehensive Market Report (2019-2033)
This comprehensive report provides an in-depth analysis of the Industrial Hemp Industry, offering invaluable insights for industry professionals, investors, and stakeholders. The report covers the period from 2019 to 2033, with a focus on the forecast period of 2025-2033 and a base year of 2025. We examine the market dynamics, growth trends, key players, and future opportunities within this rapidly evolving sector, encompassing both parent (Cannabis) and child (Industrial Hemp) markets. The global market size is projected to reach xx Million by 2033.
Parent Market: Cannabis Industry Child Market: Industrial Hemp
Industrial Hemp Industry Market Dynamics & Structure
This section analyzes the market concentration, technological innovation, regulatory landscapes, competitive substitutes, end-user demographics, and M&A activities within the industrial hemp industry. The market is characterized by a moderately fragmented landscape, with several key players vying for market share. However, consolidation is expected to accelerate, driven by strategic acquisitions and partnerships.
- Market Concentration: Moderately Fragmented (xx% market share held by top 5 players in 2024).
- Technological Innovation: Focus on improved cultivation techniques, extraction methods, and downstream processing to enhance product quality and efficiency. Significant barriers to entry exist due to specialized knowledge and capital requirements.
- Regulatory Frameworks: Vary widely across regions, impacting market growth and investment. Harmonization of regulations is a critical factor for future expansion.
- Competitive Product Substitutes: Synthetic alternatives exist for some hemp-derived products, posing competitive pressure. However, the growing demand for natural and sustainable products is bolstering the adoption of hemp-based solutions.
- End-User Demographics: Diverse end-user segments, including the food and beverage, textiles, construction, and cosmetics industries. The expansion of applications drives market growth.
- M&A Trends: Increasing M&A activity, particularly among smaller companies seeking to gain scale and access to new technologies. xx M&A deals were recorded in 2024.
Industrial Hemp Industry Growth Trends & Insights
The industrial hemp market has witnessed significant growth over the historical period (2019-2024), driven by increased legalization, rising consumer awareness, and technological advancements. This section analyzes the market size evolution, adoption rates, technological disruptions, and consumer behavior shifts using a proprietary analytical model (XXX). The market is anticipated to experience a CAGR of xx% during the forecast period (2025-2033).
Market penetration in key sectors like textiles and construction is expected to increase substantially, driven by the growing demand for sustainable and eco-friendly materials. Furthermore, technological innovations in extraction and processing methods are improving the efficiency and quality of hemp-derived products, contributing to market expansion. Consumer preference for natural and sustainable products is another major driver of growth.
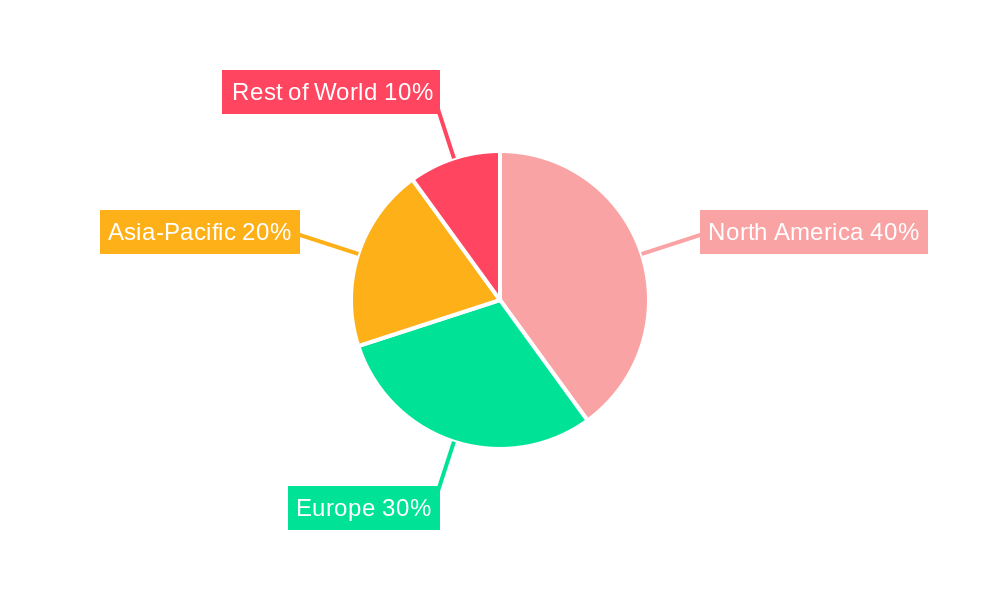
Dominant Regions, Countries, or Segments in Industrial Hemp Industry
The industrial hemp market is experiencing significant growth, with North America currently holding the leading position, followed closely by Europe. This dominance stems from a confluence of factors, including early adoption of legalization, robust infrastructure development, and substantial investment in research and development. However, the global landscape is dynamic, with other regions poised for rapid expansion.
- North America (USA & Canada): Early legalization paved the way for substantial infrastructure development and significant private investment in R&D, driving its market leadership. The established supply chains and processing capabilities in these regions provide a competitive edge.
- Europe: Increased consumer acceptance of hemp-derived products, coupled with supportive regulatory frameworks in key countries, is fueling strong growth. This region shows potential for significant expansion in both production and consumption.
- Asia-Pacific: Rapidly emerging as a major player, driven by rising demand and increasingly favorable government policies in several key nations. This region presents significant untapped potential for future growth.
- Other Regions: South America and Africa are showing increasing interest and investment in the industrial hemp industry, although challenges in regulation and infrastructure still remain.
Key Growth Drivers:
- Progressive Regulatory Frameworks: Supportive government policies are crucial for encouraging hemp cultivation and processing, fostering industry growth.
- Enhanced Consumer Awareness: Growing understanding of the diverse benefits of hemp-derived products fuels demand across various sectors.
- Technological Innovation: Advancements in cultivation techniques, extraction methods, and processing technologies are constantly improving product quality and efficiency.
- Diverse Applications: The versatility of hemp is driving expansion into numerous industries, including textiles, construction, food, cosmetics, and bioplastics.
Industrial Hemp Industry Product Landscape
The industrial hemp product landscape is remarkably diverse, encompassing a wide array of products derived from different parts of the plant. Innovation is a core driver, continuously improving product quality, functionality, and sustainability. Advances in extraction technologies, particularly for CBD and other cannabinoids, are unlocking new applications and expanding market opportunities. This innovation leads to unique selling propositions, enhanced consumer appeal, and wider adoption across various industries.
Key Drivers, Barriers & Challenges in Industrial Hemp Industry
Key Drivers:
- Increasing demand for sustainable and eco-friendly materials.
- Growing consumer awareness of the health benefits of CBD and other cannabinoids.
- Technological advancements in cultivation, extraction, and processing.
- Supportive government policies in several regions.
Key Barriers and Challenges:
- Varying and often restrictive regulatory frameworks across different regions.
- Supply chain complexities and logistical challenges.
- Competition from synthetic alternatives and traditional materials.
- Concerns about the potential for misuse of hemp-derived products. This results in an estimated xx Million loss annually.
Emerging Opportunities in Industrial Hemp Industry
Significant growth opportunities exist in developing countries, particularly in Asia and Africa, where untapped markets hold immense potential. Innovative applications in sectors like bioplastics, construction materials (hempcrete), and pharmaceuticals are driving market diversification. Furthermore, the rising consumer preference for natural and sustainable products is significantly boosting demand for hemp-derived ingredients in the cosmetics and food & beverage sectors.
Growth Accelerators in the Industrial Hemp Industry Industry
Technological breakthroughs in genetic engineering and precision agriculture are enhancing the yield and quality of hemp. Strategic partnerships between hemp producers, processors, and manufacturers are streamlining the supply chain and accelerating market penetration. Expansive marketing campaigns are increasing consumer awareness of the benefits of hemp-derived products, which is likely to lead to a xx Million increase in market value by 2030.
Key Players Shaping the Industrial Hemp Industry Market
- Ilesol Pharmaceuticals doo
- Bulk Hemp Warehouse LLC
- International Flavors & Fragrances Inc
- GenCanna
- Robertet
- Firmenich SA
- Charlotte's Web Holdings Inc
- True Terpenes
- Puricon
- PharmaCielo Ltd
- Silver Lion Farms
- Bomar Agra Estates LLC
- Colorado Breeders Depot
- 33 Supply LLC
- Green Passion (Canway Schweiz GmbH)
- Victory Hemp Foods
- Hemp Oil Canada
- Manitoba Harvest (Tilray)
- HempFlax Group BV
- Entoura
- Bedrocan
- Signature Products
- Nutiva hemp Oil
- Temp Co Canada
- Hemp Acres USA
- List Not Exhaustive
Notable Milestones in Industrial Hemp Industry Sector
- January 2022: MariMed Inc. acquired Green Growth Group Inc., expanding its presence in the Illinois cannabis market, demonstrating consolidation within the sector.
- January 2022: MariMed Inc. acquired Kind Therapeutics USA LLC, strengthening its vertical integration in Maryland, highlighting strategic moves for market share growth.
- [Add other relevant milestones here with dates and brief descriptions] - Include other significant acquisitions, partnerships, regulatory changes, or product launches that have impacted the industry.
In-Depth Industrial Hemp Industry Market Outlook
The industrial hemp market is poised for significant growth over the coming years. Technological advancements, strategic partnerships, and expansion into new markets will drive this growth. The increasing demand for sustainable and eco-friendly products, coupled with the growing consumer awareness of hemp’s numerous benefits, positions the industry for long-term success. The market is projected to reach xx Million by 2033, presenting substantial opportunities for investors and industry players.
Industrial Hemp Industry Segmentation
-
1. Type
- 1.1. Hemp Seed (Consumed Raw, Cooked or Roasted)
- 1.2. Hemp Seed Oil
- 1.3. Cannabidiol (CBD) Hemp Oil
- 1.4. Hemp Protein (Supplement)
- 1.5. Hemp Extract (Without CBD)
-
2. Application
- 2.1. Food and Beverages
- 2.2. Healthcare Supplements
- 2.3. Other Applications
Industrial Hemp Industry Segmentation By Geography
-
1. Asia Pacific
- 1.1. China
- 1.2. India
- 1.3. Japan
- 1.4. South Korea
- 1.5. Malaysia
- 1.6. Thailand
- 1.7. Indonesia
- 1.8. Vietnam
- 1.9. Rest of Asia Pacific
-
2. North America
- 2.1. United States
- 2.2. Canada
- 2.3. Mexico
-
3. Europe
- 3.1. Germany
- 3.2. United Kingdom
- 3.3. France
- 3.4. Italy
- 3.5. Spain
- 3.6. Turkey
- 3.7. Russia
- 3.8. NORDIC Countries
- 3.9. Rest of Europe
-
4. South America
- 4.1. Brazil
- 4.2. Argentina
- 4.3. Colombia
- 4.4. Rest of South America
-
5. Middle East and Africa
- 5.1. Saudi Arabia
- 5.2. Nigeria
- 5.3. Qatar
- 5.4. Egypt
- 5.5. United Arab Emirates
- 5.6. South Africa
- 5.7. Rest of Middle East and Africa
Industrial Hemp Industry Regional Market Share
Geographic Coverage of Industrial Hemp Industry
Industrial Hemp Industry REPORT HIGHLIGHTS
| Aspects | Details |
|---|---|
| Study Period | 2020-2034 |
| Base Year | 2025 |
| Estimated Year | 2026 |
| Forecast Period | 2026-2034 |
| Historical Period | 2020-2025 |
| Growth Rate | CAGR of > 17.00% from 2020-2034 |
| Segmentation |
|
Table of Contents
- 1. Introduction
- 1.1. Research Scope
- 1.2. Market Segmentation
- 1.3. Research Objective
- 1.4. Definitions and Assumptions
- 2. Executive Summary
- 2.1. Market Snapshot
- 3. Market Dynamics
- 3.1. Market Drivers
- 3.2. Market Restrains
- 3.3. Market Trends
- 3.4. Market Opportunities
- 4. Market Factor Analysis
- 4.1. Porters Five Forces
- 4.1.1. Bargaining Power of Suppliers
- 4.1.2. Bargaining Power of Buyers
- 4.1.3. Threat of New Entrants
- 4.1.4. Threat of Substitutes
- 4.1.5. Competitive Rivalry
- 4.2. PESTEL analysis
- 4.3. BCG Analysis
- 4.3.1. Stars (High Growth, High Market Share)
- 4.3.2. Cash Cows (Low Growth, High Market Share)
- 4.3.3. Question Mark (High Growth, Low Market Share)
- 4.3.4. Dogs (Low Growth, Low Market Share)
- 4.4. Ansoff Matrix Analysis
- 4.5. Supply Chain Analysis
- 4.6. Regulatory Landscape
- 4.7. Current Market Potential and Opportunity Assessment (TAM–SAM–SOM Framework)
- 4.8. VDR Analyst Note
- 4.1. Porters Five Forces
- 5. Market Analysis, Insights and Forecast 2021-2033
- 5.1. Market Analysis, Insights and Forecast - by Type
- 5.1.1. Hemp Seed (Consumed Raw, Cooked or Roasted)
- 5.1.2. Hemp Seed Oil
- 5.1.3. Cannabidiol (CBD) Hemp Oil
- 5.1.4. Hemp Protein (Supplement)
- 5.1.5. Hemp Extract (Without CBD)
- 5.2. Market Analysis, Insights and Forecast - by Application
- 5.2.1. Food and Beverages
- 5.2.2. Healthcare Supplements
- 5.2.3. Other Applications
- 5.3. Market Analysis, Insights and Forecast - by Region
- 5.3.1. Asia Pacific
- 5.3.2. North America
- 5.3.3. Europe
- 5.3.4. South America
- 5.3.5. Middle East and Africa
- 5.1. Market Analysis, Insights and Forecast - by Type
- 6. Global Industrial Hemp Industry Analysis, Insights and Forecast, 2021-2033
- 6.1. Market Analysis, Insights and Forecast - by Type
- 6.1.1. Hemp Seed (Consumed Raw, Cooked or Roasted)
- 6.1.2. Hemp Seed Oil
- 6.1.3. Cannabidiol (CBD) Hemp Oil
- 6.1.4. Hemp Protein (Supplement)
- 6.1.5. Hemp Extract (Without CBD)
- 6.2. Market Analysis, Insights and Forecast - by Application
- 6.2.1. Food and Beverages
- 6.2.2. Healthcare Supplements
- 6.2.3. Other Applications
- 6.1. Market Analysis, Insights and Forecast - by Type
- 7. Asia Pacific Industrial Hemp Industry Analysis, Insights and Forecast, 2021-2033
- 7.1. Market Analysis, Insights and Forecast - by Type
- 7.1.1. Hemp Seed (Consumed Raw, Cooked or Roasted)
- 7.1.2. Hemp Seed Oil
- 7.1.3. Cannabidiol (CBD) Hemp Oil
- 7.1.4. Hemp Protein (Supplement)
- 7.1.5. Hemp Extract (Without CBD)
- 7.2. Market Analysis, Insights and Forecast - by Application
- 7.2.1. Food and Beverages
- 7.2.2. Healthcare Supplements
- 7.2.3. Other Applications
- 7.1. Market Analysis, Insights and Forecast - by Type
- 8. North America Industrial Hemp Industry Analysis, Insights and Forecast, 2021-2033
- 8.1. Market Analysis, Insights and Forecast - by Type
- 8.1.1. Hemp Seed (Consumed Raw, Cooked or Roasted)
- 8.1.2. Hemp Seed Oil
- 8.1.3. Cannabidiol (CBD) Hemp Oil
- 8.1.4. Hemp Protein (Supplement)
- 8.1.5. Hemp Extract (Without CBD)
- 8.2. Market Analysis, Insights and Forecast - by Application
- 8.2.1. Food and Beverages
- 8.2.2. Healthcare Supplements
- 8.2.3. Other Applications
- 8.1. Market Analysis, Insights and Forecast - by Type
- 9. Europe Industrial Hemp Industry Analysis, Insights and Forecast, 2021-2033
- 9.1. Market Analysis, Insights and Forecast - by Type
- 9.1.1. Hemp Seed (Consumed Raw, Cooked or Roasted)
- 9.1.2. Hemp Seed Oil
- 9.1.3. Cannabidiol (CBD) Hemp Oil
- 9.1.4. Hemp Protein (Supplement)
- 9.1.5. Hemp Extract (Without CBD)
- 9.2. Market Analysis, Insights and Forecast - by Application
- 9.2.1. Food and Beverages
- 9.2.2. Healthcare Supplements
- 9.2.3. Other Applications
- 9.1. Market Analysis, Insights and Forecast - by Type
- 10. South America Industrial Hemp Industry Analysis, Insights and Forecast, 2021-2033
- 10.1. Market Analysis, Insights and Forecast - by Type
- 10.1.1. Hemp Seed (Consumed Raw, Cooked or Roasted)
- 10.1.2. Hemp Seed Oil
- 10.1.3. Cannabidiol (CBD) Hemp Oil
- 10.1.4. Hemp Protein (Supplement)
- 10.1.5. Hemp Extract (Without CBD)
- 10.2. Market Analysis, Insights and Forecast - by Application
- 10.2.1. Food and Beverages
- 10.2.2. Healthcare Supplements
- 10.2.3. Other Applications
- 10.1. Market Analysis, Insights and Forecast - by Type
- 11. Middle East and Africa Industrial Hemp Industry Analysis, Insights and Forecast, 2021-2033
- 11.1. Market Analysis, Insights and Forecast - by Type
- 11.1.1. Hemp Seed (Consumed Raw, Cooked or Roasted)
- 11.1.2. Hemp Seed Oil
- 11.1.3. Cannabidiol (CBD) Hemp Oil
- 11.1.4. Hemp Protein (Supplement)
- 11.1.5. Hemp Extract (Without CBD)
- 11.2. Market Analysis, Insights and Forecast - by Application
- 11.2.1. Food and Beverages
- 11.2.2. Healthcare Supplements
- 11.2.3. Other Applications
- 11.1. Market Analysis, Insights and Forecast - by Type
- 12. Competitive Analysis
- 12.1. Company Profiles
- 12.1.1 Ilesol Pharmaceuticals doo
- 12.1.1.1. Company Overview
- 12.1.1.2. Products
- 12.1.1.3. Company Financials
- 12.1.1.4. SWOT Analysis
- 12.1.2 Bulk Hemp Warehouse LLC
- 12.1.2.1. Company Overview
- 12.1.2.2. Products
- 12.1.2.3. Company Financials
- 12.1.2.4. SWOT Analysis
- 12.1.3 International Flavors & Fragrances Inc
- 12.1.3.1. Company Overview
- 12.1.3.2. Products
- 12.1.3.3. Company Financials
- 12.1.3.4. SWOT Analysis
- 12.1.4 GenCanna
- 12.1.4.1. Company Overview
- 12.1.4.2. Products
- 12.1.4.3. Company Financials
- 12.1.4.4. SWOT Analysis
- 12.1.5 Robertet
- 12.1.5.1. Company Overview
- 12.1.5.2. Products
- 12.1.5.3. Company Financials
- 12.1.5.4. SWOT Analysis
- 12.1.6 Firmenich SA
- 12.1.6.1. Company Overview
- 12.1.6.2. Products
- 12.1.6.3. Company Financials
- 12.1.6.4. SWOT Analysis
- 12.1.7 Charlotte's Web Holdings Inc
- 12.1.7.1. Company Overview
- 12.1.7.2. Products
- 12.1.7.3. Company Financials
- 12.1.7.4. SWOT Analysis
- 12.1.8 True Terpenes
- 12.1.8.1. Company Overview
- 12.1.8.2. Products
- 12.1.8.3. Company Financials
- 12.1.8.4. SWOT Analysis
- 12.1.9 Puricon
- 12.1.9.1. Company Overview
- 12.1.9.2. Products
- 12.1.9.3. Company Financials
- 12.1.9.4. SWOT Analysis
- 12.1.10 PharmaCielo Ltd
- 12.1.10.1. Company Overview
- 12.1.10.2. Products
- 12.1.10.3. Company Financials
- 12.1.10.4. SWOT Analysis
- 12.1.11 Silver Lion Farms
- 12.1.11.1. Company Overview
- 12.1.11.2. Products
- 12.1.11.3. Company Financials
- 12.1.11.4. SWOT Analysis
- 12.1.12 Bomar Agra Estates LLC
- 12.1.12.1. Company Overview
- 12.1.12.2. Products
- 12.1.12.3. Company Financials
- 12.1.12.4. SWOT Analysis
- 12.1.13 Colorado Breeders Depot
- 12.1.13.1. Company Overview
- 12.1.13.2. Products
- 12.1.13.3. Company Financials
- 12.1.13.4. SWOT Analysis
- 12.1.14 33 Supply LLC
- 12.1.14.1. Company Overview
- 12.1.14.2. Products
- 12.1.14.3. Company Financials
- 12.1.14.4. SWOT Analysis
- 12.1.15 Green Passion (Canway Schweiz GmbH)
- 12.1.15.1. Company Overview
- 12.1.15.2. Products
- 12.1.15.3. Company Financials
- 12.1.15.4. SWOT Analysis
- 12.1.16 Victory Hemp Foods
- 12.1.16.1. Company Overview
- 12.1.16.2. Products
- 12.1.16.3. Company Financials
- 12.1.16.4. SWOT Analysis
- 12.1.17 Hemp Oil Canada
- 12.1.17.1. Company Overview
- 12.1.17.2. Products
- 12.1.17.3. Company Financials
- 12.1.17.4. SWOT Analysis
- 12.1.18 Manitoba Harvest (Tilray)
- 12.1.18.1. Company Overview
- 12.1.18.2. Products
- 12.1.18.3. Company Financials
- 12.1.18.4. SWOT Analysis
- 12.1.19 HempFlax Group BV
- 12.1.19.1. Company Overview
- 12.1.19.2. Products
- 12.1.19.3. Company Financials
- 12.1.19.4. SWOT Analysis
- 12.1.20 Entoura
- 12.1.20.1. Company Overview
- 12.1.20.2. Products
- 12.1.20.3. Company Financials
- 12.1.20.4. SWOT Analysis
- 12.1.21 Bedrocan
- 12.1.21.1. Company Overview
- 12.1.21.2. Products
- 12.1.21.3. Company Financials
- 12.1.21.4. SWOT Analysis
- 12.1.22 Signature Products
- 12.1.22.1. Company Overview
- 12.1.22.2. Products
- 12.1.22.3. Company Financials
- 12.1.22.4. SWOT Analysis
- 12.1.23 Nutiva hemp Oil
- 12.1.23.1. Company Overview
- 12.1.23.2. Products
- 12.1.23.3. Company Financials
- 12.1.23.4. SWOT Analysis
- 12.1.24 Temp Co Canada
- 12.1.24.1. Company Overview
- 12.1.24.2. Products
- 12.1.24.3. Company Financials
- 12.1.24.4. SWOT Analysis
- 12.1.25 Hemp Acres USA*List Not Exhaustive
- 12.1.25.1. Company Overview
- 12.1.25.2. Products
- 12.1.25.3. Company Financials
- 12.1.25.4. SWOT Analysis
- 12.1.1 Ilesol Pharmaceuticals doo
- 12.2. Market Entropy
- 12.2.1 Company's Key Areas Served
- 12.2.2 Recent Developments
- 12.3. Company Market Share Analysis 2025
- 12.3.1 Top 5 Companies Market Share Analysis
- 12.3.2 Top 3 Companies Market Share Analysis
- 12.4. List of Potential Customers
- 13. Research Methodology
List of Figures
- Figure 1: Global Industrial Hemp Industry Revenue Breakdown (Million, %) by Region 2025 & 2033
- Figure 2: Global Industrial Hemp Industry Volume Breakdown (Billion, %) by Region 2025 & 2033
- Figure 3: Asia Pacific Industrial Hemp Industry Revenue (Million), by Type 2025 & 2033
- Figure 4: Asia Pacific Industrial Hemp Industry Volume (Billion), by Type 2025 & 2033
- Figure 5: Asia Pacific Industrial Hemp Industry Revenue Share (%), by Type 2025 & 2033
- Figure 6: Asia Pacific Industrial Hemp Industry Volume Share (%), by Type 2025 & 2033
- Figure 7: Asia Pacific Industrial Hemp Industry Revenue (Million), by Application 2025 & 2033
- Figure 8: Asia Pacific Industrial Hemp Industry Volume (Billion), by Application 2025 & 2033
- Figure 9: Asia Pacific Industrial Hemp Industry Revenue Share (%), by Application 2025 & 2033
- Figure 10: Asia Pacific Industrial Hemp Industry Volume Share (%), by Application 2025 & 2033
- Figure 11: Asia Pacific Industrial Hemp Industry Revenue (Million), by Country 2025 & 2033
- Figure 12: Asia Pacific Industrial Hemp Industry Volume (Billion), by Country 2025 & 2033
- Figure 13: Asia Pacific Industrial Hemp Industry Revenue Share (%), by Country 2025 & 2033
- Figure 14: Asia Pacific Industrial Hemp Industry Volume Share (%), by Country 2025 & 2033
- Figure 15: North America Industrial Hemp Industry Revenue (Million), by Type 2025 & 2033
- Figure 16: North America Industrial Hemp Industry Volume (Billion), by Type 2025 & 2033
- Figure 17: North America Industrial Hemp Industry Revenue Share (%), by Type 2025 & 2033
- Figure 18: North America Industrial Hemp Industry Volume Share (%), by Type 2025 & 2033
- Figure 19: North America Industrial Hemp Industry Revenue (Million), by Application 2025 & 2033
- Figure 20: North America Industrial Hemp Industry Volume (Billion), by Application 2025 & 2033
- Figure 21: North America Industrial Hemp Industry Revenue Share (%), by Application 2025 & 2033
- Figure 22: North America Industrial Hemp Industry Volume Share (%), by Application 2025 & 2033
- Figure 23: North America Industrial Hemp Industry Revenue (Million), by Country 2025 & 2033
- Figure 24: North America Industrial Hemp Industry Volume (Billion), by Country 2025 & 2033
- Figure 25: North America Industrial Hemp Industry Revenue Share (%), by Country 2025 & 2033
- Figure 26: North America Industrial Hemp Industry Volume Share (%), by Country 2025 & 2033
- Figure 27: Europe Industrial Hemp Industry Revenue (Million), by Type 2025 & 2033
- Figure 28: Europe Industrial Hemp Industry Volume (Billion), by Type 2025 & 2033
- Figure 29: Europe Industrial Hemp Industry Revenue Share (%), by Type 2025 & 2033
- Figure 30: Europe Industrial Hemp Industry Volume Share (%), by Type 2025 & 2033
- Figure 31: Europe Industrial Hemp Industry Revenue (Million), by Application 2025 & 2033
- Figure 32: Europe Industrial Hemp Industry Volume (Billion), by Application 2025 & 2033
- Figure 33: Europe Industrial Hemp Industry Revenue Share (%), by Application 2025 & 2033
- Figure 34: Europe Industrial Hemp Industry Volume Share (%), by Application 2025 & 2033
- Figure 35: Europe Industrial Hemp Industry Revenue (Million), by Country 2025 & 2033
- Figure 36: Europe Industrial Hemp Industry Volume (Billion), by Country 2025 & 2033
- Figure 37: Europe Industrial Hemp Industry Revenue Share (%), by Country 2025 & 2033
- Figure 38: Europe Industrial Hemp Industry Volume Share (%), by Country 2025 & 2033
- Figure 39: South America Industrial Hemp Industry Revenue (Million), by Type 2025 & 2033
- Figure 40: South America Industrial Hemp Industry Volume (Billion), by Type 2025 & 2033
- Figure 41: South America Industrial Hemp Industry Revenue Share (%), by Type 2025 & 2033
- Figure 42: South America Industrial Hemp Industry Volume Share (%), by Type 2025 & 2033
- Figure 43: South America Industrial Hemp Industry Revenue (Million), by Application 2025 & 2033
- Figure 44: South America Industrial Hemp Industry Volume (Billion), by Application 2025 & 2033
- Figure 45: South America Industrial Hemp Industry Revenue Share (%), by Application 2025 & 2033
- Figure 46: South America Industrial Hemp Industry Volume Share (%), by Application 2025 & 2033
- Figure 47: South America Industrial Hemp Industry Revenue (Million), by Country 2025 & 2033
- Figure 48: South America Industrial Hemp Industry Volume (Billion), by Country 2025 & 2033
- Figure 49: South America Industrial Hemp Industry Revenue Share (%), by Country 2025 & 2033
- Figure 50: South America Industrial Hemp Industry Volume Share (%), by Country 2025 & 2033
- Figure 51: Middle East and Africa Industrial Hemp Industry Revenue (Million), by Type 2025 & 2033
- Figure 52: Middle East and Africa Industrial Hemp Industry Volume (Billion), by Type 2025 & 2033
- Figure 53: Middle East and Africa Industrial Hemp Industry Revenue Share (%), by Type 2025 & 2033
- Figure 54: Middle East and Africa Industrial Hemp Industry Volume Share (%), by Type 2025 & 2033
- Figure 55: Middle East and Africa Industrial Hemp Industry Revenue (Million), by Application 2025 & 2033
- Figure 56: Middle East and Africa Industrial Hemp Industry Volume (Billion), by Application 2025 & 2033
- Figure 57: Middle East and Africa Industrial Hemp Industry Revenue Share (%), by Application 2025 & 2033
- Figure 58: Middle East and Africa Industrial Hemp Industry Volume Share (%), by Application 2025 & 2033
- Figure 59: Middle East and Africa Industrial Hemp Industry Revenue (Million), by Country 2025 & 2033
- Figure 60: Middle East and Africa Industrial Hemp Industry Volume (Billion), by Country 2025 & 2033
- Figure 61: Middle East and Africa Industrial Hemp Industry Revenue Share (%), by Country 2025 & 2033
- Figure 62: Middle East and Africa Industrial Hemp Industry Volume Share (%), by Country 2025 & 2033
List of Tables
- Table 1: Global Industrial Hemp Industry Revenue Million Forecast, by Type 2020 & 2033
- Table 2: Global Industrial Hemp Industry Volume Billion Forecast, by Type 2020 & 2033
- Table 3: Global Industrial Hemp Industry Revenue Million Forecast, by Application 2020 & 2033
- Table 4: Global Industrial Hemp Industry Volume Billion Forecast, by Application 2020 & 2033
- Table 5: Global Industrial Hemp Industry Revenue Million Forecast, by Region 2020 & 2033
- Table 6: Global Industrial Hemp Industry Volume Billion Forecast, by Region 2020 & 2033
- Table 7: Global Industrial Hemp Industry Revenue Million Forecast, by Type 2020 & 2033
- Table 8: Global Industrial Hemp Industry Volume Billion Forecast, by Type 2020 & 2033
- Table 9: Global Industrial Hemp Industry Revenue Million Forecast, by Application 2020 & 2033
- Table 10: Global Industrial Hemp Industry Volume Billion Forecast, by Application 2020 & 2033
- Table 11: Global Industrial Hemp Industry Revenue Million Forecast, by Country 2020 & 2033
- Table 12: Global Industrial Hemp Industry Volume Billion Forecast, by Country 2020 & 2033
- Table 13: China Industrial Hemp Industry Revenue (Million) Forecast, by Application 2020 & 2033
- Table 14: China Industrial Hemp Industry Volume (Billion) Forecast, by Application 2020 & 2033
- Table 15: India Industrial Hemp Industry Revenue (Million) Forecast, by Application 2020 & 2033
- Table 16: India Industrial Hemp Industry Volume (Billion) Forecast, by Application 2020 & 2033
- Table 17: Japan Industrial Hemp Industry Revenue (Million) Forecast, by Application 2020 & 2033
- Table 18: Japan Industrial Hemp Industry Volume (Billion) Forecast, by Application 2020 & 2033
- Table 19: South Korea Industrial Hemp Industry Revenue (Million) Forecast, by Application 2020 & 2033
- Table 20: South Korea Industrial Hemp Industry Volume (Billion) Forecast, by Application 2020 & 2033
- Table 21: Malaysia Industrial Hemp Industry Revenue (Million) Forecast, by Application 2020 & 2033
- Table 22: Malaysia Industrial Hemp Industry Volume (Billion) Forecast, by Application 2020 & 2033
- Table 23: Thailand Industrial Hemp Industry Revenue (Million) Forecast, by Application 2020 & 2033
- Table 24: Thailand Industrial Hemp Industry Volume (Billion) Forecast, by Application 2020 & 2033
- Table 25: Indonesia Industrial Hemp Industry Revenue (Million) Forecast, by Application 2020 & 2033
- Table 26: Indonesia Industrial Hemp Industry Volume (Billion) Forecast, by Application 2020 & 2033
- Table 27: Vietnam Industrial Hemp Industry Revenue (Million) Forecast, by Application 2020 & 2033
- Table 28: Vietnam Industrial Hemp Industry Volume (Billion) Forecast, by Application 2020 & 2033
- Table 29: Rest of Asia Pacific Industrial Hemp Industry Revenue (Million) Forecast, by Application 2020 & 2033
- Table 30: Rest of Asia Pacific Industrial Hemp Industry Volume (Billion) Forecast, by Application 2020 & 2033
- Table 31: Global Industrial Hemp Industry Revenue Million Forecast, by Type 2020 & 2033
- Table 32: Global Industrial Hemp Industry Volume Billion Forecast, by Type 2020 & 2033
- Table 33: Global Industrial Hemp Industry Revenue Million Forecast, by Application 2020 & 2033
- Table 34: Global Industrial Hemp Industry Volume Billion Forecast, by Application 2020 & 2033
- Table 35: Global Industrial Hemp Industry Revenue Million Forecast, by Country 2020 & 2033
- Table 36: Global Industrial Hemp Industry Volume Billion Forecast, by Country 2020 & 2033
- Table 37: United States Industrial Hemp Industry Revenue (Million) Forecast, by Application 2020 & 2033
- Table 38: United States Industrial Hemp Industry Volume (Billion) Forecast, by Application 2020 & 2033
- Table 39: Canada Industrial Hemp Industry Revenue (Million) Forecast, by Application 2020 & 2033
- Table 40: Canada Industrial Hemp Industry Volume (Billion) Forecast, by Application 2020 & 2033
- Table 41: Mexico Industrial Hemp Industry Revenue (Million) Forecast, by Application 2020 & 2033
- Table 42: Mexico Industrial Hemp Industry Volume (Billion) Forecast, by Application 2020 & 2033
- Table 43: Global Industrial Hemp Industry Revenue Million Forecast, by Type 2020 & 2033
- Table 44: Global Industrial Hemp Industry Volume Billion Forecast, by Type 2020 & 2033
- Table 45: Global Industrial Hemp Industry Revenue Million Forecast, by Application 2020 & 2033
- Table 46: Global Industrial Hemp Industry Volume Billion Forecast, by Application 2020 & 2033
- Table 47: Global Industrial Hemp Industry Revenue Million Forecast, by Country 2020 & 2033
- Table 48: Global Industrial Hemp Industry Volume Billion Forecast, by Country 2020 & 2033
- Table 49: Germany Industrial Hemp Industry Revenue (Million) Forecast, by Application 2020 & 2033
- Table 50: Germany Industrial Hemp Industry Volume (Billion) Forecast, by Application 2020 & 2033
- Table 51: United Kingdom Industrial Hemp Industry Revenue (Million) Forecast, by Application 2020 & 2033
- Table 52: United Kingdom Industrial Hemp Industry Volume (Billion) Forecast, by Application 2020 & 2033
- Table 53: France Industrial Hemp Industry Revenue (Million) Forecast, by Application 2020 & 2033
- Table 54: France Industrial Hemp Industry Volume (Billion) Forecast, by Application 2020 & 2033
- Table 55: Italy Industrial Hemp Industry Revenue (Million) Forecast, by Application 2020 & 2033
- Table 56: Italy Industrial Hemp Industry Volume (Billion) Forecast, by Application 2020 & 2033
- Table 57: Spain Industrial Hemp Industry Revenue (Million) Forecast, by Application 2020 & 2033
- Table 58: Spain Industrial Hemp Industry Volume (Billion) Forecast, by Application 2020 & 2033
- Table 59: Turkey Industrial Hemp Industry Revenue (Million) Forecast, by Application 2020 & 2033
- Table 60: Turkey Industrial Hemp Industry Volume (Billion) Forecast, by Application 2020 & 2033
- Table 61: Russia Industrial Hemp Industry Revenue (Million) Forecast, by Application 2020 & 2033
- Table 62: Russia Industrial Hemp Industry Volume (Billion) Forecast, by Application 2020 & 2033
- Table 63: NORDIC Countries Industrial Hemp Industry Revenue (Million) Forecast, by Application 2020 & 2033
- Table 64: NORDIC Countries Industrial Hemp Industry Volume (Billion) Forecast, by Application 2020 & 2033
- Table 65: Rest of Europe Industrial Hemp Industry Revenue (Million) Forecast, by Application 2020 & 2033
- Table 66: Rest of Europe Industrial Hemp Industry Volume (Billion) Forecast, by Application 2020 & 2033
- Table 67: Global Industrial Hemp Industry Revenue Million Forecast, by Type 2020 & 2033
- Table 68: Global Industrial Hemp Industry Volume Billion Forecast, by Type 2020 & 2033
- Table 69: Global Industrial Hemp Industry Revenue Million Forecast, by Application 2020 & 2033
- Table 70: Global Industrial Hemp Industry Volume Billion Forecast, by Application 2020 & 2033
- Table 71: Global Industrial Hemp Industry Revenue Million Forecast, by Country 2020 & 2033
- Table 72: Global Industrial Hemp Industry Volume Billion Forecast, by Country 2020 & 2033
- Table 73: Brazil Industrial Hemp Industry Revenue (Million) Forecast, by Application 2020 & 2033
- Table 74: Brazil Industrial Hemp Industry Volume (Billion) Forecast, by Application 2020 & 2033
- Table 75: Argentina Industrial Hemp Industry Revenue (Million) Forecast, by Application 2020 & 2033
- Table 76: Argentina Industrial Hemp Industry Volume (Billion) Forecast, by Application 2020 & 2033
- Table 77: Colombia Industrial Hemp Industry Revenue (Million) Forecast, by Application 2020 & 2033
- Table 78: Colombia Industrial Hemp Industry Volume (Billion) Forecast, by Application 2020 & 2033
- Table 79: Rest of South America Industrial Hemp Industry Revenue (Million) Forecast, by Application 2020 & 2033
- Table 80: Rest of South America Industrial Hemp Industry Volume (Billion) Forecast, by Application 2020 & 2033
- Table 81: Global Industrial Hemp Industry Revenue Million Forecast, by Type 2020 & 2033
- Table 82: Global Industrial Hemp Industry Volume Billion Forecast, by Type 2020 & 2033
- Table 83: Global Industrial Hemp Industry Revenue Million Forecast, by Application 2020 & 2033
- Table 84: Global Industrial Hemp Industry Volume Billion Forecast, by Application 2020 & 2033
- Table 85: Global Industrial Hemp Industry Revenue Million Forecast, by Country 2020 & 2033
- Table 86: Global Industrial Hemp Industry Volume Billion Forecast, by Country 2020 & 2033
- Table 87: Saudi Arabia Industrial Hemp Industry Revenue (Million) Forecast, by Application 2020 & 2033
- Table 88: Saudi Arabia Industrial Hemp Industry Volume (Billion) Forecast, by Application 2020 & 2033
- Table 89: Nigeria Industrial Hemp Industry Revenue (Million) Forecast, by Application 2020 & 2033
- Table 90: Nigeria Industrial Hemp Industry Volume (Billion) Forecast, by Application 2020 & 2033
- Table 91: Qatar Industrial Hemp Industry Revenue (Million) Forecast, by Application 2020 & 2033
- Table 92: Qatar Industrial Hemp Industry Volume (Billion) Forecast, by Application 2020 & 2033
- Table 93: Egypt Industrial Hemp Industry Revenue (Million) Forecast, by Application 2020 & 2033
- Table 94: Egypt Industrial Hemp Industry Volume (Billion) Forecast, by Application 2020 & 2033
- Table 95: United Arab Emirates Industrial Hemp Industry Revenue (Million) Forecast, by Application 2020 & 2033
- Table 96: United Arab Emirates Industrial Hemp Industry Volume (Billion) Forecast, by Application 2020 & 2033
- Table 97: South Africa Industrial Hemp Industry Revenue (Million) Forecast, by Application 2020 & 2033
- Table 98: South Africa Industrial Hemp Industry Volume (Billion) Forecast, by Application 2020 & 2033
- Table 99: Rest of Middle East and Africa Industrial Hemp Industry Revenue (Million) Forecast, by Application 2020 & 2033
- Table 100: Rest of Middle East and Africa Industrial Hemp Industry Volume (Billion) Forecast, by Application 2020 & 2033
Frequently Asked Questions
1. What is the projected Compound Annual Growth Rate (CAGR) of the Industrial Hemp Industry?
The projected CAGR is approximately > 17.00%.
2. Which companies are prominent players in the Industrial Hemp Industry?
Key companies in the market include Ilesol Pharmaceuticals doo, Bulk Hemp Warehouse LLC, International Flavors & Fragrances Inc, GenCanna, Robertet, Firmenich SA, Charlotte's Web Holdings Inc, True Terpenes, Puricon, PharmaCielo Ltd, Silver Lion Farms, Bomar Agra Estates LLC, Colorado Breeders Depot, 33 Supply LLC, Green Passion (Canway Schweiz GmbH), Victory Hemp Foods, Hemp Oil Canada, Manitoba Harvest (Tilray), HempFlax Group BV, Entoura, Bedrocan, Signature Products, Nutiva hemp Oil, Temp Co Canada, Hemp Acres USA*List Not Exhaustive.
3. What are the main segments of the Industrial Hemp Industry?
The market segments include Type, Application.
4. Can you provide details about the market size?
The market size is estimated to be USD 2.60 Million as of 2022.
5. What are some drivers contributing to market growth?
Huge Demand for Industrial Hemp Products Across Diverse Applications; High Functional Application in Health Care Sector.
6. What are the notable trends driving market growth?
Increasing Demand from the Food and Beverage Segment.
7. Are there any restraints impacting market growth?
Huge Demand for Industrial Hemp Products Across Diverse Applications; High Functional Application in Health Care Sector.
8. Can you provide examples of recent developments in the market?
January 2022: MariMed Inc. signed a definitive agreement to acquire Green Growth Group Inc., holder of a provisional Cannabis Craft License in Illinois.January 2022: MariMed Inc. entered a definitive agreement to acquire Kind Therapeutics USA LLC, a leading vertically integrated cannabis business in Maryland.
9. What pricing options are available for accessing the report?
Pricing options include single-user, multi-user, and enterprise licenses priced at USD 4750, USD 5250, and USD 8750 respectively.
10. Is the market size provided in terms of value or volume?
The market size is provided in terms of value, measured in Million and volume, measured in Billion.
11. Are there any specific market keywords associated with the report?
Yes, the market keyword associated with the report is "Industrial Hemp Industry," which aids in identifying and referencing the specific market segment covered.
12. How do I determine which pricing option suits my needs best?
The pricing options vary based on user requirements and access needs. Individual users may opt for single-user licenses, while businesses requiring broader access may choose multi-user or enterprise licenses for cost-effective access to the report.
13. Are there any additional resources or data provided in the Industrial Hemp Industry report?
While the report offers comprehensive insights, it's advisable to review the specific contents or supplementary materials provided to ascertain if additional resources or data are available.
14. How can I stay updated on further developments or reports in the Industrial Hemp Industry?
To stay informed about further developments, trends, and reports in the Industrial Hemp Industry, consider subscribing to industry newsletters, following relevant companies and organizations, or regularly checking reputable industry news sources and publications.
Methodology
Step 1 - Identification of Relevant Samples Size from Population Database


Step 2 - Approaches for Defining Global Market Size (Value, Volume* & Price*)

Note*: In applicable scenarios
Step 3 - Data Sources
Primary Research
- Web Analytics
- Survey Reports
- Research Institute
- Latest Research Reports
- Opinion Leaders
Secondary Research
- Annual Reports
- White Paper
- Latest Press Release
- Industry Association
- Paid Database
- Investor Presentations

Step 4 - Data Triangulation
Involves using different sources of information in order to increase the validity of a study
These sources are likely to be stakeholders in a program - participants, other researchers, program staff, other community members, and so on.
Then we put all data in single framework & apply various statistical tools to find out the dynamic on the market.
During the analysis stage, feedback from the stakeholder groups would be compared to determine areas of agreement as well as areas of divergence