Key Insights
The global industrial hard hats market is poised for significant expansion, projected to reach approximately $1.5 billion by 2025 and grow at a compound annual growth rate (CAGR) of around 6.5% through 2033. This robust growth is primarily fueled by an increasing emphasis on workplace safety regulations across various industries, including construction, mining, and oil & gas. As economies rebound and infrastructure development projects gain momentum globally, the demand for essential personal protective equipment (PPE) like hard hats is set to surge. The adoption of advanced materials such as high-density polyethylene (HDPE) and fiberglass reinforced plastic (FRP) is also a key driver, offering enhanced durability, comfort, and protection. These material innovations cater to specific industry needs, contributing to market diversification and growth.
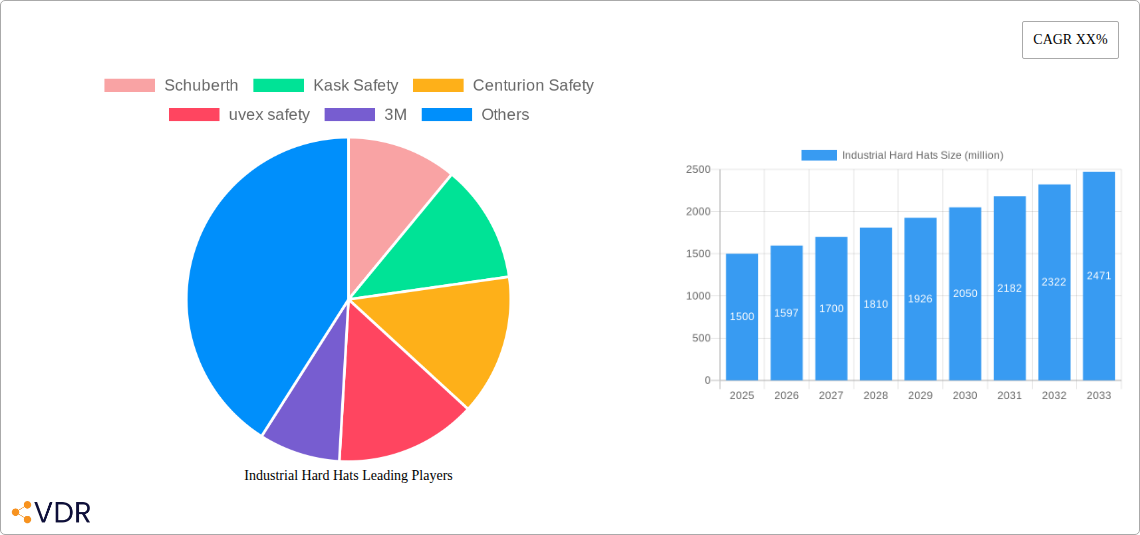
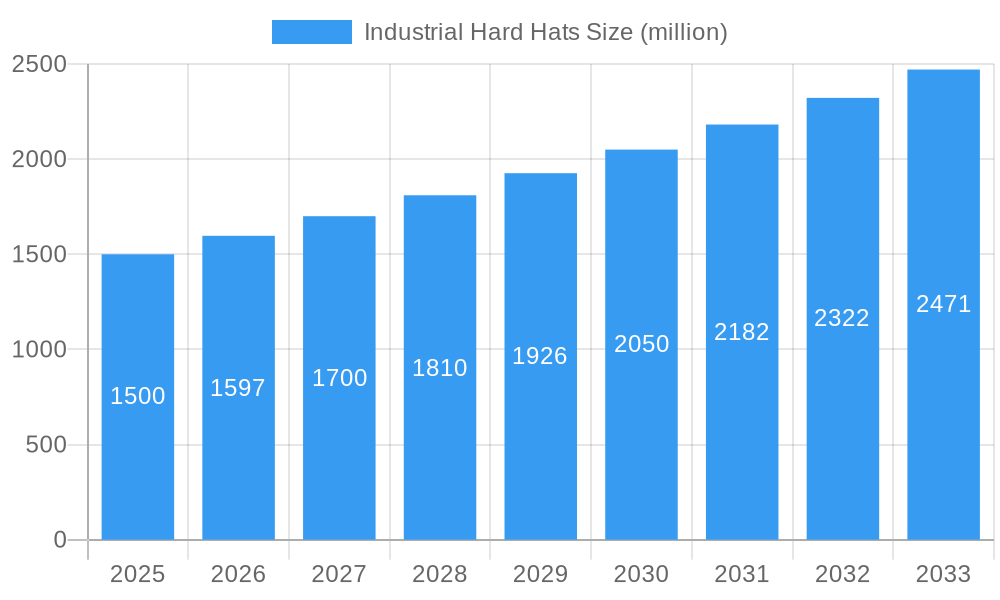
Industrial Hard Hats Market Size (In Billion)
The market is characterized by a dynamic competitive landscape with prominent players like 3M, Kask Safety, and Centurion Safety investing in product innovation and expanding their global reach. The development of lightweight, ergonomic, and feature-rich hard hats, including those with integrated communication systems or improved ventilation, is shaping consumer preferences. However, the market faces some restraints, including the high cost of premium safety certifications and the availability of counterfeit products that undermine the value of genuine safety equipment. Geographically, the Asia Pacific region, particularly China and India, is expected to emerge as a key growth engine due to rapid industrialization and significant investments in infrastructure. North America and Europe will continue to be substantial markets, driven by stringent safety standards and a well-established industrial base. The ongoing focus on worker well-being and the increasing awareness of the financial and human costs of workplace accidents will undoubtedly propel the industrial hard hats market forward in the coming years.
Industrial Hard Hats Company Market Share
Industrial Hard Hats Market Dynamics & Structure
The industrial hard hat market exhibits a moderately concentrated structure, with key players like 3M, Schuberth, Kask Safety, uvex safety, and Centurion Safety holding significant market shares. Technological innovation is a primary driver, with advancements focusing on lightweight materials, enhanced impact resistance, integrated communication systems, and smart features like IoT connectivity for worker safety monitoring. Regulatory frameworks mandating stringent safety standards, such as OSHA in the US and EN standards in Europe, are crucial for market entry and product development. Competitive product substitutes are minimal within the core protective headwear segment, though advancements in alternative personal protective equipment (PPE) for specific niche applications can be observed. End-user demographics are broad, encompassing a skilled workforce in sectors demanding high safety protocols. Mergers and acquisitions (M&A) are observed, aimed at expanding product portfolios, gaining access to new geographies, and consolidating market positions. For instance, acquisitions of smaller specialized PPE providers by larger corporations are a recurring trend to bolster their offerings. Innovation barriers include high R&D costs for advanced materials and the lengthy certification processes for new safety products.
- Market Concentration: Moderately concentrated with leading players holding substantial market share.
- Technological Innovation: Focus on lightweight materials, impact resistance, integrated tech, and smart features.
- Regulatory Frameworks: Strict mandates like OSHA and EN standards drive compliance and product evolution.
- Competitive Landscape: Limited direct substitutes for core protective headwear, but niche PPE advancements exist.
- End-User Demographics: Broad appeal across industries with rigorous safety requirements.
- M&A Trends: Consolidation and portfolio expansion through strategic acquisitions are common.
- Innovation Barriers: High R&D investment and rigorous certification processes.
Industrial Hard Hats Growth Trends & Insights
The global industrial hard hats market is projected to witness robust growth, driven by an escalating focus on workplace safety regulations and a surge in infrastructure development projects worldwide. The market size is expected to grow from approximately $1.5 billion in 2019 to an estimated $2.3 billion by 2033, exhibiting a Compound Annual Growth Rate (CAGR) of around 3.8%. Adoption rates for advanced hard hats are on the rise, particularly in sectors like construction and oil & gas, where the inherent risks necessitate the highest levels of personal protective equipment (PPE). Technological disruptions are playing a pivotal role, with manufacturers increasingly incorporating features like integrated headlamps, Bluetooth connectivity for communication, and advanced impact absorption systems. These innovations not only enhance worker safety but also improve productivity and comfort, leading to greater acceptance among end-users. Consumer behavior shifts are evident, with a growing preference for ergonomic designs, lightweight materials, and aesthetically pleasing, yet highly functional, head protection solutions. The demand for specialized hard hats tailored to specific environmental conditions, such as extreme temperatures or hazardous chemical exposure, is also increasing, reflecting a more nuanced understanding of workplace risks. Furthermore, the rising awareness among both employers and employees about the long-term consequences of head injuries is a significant factor driving the adoption of premium and technologically advanced hard hats. The digitalization of safety management systems is also influencing the market, with demand for smart hard hats capable of tracking worker location and monitoring environmental hazards on the rise. This trend is particularly pronounced in large-scale industrial operations where comprehensive safety oversight is paramount. The increasing disposable income in developing economies is also contributing to the growth, as more businesses can afford to invest in higher-quality safety equipment. The growing trend of remote work in some office-based roles has had a negligible impact on the industrial hard hats market, as its core customer base remains firmly rooted in on-site operational environments. The forecast period is expected to see sustained demand, fueled by ongoing infrastructure investments and a commitment to improving safety standards across various industrial sectors globally.
Dominant Regions, Countries, or Segments in Industrial Hard Hats
The Construction segment consistently emerges as the dominant force within the industrial hard hats market, driven by its sheer scale, continuous infrastructure development, and stringent safety mandates. This segment is projected to account for a substantial share, estimated at over 40% of the global market by 2025, with continued strong growth anticipated throughout the forecast period. The economic policies in regions like North America and Asia-Pacific, particularly China, India, and Southeast Asian nations, are heavily geared towards infrastructure expansion, including residential, commercial, and transportation projects. These initiatives directly translate into a massive demand for construction-grade industrial hard hats.
Key drivers for the dominance of the construction segment include:
- Massive Infrastructure Investment: Governments and private entities are investing billions in new roads, bridges, buildings, and public utilities, creating a perpetual demand for construction workers and, consequently, protective headgear.
- Stringent Safety Regulations: Occupational safety and health administrations worldwide (e.g., OSHA in the US, HSE in the UK) have strict regulations in place requiring the use of hard hats on all construction sites, significantly boosting demand.
- High Risk Environment: Construction sites are inherently dangerous environments with risks of falling objects, falling from heights, and electrical hazards, making hard hats an indispensable piece of PPE.
- Growth Potential: Emerging economies are experiencing rapid urbanization and industrialization, leading to a surge in construction activities and a corresponding increase in the demand for industrial hard hats. For instance, the "Belt and Road Initiative" by China has stimulated vast construction projects across multiple continents, further bolstering this segment.
In terms of Types, High Density Polyethylene (HDPE) and Acrylonitrile Butadiene Styrene (ABS) based industrial hard hats are expected to lead the market. HDPE offers an excellent balance of durability, chemical resistance, and cost-effectiveness, making it a staple in the construction industry. ABS, known for its impact resistance and toughness, is also a preferred material, particularly in mining and oil & gas applications. The market share for these two material types is estimated to collectively represent over 60% of the total market in the base year 2025, with steady growth projected.
- HDPE Dominance: Cost-effectiveness, durability, and chemical resistance make it a preferred choice for general construction.
- ABS Strength: Superior impact resistance and toughness suit demanding environments like mining and oil & gas.
- Material Market Share: HDPE and ABS together expected to hold over 60% of the market by 2025.
Industrial Hard Hats Product Landscape
The industrial hard hat market is characterized by continuous product innovation focused on enhancing worker safety, comfort, and functionality. Manufacturers are integrating advanced materials like composites and lightweight polymers to reduce user fatigue. Key developments include the introduction of hard hats with enhanced impact absorption capabilities, improved ventilation systems for hot environments, and integrated features such as LED lighting, communication systems, and even GPS tracking for enhanced site management and safety monitoring. Unique selling propositions often lie in ergonomic designs that offer a more secure and comfortable fit, superior protection against specific hazards (e.g., electrical insulation, chemical resistance), and compliance with a wider range of international safety standards.
Key Drivers, Barriers & Challenges in Industrial Hard Hats
Key Drivers: The industrial hard hats market is propelled by stringent global safety regulations, a significant surge in infrastructure development projects across emerging and developed economies, and increasing employer/employee awareness regarding workplace safety. Technological advancements in materials science and integrated safety features further stimulate demand, offering enhanced protection and functionality.
- Regulatory Mandates: Government bodies enforcing workplace safety standards.
- Infrastructure Growth: Ongoing construction and industrial expansion.
- Safety Awareness: Increased understanding of head injury risks.
- Technological Innovation: Lighter, more protective, and feature-rich designs.
Barriers & Challenges: High research and development costs for advanced materials and smart features can be a barrier. Supply chain disruptions, fluctuating raw material prices, and the rigorous and time-consuming certification processes for new safety products pose significant challenges. Intense competition from both established brands and emerging low-cost manufacturers can also exert downward pressure on pricing.
- R&D Investment: Significant capital required for advanced product development.
- Supply Chain Volatility: Fluctuations in raw material availability and pricing.
- Certification Hurdles: Lengthy and complex approval processes.
- Competitive Pressure: Price sensitivity and market saturation from various manufacturers.
Emerging Opportunities in Industrial Hard Hats
Emerging opportunities in the industrial hard hats sector lie in the development and adoption of "smart" hard hats. These intelligent headwear solutions integrate IoT capabilities, allowing for real-time worker location tracking, fall detection, and environmental hazard monitoring. This not only enhances immediate safety but also provides valuable data for risk assessment and safety protocol optimization. Furthermore, a growing demand for customized and niche-specific hard hats, designed for extreme conditions (e.g., high-temperature environments, specialized chemical resistance) and tailored for specific industries, presents untapped market potential.
Growth Accelerators in the Industrial Hard Hats Industry
Long-term growth in the industrial hard hats industry is being significantly accelerated by the ongoing trend of digitalization of workplace safety. The integration of smart technologies into hard hats, enabling features like fall detection, location tracking, and connectivity with other safety devices, is a major catalyst. Strategic partnerships between PPE manufacturers and technology companies are fostering rapid innovation in this area. Moreover, continued global investments in infrastructure development, particularly in emerging economies, are creating sustained demand for essential safety equipment, acting as a consistent growth accelerator.
Key Players Shaping the Industrial Hard Hats Market
- Schuberth
- Kask Safety
- Centurion Safety
- uvex safety
- 3M
- Active Safety NZ
- NZ Safety Blackwoods
- VIKING
- North Safety
- Neofeu
- Karam
Notable Milestones in Industrial Hard Hats Sector
- 2019: Introduction of advanced composite materials leading to lighter and stronger hard hat designs.
- 2020: Increased adoption of smart hard hats with basic connectivity features in the oil & gas sector.
- 2021: Development of enhanced ventilation systems for improved comfort in hot climates.
- 2022: Growing trend of hard hats with integrated LED lighting for improved visibility in low-light conditions.
- 2023: Enhanced focus on modular designs allowing for easier attachment of accessories like face shields and hearing protection.
- 2024: Increased research into bio-based and recycled materials for more sustainable hard hat production.
In-Depth Industrial Hard Hats Market Outlook
The future of the industrial hard hats market is bright, with smart hard hats and sustainable materials poised to be significant growth accelerators. The increasing integration of IoT and AI technologies into PPE will revolutionize workplace safety management, offering predictive analytics and proactive hazard mitigation. This, coupled with a global emphasis on environmental responsibility, will drive the demand for eco-friendly materials and production processes. Continued infrastructure development worldwide, especially in burgeoning economies, will ensure a steady baseline demand, making the market a robust and evolving landscape for safety innovation and investment.
Industrial Hard Hats Segmentation
-
1. Application
- 1.1. Construction
- 1.2. Mining
- 1.3. Oil & Gas
- 1.4. Chemical Industry
- 1.5. Others
-
2. Types
- 2.1. High Density Polyethylene
- 2.2. Acrylonitrile Butadiene Styrene
- 2.3. Polyethylene
- 2.4. Polycarbonate
- 2.5. Fiberglass Reinforced Plastic
Industrial Hard Hats Segmentation By Geography
-
1. North America
- 1.1. United States
- 1.2. Canada
- 1.3. Mexico
-
2. South America
- 2.1. Brazil
- 2.2. Argentina
- 2.3. Rest of South America
-
3. Europe
- 3.1. United Kingdom
- 3.2. Germany
- 3.3. France
- 3.4. Italy
- 3.5. Spain
- 3.6. Russia
- 3.7. Benelux
- 3.8. Nordics
- 3.9. Rest of Europe
-
4. Middle East & Africa
- 4.1. Turkey
- 4.2. Israel
- 4.3. GCC
- 4.4. North Africa
- 4.5. South Africa
- 4.6. Rest of Middle East & Africa
-
5. Asia Pacific
- 5.1. China
- 5.2. India
- 5.3. Japan
- 5.4. South Korea
- 5.5. ASEAN
- 5.6. Oceania
- 5.7. Rest of Asia Pacific
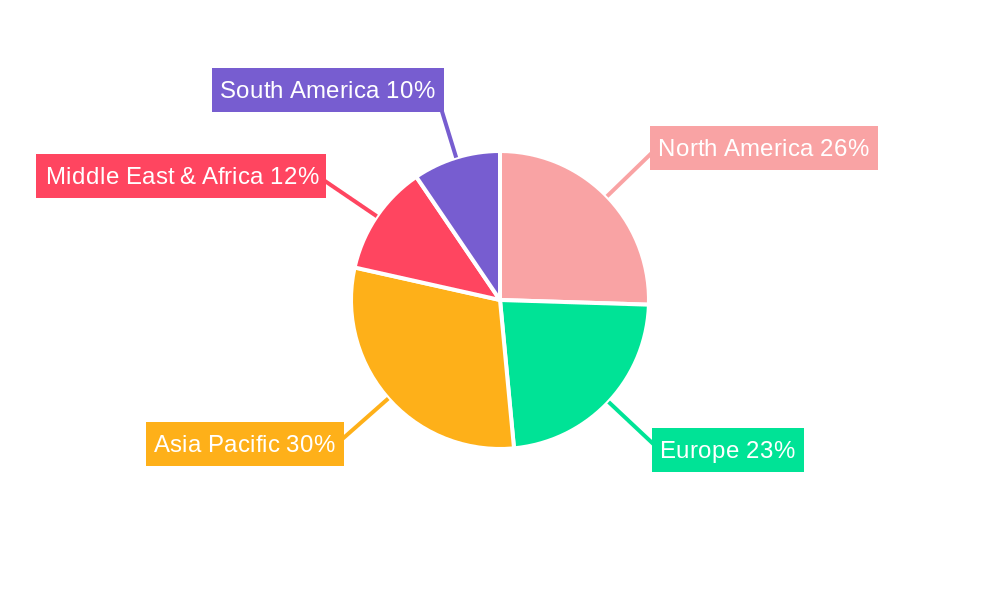
Industrial Hard Hats Regional Market Share
Geographic Coverage of Industrial Hard Hats
Industrial Hard Hats REPORT HIGHLIGHTS
| Aspects | Details |
|---|---|
| Study Period | 2020-2034 |
| Base Year | 2025 |
| Estimated Year | 2026 |
| Forecast Period | 2026-2034 |
| Historical Period | 2020-2025 |
| Growth Rate | CAGR of 7.9% from 2020-2034 |
| Segmentation |
|
Table of Contents
- 1. Introduction
- 1.1. Research Scope
- 1.2. Market Segmentation
- 1.3. Research Objective
- 1.4. Definitions and Assumptions
- 2. Executive Summary
- 2.1. Market Snapshot
- 3. Market Dynamics
- 3.1. Market Drivers
- 3.2. Market Restrains
- 3.3. Market Trends
- 3.4. Market Opportunities
- 4. Market Factor Analysis
- 4.1. Porters Five Forces
- 4.1.1. Bargaining Power of Suppliers
- 4.1.2. Bargaining Power of Buyers
- 4.1.3. Threat of New Entrants
- 4.1.4. Threat of Substitutes
- 4.1.5. Competitive Rivalry
- 4.2. PESTEL analysis
- 4.3. BCG Analysis
- 4.3.1. Stars (High Growth, High Market Share)
- 4.3.2. Cash Cows (Low Growth, High Market Share)
- 4.3.3. Question Mark (High Growth, Low Market Share)
- 4.3.4. Dogs (Low Growth, Low Market Share)
- 4.4. Ansoff Matrix Analysis
- 4.5. Supply Chain Analysis
- 4.6. Regulatory Landscape
- 4.7. Current Market Potential and Opportunity Assessment (TAM–SAM–SOM Framework)
- 4.8. VDR Analyst Note
- 4.1. Porters Five Forces
- 5. Market Analysis, Insights and Forecast 2021-2033
- 5.1. Market Analysis, Insights and Forecast - by Application
- 5.1.1. Construction
- 5.1.2. Mining
- 5.1.3. Oil & Gas
- 5.1.4. Chemical Industry
- 5.1.5. Others
- 5.2. Market Analysis, Insights and Forecast - by Types
- 5.2.1. High Density Polyethylene
- 5.2.2. Acrylonitrile Butadiene Styrene
- 5.2.3. Polyethylene
- 5.2.4. Polycarbonate
- 5.2.5. Fiberglass Reinforced Plastic
- 5.3. Market Analysis, Insights and Forecast - by Region
- 5.3.1. North America
- 5.3.2. South America
- 5.3.3. Europe
- 5.3.4. Middle East & Africa
- 5.3.5. Asia Pacific
- 5.1. Market Analysis, Insights and Forecast - by Application
- 6. Global Industrial Hard Hats Analysis, Insights and Forecast, 2021-2033
- 6.1. Market Analysis, Insights and Forecast - by Application
- 6.1.1. Construction
- 6.1.2. Mining
- 6.1.3. Oil & Gas
- 6.1.4. Chemical Industry
- 6.1.5. Others
- 6.2. Market Analysis, Insights and Forecast - by Types
- 6.2.1. High Density Polyethylene
- 6.2.2. Acrylonitrile Butadiene Styrene
- 6.2.3. Polyethylene
- 6.2.4. Polycarbonate
- 6.2.5. Fiberglass Reinforced Plastic
- 6.1. Market Analysis, Insights and Forecast - by Application
- 7. North America Industrial Hard Hats Analysis, Insights and Forecast, 2021-2033
- 7.1. Market Analysis, Insights and Forecast - by Application
- 7.1.1. Construction
- 7.1.2. Mining
- 7.1.3. Oil & Gas
- 7.1.4. Chemical Industry
- 7.1.5. Others
- 7.2. Market Analysis, Insights and Forecast - by Types
- 7.2.1. High Density Polyethylene
- 7.2.2. Acrylonitrile Butadiene Styrene
- 7.2.3. Polyethylene
- 7.2.4. Polycarbonate
- 7.2.5. Fiberglass Reinforced Plastic
- 7.1. Market Analysis, Insights and Forecast - by Application
- 8. South America Industrial Hard Hats Analysis, Insights and Forecast, 2021-2033
- 8.1. Market Analysis, Insights and Forecast - by Application
- 8.1.1. Construction
- 8.1.2. Mining
- 8.1.3. Oil & Gas
- 8.1.4. Chemical Industry
- 8.1.5. Others
- 8.2. Market Analysis, Insights and Forecast - by Types
- 8.2.1. High Density Polyethylene
- 8.2.2. Acrylonitrile Butadiene Styrene
- 8.2.3. Polyethylene
- 8.2.4. Polycarbonate
- 8.2.5. Fiberglass Reinforced Plastic
- 8.1. Market Analysis, Insights and Forecast - by Application
- 9. Europe Industrial Hard Hats Analysis, Insights and Forecast, 2021-2033
- 9.1. Market Analysis, Insights and Forecast - by Application
- 9.1.1. Construction
- 9.1.2. Mining
- 9.1.3. Oil & Gas
- 9.1.4. Chemical Industry
- 9.1.5. Others
- 9.2. Market Analysis, Insights and Forecast - by Types
- 9.2.1. High Density Polyethylene
- 9.2.2. Acrylonitrile Butadiene Styrene
- 9.2.3. Polyethylene
- 9.2.4. Polycarbonate
- 9.2.5. Fiberglass Reinforced Plastic
- 9.1. Market Analysis, Insights and Forecast - by Application
- 10. Middle East & Africa Industrial Hard Hats Analysis, Insights and Forecast, 2021-2033
- 10.1. Market Analysis, Insights and Forecast - by Application
- 10.1.1. Construction
- 10.1.2. Mining
- 10.1.3. Oil & Gas
- 10.1.4. Chemical Industry
- 10.1.5. Others
- 10.2. Market Analysis, Insights and Forecast - by Types
- 10.2.1. High Density Polyethylene
- 10.2.2. Acrylonitrile Butadiene Styrene
- 10.2.3. Polyethylene
- 10.2.4. Polycarbonate
- 10.2.5. Fiberglass Reinforced Plastic
- 10.1. Market Analysis, Insights and Forecast - by Application
- 11. Asia Pacific Industrial Hard Hats Analysis, Insights and Forecast, 2021-2033
- 11.1. Market Analysis, Insights and Forecast - by Application
- 11.1.1. Construction
- 11.1.2. Mining
- 11.1.3. Oil & Gas
- 11.1.4. Chemical Industry
- 11.1.5. Others
- 11.2. Market Analysis, Insights and Forecast - by Types
- 11.2.1. High Density Polyethylene
- 11.2.2. Acrylonitrile Butadiene Styrene
- 11.2.3. Polyethylene
- 11.2.4. Polycarbonate
- 11.2.5. Fiberglass Reinforced Plastic
- 11.1. Market Analysis, Insights and Forecast - by Application
- 12. Competitive Analysis
- 12.1. Company Profiles
- 12.1.1 Schuberth
- 12.1.1.1. Company Overview
- 12.1.1.2. Products
- 12.1.1.3. Company Financials
- 12.1.1.4. SWOT Analysis
- 12.1.2 Kask Safety
- 12.1.2.1. Company Overview
- 12.1.2.2. Products
- 12.1.2.3. Company Financials
- 12.1.2.4. SWOT Analysis
- 12.1.3 Centurion Safety
- 12.1.3.1. Company Overview
- 12.1.3.2. Products
- 12.1.3.3. Company Financials
- 12.1.3.4. SWOT Analysis
- 12.1.4 uvex safety
- 12.1.4.1. Company Overview
- 12.1.4.2. Products
- 12.1.4.3. Company Financials
- 12.1.4.4. SWOT Analysis
- 12.1.5 3M
- 12.1.5.1. Company Overview
- 12.1.5.2. Products
- 12.1.5.3. Company Financials
- 12.1.5.4. SWOT Analysis
- 12.1.6 Active Safety NZ
- 12.1.6.1. Company Overview
- 12.1.6.2. Products
- 12.1.6.3. Company Financials
- 12.1.6.4. SWOT Analysis
- 12.1.7 NZ Safety Blackwoods
- 12.1.7.1. Company Overview
- 12.1.7.2. Products
- 12.1.7.3. Company Financials
- 12.1.7.4. SWOT Analysis
- 12.1.8 VIKING
- 12.1.8.1. Company Overview
- 12.1.8.2. Products
- 12.1.8.3. Company Financials
- 12.1.8.4. SWOT Analysis
- 12.1.9 North Safety
- 12.1.9.1. Company Overview
- 12.1.9.2. Products
- 12.1.9.3. Company Financials
- 12.1.9.4. SWOT Analysis
- 12.1.10 Neofeu
- 12.1.10.1. Company Overview
- 12.1.10.2. Products
- 12.1.10.3. Company Financials
- 12.1.10.4. SWOT Analysis
- 12.1.11 Karam
- 12.1.11.1. Company Overview
- 12.1.11.2. Products
- 12.1.11.3. Company Financials
- 12.1.11.4. SWOT Analysis
- 12.1.1 Schuberth
- 12.2. Market Entropy
- 12.2.1 Company's Key Areas Served
- 12.2.2 Recent Developments
- 12.3. Company Market Share Analysis 2025
- 12.3.1 Top 5 Companies Market Share Analysis
- 12.3.2 Top 3 Companies Market Share Analysis
- 12.4. List of Potential Customers
- 13. Research Methodology
List of Figures
- Figure 1: Global Industrial Hard Hats Revenue Breakdown (undefined, %) by Region 2025 & 2033
- Figure 2: North America Industrial Hard Hats Revenue (undefined), by Application 2025 & 2033
- Figure 3: North America Industrial Hard Hats Revenue Share (%), by Application 2025 & 2033
- Figure 4: North America Industrial Hard Hats Revenue (undefined), by Types 2025 & 2033
- Figure 5: North America Industrial Hard Hats Revenue Share (%), by Types 2025 & 2033
- Figure 6: North America Industrial Hard Hats Revenue (undefined), by Country 2025 & 2033
- Figure 7: North America Industrial Hard Hats Revenue Share (%), by Country 2025 & 2033
- Figure 8: South America Industrial Hard Hats Revenue (undefined), by Application 2025 & 2033
- Figure 9: South America Industrial Hard Hats Revenue Share (%), by Application 2025 & 2033
- Figure 10: South America Industrial Hard Hats Revenue (undefined), by Types 2025 & 2033
- Figure 11: South America Industrial Hard Hats Revenue Share (%), by Types 2025 & 2033
- Figure 12: South America Industrial Hard Hats Revenue (undefined), by Country 2025 & 2033
- Figure 13: South America Industrial Hard Hats Revenue Share (%), by Country 2025 & 2033
- Figure 14: Europe Industrial Hard Hats Revenue (undefined), by Application 2025 & 2033
- Figure 15: Europe Industrial Hard Hats Revenue Share (%), by Application 2025 & 2033
- Figure 16: Europe Industrial Hard Hats Revenue (undefined), by Types 2025 & 2033
- Figure 17: Europe Industrial Hard Hats Revenue Share (%), by Types 2025 & 2033
- Figure 18: Europe Industrial Hard Hats Revenue (undefined), by Country 2025 & 2033
- Figure 19: Europe Industrial Hard Hats Revenue Share (%), by Country 2025 & 2033
- Figure 20: Middle East & Africa Industrial Hard Hats Revenue (undefined), by Application 2025 & 2033
- Figure 21: Middle East & Africa Industrial Hard Hats Revenue Share (%), by Application 2025 & 2033
- Figure 22: Middle East & Africa Industrial Hard Hats Revenue (undefined), by Types 2025 & 2033
- Figure 23: Middle East & Africa Industrial Hard Hats Revenue Share (%), by Types 2025 & 2033
- Figure 24: Middle East & Africa Industrial Hard Hats Revenue (undefined), by Country 2025 & 2033
- Figure 25: Middle East & Africa Industrial Hard Hats Revenue Share (%), by Country 2025 & 2033
- Figure 26: Asia Pacific Industrial Hard Hats Revenue (undefined), by Application 2025 & 2033
- Figure 27: Asia Pacific Industrial Hard Hats Revenue Share (%), by Application 2025 & 2033
- Figure 28: Asia Pacific Industrial Hard Hats Revenue (undefined), by Types 2025 & 2033
- Figure 29: Asia Pacific Industrial Hard Hats Revenue Share (%), by Types 2025 & 2033
- Figure 30: Asia Pacific Industrial Hard Hats Revenue (undefined), by Country 2025 & 2033
- Figure 31: Asia Pacific Industrial Hard Hats Revenue Share (%), by Country 2025 & 2033
List of Tables
- Table 1: Global Industrial Hard Hats Revenue undefined Forecast, by Application 2020 & 2033
- Table 2: Global Industrial Hard Hats Revenue undefined Forecast, by Types 2020 & 2033
- Table 3: Global Industrial Hard Hats Revenue undefined Forecast, by Region 2020 & 2033
- Table 4: Global Industrial Hard Hats Revenue undefined Forecast, by Application 2020 & 2033
- Table 5: Global Industrial Hard Hats Revenue undefined Forecast, by Types 2020 & 2033
- Table 6: Global Industrial Hard Hats Revenue undefined Forecast, by Country 2020 & 2033
- Table 7: United States Industrial Hard Hats Revenue (undefined) Forecast, by Application 2020 & 2033
- Table 8: Canada Industrial Hard Hats Revenue (undefined) Forecast, by Application 2020 & 2033
- Table 9: Mexico Industrial Hard Hats Revenue (undefined) Forecast, by Application 2020 & 2033
- Table 10: Global Industrial Hard Hats Revenue undefined Forecast, by Application 2020 & 2033
- Table 11: Global Industrial Hard Hats Revenue undefined Forecast, by Types 2020 & 2033
- Table 12: Global Industrial Hard Hats Revenue undefined Forecast, by Country 2020 & 2033
- Table 13: Brazil Industrial Hard Hats Revenue (undefined) Forecast, by Application 2020 & 2033
- Table 14: Argentina Industrial Hard Hats Revenue (undefined) Forecast, by Application 2020 & 2033
- Table 15: Rest of South America Industrial Hard Hats Revenue (undefined) Forecast, by Application 2020 & 2033
- Table 16: Global Industrial Hard Hats Revenue undefined Forecast, by Application 2020 & 2033
- Table 17: Global Industrial Hard Hats Revenue undefined Forecast, by Types 2020 & 2033
- Table 18: Global Industrial Hard Hats Revenue undefined Forecast, by Country 2020 & 2033
- Table 19: United Kingdom Industrial Hard Hats Revenue (undefined) Forecast, by Application 2020 & 2033
- Table 20: Germany Industrial Hard Hats Revenue (undefined) Forecast, by Application 2020 & 2033
- Table 21: France Industrial Hard Hats Revenue (undefined) Forecast, by Application 2020 & 2033
- Table 22: Italy Industrial Hard Hats Revenue (undefined) Forecast, by Application 2020 & 2033
- Table 23: Spain Industrial Hard Hats Revenue (undefined) Forecast, by Application 2020 & 2033
- Table 24: Russia Industrial Hard Hats Revenue (undefined) Forecast, by Application 2020 & 2033
- Table 25: Benelux Industrial Hard Hats Revenue (undefined) Forecast, by Application 2020 & 2033
- Table 26: Nordics Industrial Hard Hats Revenue (undefined) Forecast, by Application 2020 & 2033
- Table 27: Rest of Europe Industrial Hard Hats Revenue (undefined) Forecast, by Application 2020 & 2033
- Table 28: Global Industrial Hard Hats Revenue undefined Forecast, by Application 2020 & 2033
- Table 29: Global Industrial Hard Hats Revenue undefined Forecast, by Types 2020 & 2033
- Table 30: Global Industrial Hard Hats Revenue undefined Forecast, by Country 2020 & 2033
- Table 31: Turkey Industrial Hard Hats Revenue (undefined) Forecast, by Application 2020 & 2033
- Table 32: Israel Industrial Hard Hats Revenue (undefined) Forecast, by Application 2020 & 2033
- Table 33: GCC Industrial Hard Hats Revenue (undefined) Forecast, by Application 2020 & 2033
- Table 34: North Africa Industrial Hard Hats Revenue (undefined) Forecast, by Application 2020 & 2033
- Table 35: South Africa Industrial Hard Hats Revenue (undefined) Forecast, by Application 2020 & 2033
- Table 36: Rest of Middle East & Africa Industrial Hard Hats Revenue (undefined) Forecast, by Application 2020 & 2033
- Table 37: Global Industrial Hard Hats Revenue undefined Forecast, by Application 2020 & 2033
- Table 38: Global Industrial Hard Hats Revenue undefined Forecast, by Types 2020 & 2033
- Table 39: Global Industrial Hard Hats Revenue undefined Forecast, by Country 2020 & 2033
- Table 40: China Industrial Hard Hats Revenue (undefined) Forecast, by Application 2020 & 2033
- Table 41: India Industrial Hard Hats Revenue (undefined) Forecast, by Application 2020 & 2033
- Table 42: Japan Industrial Hard Hats Revenue (undefined) Forecast, by Application 2020 & 2033
- Table 43: South Korea Industrial Hard Hats Revenue (undefined) Forecast, by Application 2020 & 2033
- Table 44: ASEAN Industrial Hard Hats Revenue (undefined) Forecast, by Application 2020 & 2033
- Table 45: Oceania Industrial Hard Hats Revenue (undefined) Forecast, by Application 2020 & 2033
- Table 46: Rest of Asia Pacific Industrial Hard Hats Revenue (undefined) Forecast, by Application 2020 & 2033
Frequently Asked Questions
1. What is the projected Compound Annual Growth Rate (CAGR) of the Industrial Hard Hats?
The projected CAGR is approximately 7.9%.
2. Which companies are prominent players in the Industrial Hard Hats?
Key companies in the market include Schuberth, Kask Safety, Centurion Safety, uvex safety, 3M, Active Safety NZ, NZ Safety Blackwoods, VIKING, North Safety, Neofeu, Karam.
3. What are the main segments of the Industrial Hard Hats?
The market segments include Application, Types.
4. Can you provide details about the market size?
The market size is estimated to be USD XXX N/A as of 2022.
5. What are some drivers contributing to market growth?
N/A
6. What are the notable trends driving market growth?
N/A
7. Are there any restraints impacting market growth?
N/A
8. Can you provide examples of recent developments in the market?
N/A
9. What pricing options are available for accessing the report?
Pricing options include single-user, multi-user, and enterprise licenses priced at USD 2900.00, USD 4350.00, and USD 5800.00 respectively.
10. Is the market size provided in terms of value or volume?
The market size is provided in terms of value, measured in N/A.
11. Are there any specific market keywords associated with the report?
Yes, the market keyword associated with the report is "Industrial Hard Hats," which aids in identifying and referencing the specific market segment covered.
12. How do I determine which pricing option suits my needs best?
The pricing options vary based on user requirements and access needs. Individual users may opt for single-user licenses, while businesses requiring broader access may choose multi-user or enterprise licenses for cost-effective access to the report.
13. Are there any additional resources or data provided in the Industrial Hard Hats report?
While the report offers comprehensive insights, it's advisable to review the specific contents or supplementary materials provided to ascertain if additional resources or data are available.
14. How can I stay updated on further developments or reports in the Industrial Hard Hats?
To stay informed about further developments, trends, and reports in the Industrial Hard Hats, consider subscribing to industry newsletters, following relevant companies and organizations, or regularly checking reputable industry news sources and publications.
Methodology
Step 1 - Identification of Relevant Samples Size from Population Database


Step 2 - Approaches for Defining Global Market Size (Value, Volume* & Price*)

Note*: In applicable scenarios
Step 3 - Data Sources
Primary Research
- Web Analytics
- Survey Reports
- Research Institute
- Latest Research Reports
- Opinion Leaders
Secondary Research
- Annual Reports
- White Paper
- Latest Press Release
- Industry Association
- Paid Database
- Investor Presentations

Step 4 - Data Triangulation
Involves using different sources of information in order to increase the validity of a study
These sources are likely to be stakeholders in a program - participants, other researchers, program staff, other community members, and so on.
Then we put all data in single framework & apply various statistical tools to find out the dynamic on the market.
During the analysis stage, feedback from the stakeholder groups would be compared to determine areas of agreement as well as areas of divergence

