

Key Insights
The industrial absorbent market, valued at 4762.68 million in 2025, is projected to expand at a Compound Annual Growth Rate (CAGR) of 4.1% through 2033. This growth is propelled by stringent environmental regulations and increasing industrial waste management needs across sectors including oil and gas, chemicals, and food processing. The heightened handling of hazardous materials further drives demand for specialized absorbents. Technological innovations in sustainable natural and synthetic absorbent materials are also contributing to market expansion. The Asia-Pacific region, led by China and India, is anticipated to be a key growth driver due to rapid industrialization and manufacturing expansion. Potential challenges include raw material price volatility and supply chain disruptions. Market segmentation by type (universal, oil-only, hazmat), end-user industry, and material type presents opportunities for specialized product development and targeted market penetration. Key players include 3M, Kimberly-Clark, and Ansell, alongside emerging companies focused on innovative solutions.
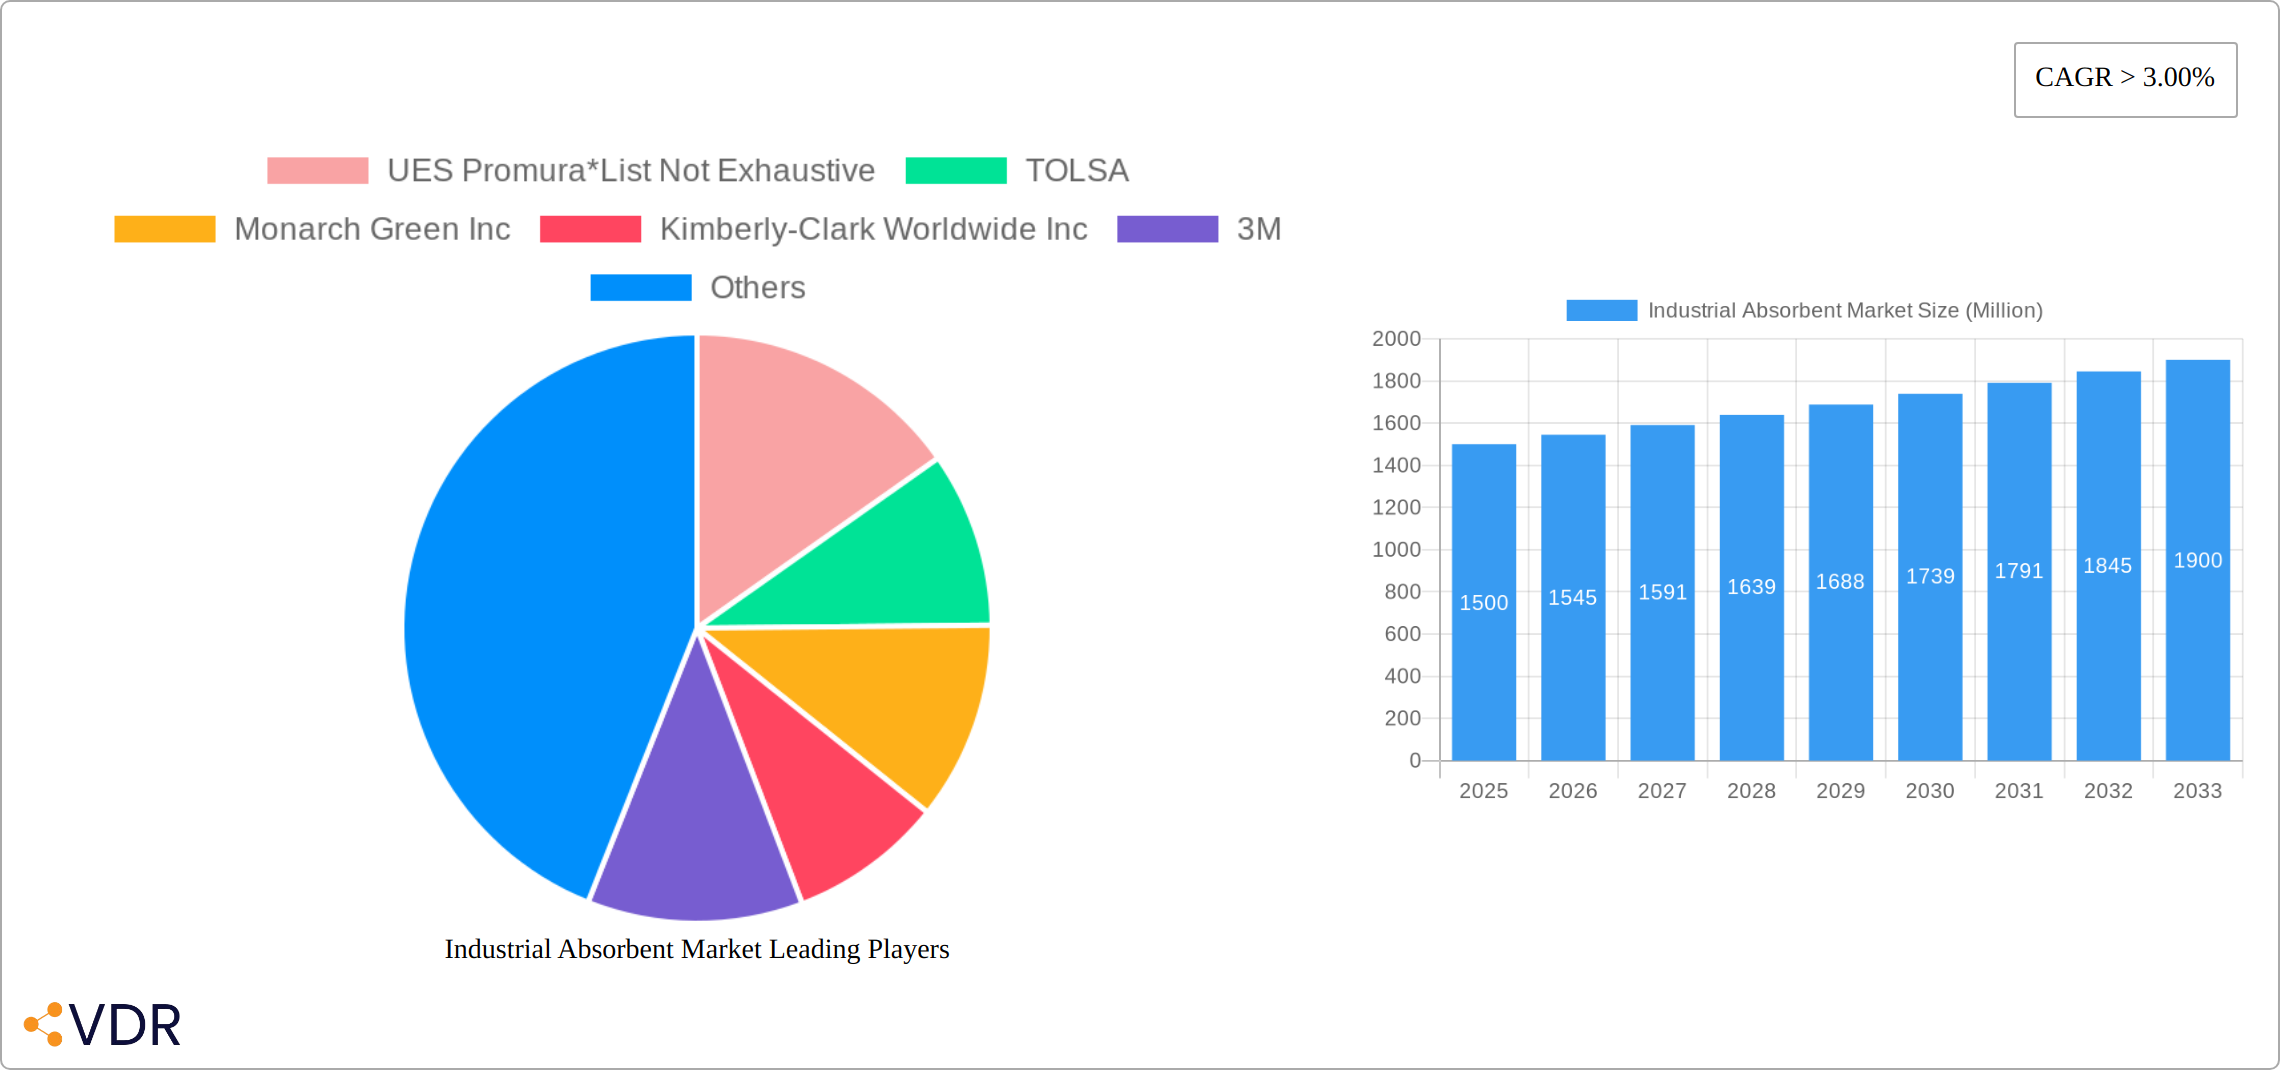
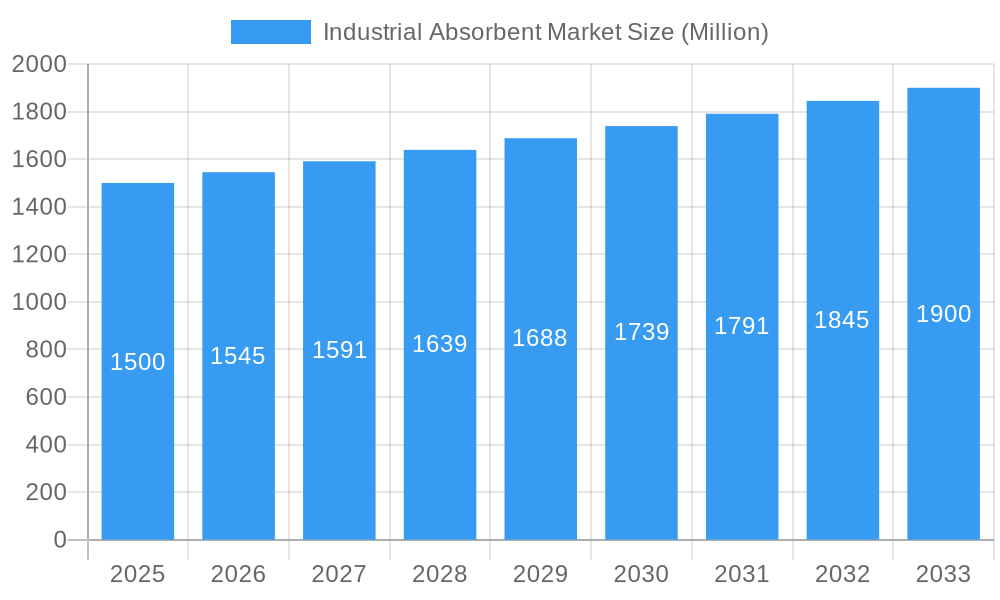
Industrial Absorbent Market Market Size (In Billion)
Diverse industrial applications ensure sustained demand for industrial absorbents. Growth is expected to be pronounced in rapidly industrializing regions. The growing emphasis on sustainability is fostering the development of eco-friendly absorbent materials. While price fluctuations present a challenge, technological advancements and the increasing importance of safety and environmental compliance support a positive growth outlook. The competitive landscape is dynamic, characterized by product innovation, strategic alliances, and geographic expansion. Segment-specific growth will be influenced by evolving industry demands and regional regulatory shifts.
Industrial Absorbent Market Company Market Share
Industrial Absorbent Market: A Comprehensive Market Report (2019-2033)
This comprehensive report provides a detailed analysis of the Industrial Absorbent Market, encompassing market dynamics, growth trends, regional dominance, product landscape, key players, and future outlook. The report covers the period 2019-2033, with 2025 as the base year and forecast period extending to 2033. The study meticulously examines the parent market and its various child segments, including Type (Universal, Oil-only, Hazmat, Other Types), End-user Industry (Oil and Gas, Chemical, Food Processing, Healthcare, Other End-user Industries), and Material Type (Natural, Synthetic). The total market value is predicted to reach xx Million units by 2033.
Industrial Absorbent Market Dynamics & Structure
The industrial absorbent market is characterized by a moderately concentrated structure, with several major players holding significant market share. Technological innovation, particularly in the development of eco-friendly and high-performance absorbents, is a key driver. Stringent environmental regulations are also shaping market trends, pushing manufacturers towards sustainable solutions. Competitive pressures from substitute products, such as reusable absorbent technologies, exist but are currently limited due to the cost-effectiveness and ease of disposal of traditional absorbents. The market is influenced by the demographics of end-user industries, with sectors like oil & gas and chemical exhibiting significant demand. M&A activity in the sector has been moderate in recent years, with approximately xx deals recorded between 2019 and 2024, resulting in a xx% market share shift amongst the leading players.
- Market Concentration: Moderately concentrated, with top 5 players holding approximately xx% of market share in 2024.
- Technological Innovation: Focus on eco-friendly materials (biodegradable, recycled content) and enhanced absorbency.
- Regulatory Framework: Stringent environmental regulations driving demand for sustainable products.
- Competitive Substitutes: Reusable absorbent technologies pose a limited threat currently.
- End-User Demographics: Oil & gas and chemical industries represent the largest end-user segments.
- M&A Trends: Moderate M&A activity, contributing to market consolidation and shifts in market share.
Industrial Absorbent Market Growth Trends & Insights
The industrial absorbent market demonstrated robust growth, achieving a CAGR of xx% during the historical period (2019-2024). This expansion was fueled by a surge in industrial activity globally and the implementation of stricter environmental regulations. Market projections indicate a substantial increase, reaching xx million units by 2025, with a projected CAGR of xx% anticipated throughout the forecast period (2025-2033). Widespread adoption is primarily attributed to the cost-effectiveness and ease of use of absorbent materials, particularly within industries facing significant spill risks. Furthermore, technological advancements, such as the development of superior absorbent materials and intelligent absorbent systems, are poised to accelerate market expansion. The growing consumer preference for eco-conscious practices is also significantly boosting demand for environmentally friendly absorbent solutions. Finally, developing economies, notably in the oil & gas and chemical sectors, are expected to witness considerable market penetration growth.
Dominant Regions, Countries, or Segments in Industrial Absorbent Market
North America currently holds a leading position in the industrial absorbent market, driven by robust industrial activity and stringent environmental regulations. Analyzing the segment breakdown reveals that universal absorbent types command the largest market share due to their versatility. The oil and gas industry emerges as the primary end-user segment, owing to the inherent high risk of spills and stringent safety requirements. Synthetic materials also hold a substantial share, attributed to their superior absorbency and durability. The competitive landscape is characterized by [mention key players or competitive dynamics, if available].
- Key Drivers in North America: Stringent environmental regulations, robust industrial activity, high awareness of safety protocols, and a well-established infrastructure supporting absorbent material usage and disposal.
- Dominance Factors: A large and technologically advanced industrial base, a strong regulatory framework enforcing environmental protection and safety standards, and high adoption rates driven by industry best practices and awareness campaigns.
- Growth Potential: Significant untapped potential exists in emerging economies, particularly in regions experiencing rapid industrialization, where increased market penetration is expected.
- Market Share (2024 Estimates): North America holds an estimated xx% market share; universal absorbent types hold approximately xx%; the Oil & Gas sector accounts for approximately xx%; and synthetic materials represent xx%.
Industrial Absorbent Market Product Landscape
The industrial absorbent market offers a diverse range of products, categorized by type (universal, oil-only, hazmat, etc.) and material (natural, synthetic). Innovations focus on enhanced absorbency, improved spill containment, and eco-friendly materials. Unique selling propositions include superior performance, cost-effectiveness, and reduced environmental impact. Technological advancements such as the incorporation of super-absorbent polymers and bio-based materials are transforming the product landscape.
Key Drivers, Barriers & Challenges in Industrial Absorbent Market
Key Drivers: Increasing industrialization, stringent environmental regulations, growing awareness of workplace safety, and the rising demand for eco-friendly solutions are key drivers. The increasing adoption of sustainable practices within the industry and the demand for specialized absorbents for specific applications also fuel market growth.
Challenges: Fluctuations in raw material prices, supply chain disruptions, and intense competition from established players pose significant challenges. The cost of implementing sustainable solutions can also act as a barrier to entry for some companies. Regulatory hurdles in specific regions can hinder market expansion.
Emerging Opportunities in Industrial Absorbent Market
Emerging opportunities lie in the development of innovative absorbent materials with enhanced performance characteristics, such as improved absorbency and biodegradability. Untapped markets in developing economies present significant growth potential. The increasing adoption of advanced absorbent technologies in niche applications, such as healthcare and food processing, offers additional opportunities for market expansion.
Growth Accelerators in the Industrial Absorbent Market Industry
Several key factors are accelerating growth within the industrial absorbent market. Technological advancements in absorbent materials, coupled with strategic partnerships aimed at expanding market reach, are paramount. The increasing adoption of sustainable manufacturing processes and the development of innovative product applications, such as those incorporating advanced polymer chemistry or bio-based materials, are also significant drivers. Expansion into new geographic markets, particularly developing regions with burgeoning industrial sectors, will further contribute to the market's upward trajectory. Government incentives promoting sustainable industrial practices and reducing environmental impact are further bolstering growth.
Key Players Shaping the Industrial Absorbent Market Market
- UES Promura
- TOLSA
- Monarch Green Inc
- Kimberly-Clark Worldwide Inc
- 3M
- Decorus Europe
- Johnson Matthey
- ANSELL LTD
- Meltblown Technologies Inc
- Brady Worldwide Inc
Notable Milestones in Industrial Absorbent Market Sector
- June 2022: Green Boom announces MoUs with IPA Qatar, expanding its presence in the Middle East with biodegradable oil-only absorbents. This marked a significant expansion into a new market for eco-friendly products.
In-Depth Industrial Absorbent Market Market Outlook
The future of the industrial absorbent market appears promising, with continued growth projected, fueled by technological innovation, the escalating demand for sustainable solutions, and expansion into new markets. Strategic collaborations and the development of innovative products will play crucial roles in shaping the market's future, presenting lucrative opportunities for both established players and emerging companies. The sustained focus on sustainability and enhanced product performance will remain key drivers of market demand, creating a positive outlook for the long-term future of this sector. Further research into [mention specific areas of future research, e.g., biodegradable absorbents, improved recycling methods] will influence market trends.
Industrial Absorbent Market Segmentation
-
1. Material Type
- 1.1. Natural
- 1.2. Synthetic
-
2. Type
- 2.1. Universal
- 2.2. Oil-only
- 2.3. Hazmat
- 2.4. Other Types
-
3. End-user Industry
- 3.1. Oil and Gas
- 3.2. Chemical
- 3.3. Food Processing
- 3.4. Healthcare
- 3.5. Other End-user Industries
Industrial Absorbent Market Segmentation By Geography
-
1. Asia Pacific
- 1.1. China
- 1.2. India
- 1.3. Japan
- 1.4. South Korea
- 1.5. Rest of Asia Pacific
-
2. North America
- 2.1. United States
- 2.2. Canada
- 2.3. Mexico
-
3. Europe
- 3.1. Germany
- 3.2. United Kingdom
- 3.3. Italy
- 3.4. France
- 3.5. Rest of Europe
-
4. South America
- 4.1. Brazil
- 4.2. Argentina
- 4.3. Rest of South America
-
5. Middle East and Africa
- 5.1. Saudi Arabia
- 5.2. South Africa
- 5.3. Rest of Middle East and Africa
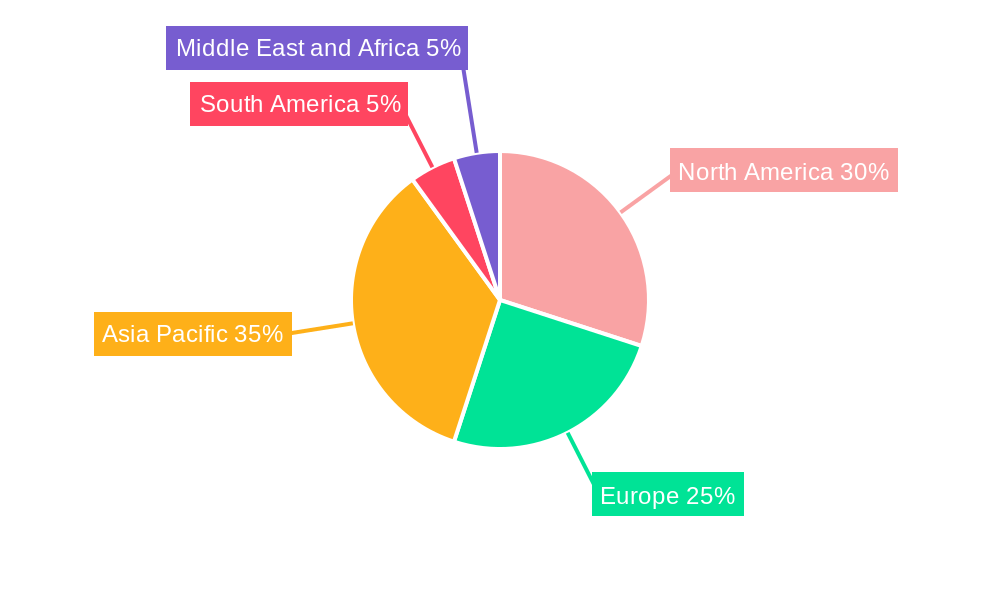
Industrial Absorbent Market Regional Market Share
Geographic Coverage of Industrial Absorbent Market
Industrial Absorbent Market REPORT HIGHLIGHTS
| Aspects | Details |
|---|---|
| Study Period | 2020-2034 |
| Base Year | 2025 |
| Estimated Year | 2026 |
| Forecast Period | 2026-2034 |
| Historical Period | 2020-2025 |
| Growth Rate | CAGR of 4.1% from 2020-2034 |
| Segmentation |
|
Table of Contents
- 1. Introduction
- 1.1. Research Scope
- 1.2. Market Segmentation
- 1.3. Research Objective
- 1.4. Definitions and Assumptions
- 2. Executive Summary
- 2.1. Market Snapshot
- 3. Market Dynamics
- 3.1. Market Drivers
- 3.2. Market Restrains
- 3.3. Market Trends
- 3.4. Market Opportunities
- 4. Market Factor Analysis
- 4.1. Porters Five Forces
- 4.1.1. Bargaining Power of Suppliers
- 4.1.2. Bargaining Power of Buyers
- 4.1.3. Threat of New Entrants
- 4.1.4. Threat of Substitutes
- 4.1.5. Competitive Rivalry
- 4.2. PESTEL analysis
- 4.3. BCG Analysis
- 4.3.1. Stars (High Growth, High Market Share)
- 4.3.2. Cash Cows (Low Growth, High Market Share)
- 4.3.3. Question Mark (High Growth, Low Market Share)
- 4.3.4. Dogs (Low Growth, Low Market Share)
- 4.4. Ansoff Matrix Analysis
- 4.5. Supply Chain Analysis
- 4.6. Regulatory Landscape
- 4.7. Current Market Potential and Opportunity Assessment (TAM–SAM–SOM Framework)
- 4.8. VDR Analyst Note
- 4.1. Porters Five Forces
- 5. Market Analysis, Insights and Forecast 2021-2033
- 5.1. Market Analysis, Insights and Forecast - by Material Type
- 5.1.1. Natural
- 5.1.2. Synthetic
- 5.2. Market Analysis, Insights and Forecast - by Type
- 5.2.1. Universal
- 5.2.2. Oil-only
- 5.2.3. Hazmat
- 5.2.4. Other Types
- 5.3. Market Analysis, Insights and Forecast - by End-user Industry
- 5.3.1. Oil and Gas
- 5.3.2. Chemical
- 5.3.3. Food Processing
- 5.3.4. Healthcare
- 5.3.5. Other End-user Industries
- 5.4. Market Analysis, Insights and Forecast - by Region
- 5.4.1. Asia Pacific
- 5.4.2. North America
- 5.4.3. Europe
- 5.4.4. South America
- 5.4.5. Middle East and Africa
- 5.1. Market Analysis, Insights and Forecast - by Material Type
- 6. Global Industrial Absorbent Market Analysis, Insights and Forecast, 2021-2033
- 6.1. Market Analysis, Insights and Forecast - by Material Type
- 6.1.1. Natural
- 6.1.2. Synthetic
- 6.2. Market Analysis, Insights and Forecast - by Type
- 6.2.1. Universal
- 6.2.2. Oil-only
- 6.2.3. Hazmat
- 6.2.4. Other Types
- 6.3. Market Analysis, Insights and Forecast - by End-user Industry
- 6.3.1. Oil and Gas
- 6.3.2. Chemical
- 6.3.3. Food Processing
- 6.3.4. Healthcare
- 6.3.5. Other End-user Industries
- 6.1. Market Analysis, Insights and Forecast - by Material Type
- 7. Asia Pacific Industrial Absorbent Market Analysis, Insights and Forecast, 2021-2033
- 7.1. Market Analysis, Insights and Forecast - by Material Type
- 7.1.1. Natural
- 7.1.2. Synthetic
- 7.2. Market Analysis, Insights and Forecast - by Type
- 7.2.1. Universal
- 7.2.2. Oil-only
- 7.2.3. Hazmat
- 7.2.4. Other Types
- 7.3. Market Analysis, Insights and Forecast - by End-user Industry
- 7.3.1. Oil and Gas
- 7.3.2. Chemical
- 7.3.3. Food Processing
- 7.3.4. Healthcare
- 7.3.5. Other End-user Industries
- 7.1. Market Analysis, Insights and Forecast - by Material Type
- 8. North America Industrial Absorbent Market Analysis, Insights and Forecast, 2021-2033
- 8.1. Market Analysis, Insights and Forecast - by Material Type
- 8.1.1. Natural
- 8.1.2. Synthetic
- 8.2. Market Analysis, Insights and Forecast - by Type
- 8.2.1. Universal
- 8.2.2. Oil-only
- 8.2.3. Hazmat
- 8.2.4. Other Types
- 8.3. Market Analysis, Insights and Forecast - by End-user Industry
- 8.3.1. Oil and Gas
- 8.3.2. Chemical
- 8.3.3. Food Processing
- 8.3.4. Healthcare
- 8.3.5. Other End-user Industries
- 8.1. Market Analysis, Insights and Forecast - by Material Type
- 9. Europe Industrial Absorbent Market Analysis, Insights and Forecast, 2021-2033
- 9.1. Market Analysis, Insights and Forecast - by Material Type
- 9.1.1. Natural
- 9.1.2. Synthetic
- 9.2. Market Analysis, Insights and Forecast - by Type
- 9.2.1. Universal
- 9.2.2. Oil-only
- 9.2.3. Hazmat
- 9.2.4. Other Types
- 9.3. Market Analysis, Insights and Forecast - by End-user Industry
- 9.3.1. Oil and Gas
- 9.3.2. Chemical
- 9.3.3. Food Processing
- 9.3.4. Healthcare
- 9.3.5. Other End-user Industries
- 9.1. Market Analysis, Insights and Forecast - by Material Type
- 10. South America Industrial Absorbent Market Analysis, Insights and Forecast, 2021-2033
- 10.1. Market Analysis, Insights and Forecast - by Material Type
- 10.1.1. Natural
- 10.1.2. Synthetic
- 10.2. Market Analysis, Insights and Forecast - by Type
- 10.2.1. Universal
- 10.2.2. Oil-only
- 10.2.3. Hazmat
- 10.2.4. Other Types
- 10.3. Market Analysis, Insights and Forecast - by End-user Industry
- 10.3.1. Oil and Gas
- 10.3.2. Chemical
- 10.3.3. Food Processing
- 10.3.4. Healthcare
- 10.3.5. Other End-user Industries
- 10.1. Market Analysis, Insights and Forecast - by Material Type
- 11. Middle East and Africa Industrial Absorbent Market Analysis, Insights and Forecast, 2021-2033
- 11.1. Market Analysis, Insights and Forecast - by Material Type
- 11.1.1. Natural
- 11.1.2. Synthetic
- 11.2. Market Analysis, Insights and Forecast - by Type
- 11.2.1. Universal
- 11.2.2. Oil-only
- 11.2.3. Hazmat
- 11.2.4. Other Types
- 11.3. Market Analysis, Insights and Forecast - by End-user Industry
- 11.3.1. Oil and Gas
- 11.3.2. Chemical
- 11.3.3. Food Processing
- 11.3.4. Healthcare
- 11.3.5. Other End-user Industries
- 11.1. Market Analysis, Insights and Forecast - by Material Type
- 12. Competitive Analysis
- 12.1. Company Profiles
- 12.1.1 UES Promura*List Not Exhaustive
- 12.1.1.1. Company Overview
- 12.1.1.2. Products
- 12.1.1.3. Company Financials
- 12.1.1.4. SWOT Analysis
- 12.1.2 TOLSA
- 12.1.2.1. Company Overview
- 12.1.2.2. Products
- 12.1.2.3. Company Financials
- 12.1.2.4. SWOT Analysis
- 12.1.3 Monarch Green Inc
- 12.1.3.1. Company Overview
- 12.1.3.2. Products
- 12.1.3.3. Company Financials
- 12.1.3.4. SWOT Analysis
- 12.1.4 Kimberly-Clark Worldwide Inc
- 12.1.4.1. Company Overview
- 12.1.4.2. Products
- 12.1.4.3. Company Financials
- 12.1.4.4. SWOT Analysis
- 12.1.5 3M
- 12.1.5.1. Company Overview
- 12.1.5.2. Products
- 12.1.5.3. Company Financials
- 12.1.5.4. SWOT Analysis
- 12.1.6 Decorus Europe
- 12.1.6.1. Company Overview
- 12.1.6.2. Products
- 12.1.6.3. Company Financials
- 12.1.6.4. SWOT Analysis
- 12.1.7 Johnson Matthey
- 12.1.7.1. Company Overview
- 12.1.7.2. Products
- 12.1.7.3. Company Financials
- 12.1.7.4. SWOT Analysis
- 12.1.8 ANSELL LTD
- 12.1.8.1. Company Overview
- 12.1.8.2. Products
- 12.1.8.3. Company Financials
- 12.1.8.4. SWOT Analysis
- 12.1.9 Meltblown Technologies Inc
- 12.1.9.1. Company Overview
- 12.1.9.2. Products
- 12.1.9.3. Company Financials
- 12.1.9.4. SWOT Analysis
- 12.1.10 Brady Worldwide Inc
- 12.1.10.1. Company Overview
- 12.1.10.2. Products
- 12.1.10.3. Company Financials
- 12.1.10.4. SWOT Analysis
- 12.1.1 UES Promura*List Not Exhaustive
- 12.2. Market Entropy
- 12.2.1 Company's Key Areas Served
- 12.2.2 Recent Developments
- 12.3. Company Market Share Analysis 2025
- 12.3.1 Top 5 Companies Market Share Analysis
- 12.3.2 Top 3 Companies Market Share Analysis
- 12.4. List of Potential Customers
- 13. Research Methodology
List of Figures
- Figure 1: Global Industrial Absorbent Market Revenue Breakdown (million, %) by Region 2025 & 2033
- Figure 2: Asia Pacific Industrial Absorbent Market Revenue (million), by Material Type 2025 & 2033
- Figure 3: Asia Pacific Industrial Absorbent Market Revenue Share (%), by Material Type 2025 & 2033
- Figure 4: Asia Pacific Industrial Absorbent Market Revenue (million), by Type 2025 & 2033
- Figure 5: Asia Pacific Industrial Absorbent Market Revenue Share (%), by Type 2025 & 2033
- Figure 6: Asia Pacific Industrial Absorbent Market Revenue (million), by End-user Industry 2025 & 2033
- Figure 7: Asia Pacific Industrial Absorbent Market Revenue Share (%), by End-user Industry 2025 & 2033
- Figure 8: Asia Pacific Industrial Absorbent Market Revenue (million), by Country 2025 & 2033
- Figure 9: Asia Pacific Industrial Absorbent Market Revenue Share (%), by Country 2025 & 2033
- Figure 10: North America Industrial Absorbent Market Revenue (million), by Material Type 2025 & 2033
- Figure 11: North America Industrial Absorbent Market Revenue Share (%), by Material Type 2025 & 2033
- Figure 12: North America Industrial Absorbent Market Revenue (million), by Type 2025 & 2033
- Figure 13: North America Industrial Absorbent Market Revenue Share (%), by Type 2025 & 2033
- Figure 14: North America Industrial Absorbent Market Revenue (million), by End-user Industry 2025 & 2033
- Figure 15: North America Industrial Absorbent Market Revenue Share (%), by End-user Industry 2025 & 2033
- Figure 16: North America Industrial Absorbent Market Revenue (million), by Country 2025 & 2033
- Figure 17: North America Industrial Absorbent Market Revenue Share (%), by Country 2025 & 2033
- Figure 18: Europe Industrial Absorbent Market Revenue (million), by Material Type 2025 & 2033
- Figure 19: Europe Industrial Absorbent Market Revenue Share (%), by Material Type 2025 & 2033
- Figure 20: Europe Industrial Absorbent Market Revenue (million), by Type 2025 & 2033
- Figure 21: Europe Industrial Absorbent Market Revenue Share (%), by Type 2025 & 2033
- Figure 22: Europe Industrial Absorbent Market Revenue (million), by End-user Industry 2025 & 2033
- Figure 23: Europe Industrial Absorbent Market Revenue Share (%), by End-user Industry 2025 & 2033
- Figure 24: Europe Industrial Absorbent Market Revenue (million), by Country 2025 & 2033
- Figure 25: Europe Industrial Absorbent Market Revenue Share (%), by Country 2025 & 2033
- Figure 26: South America Industrial Absorbent Market Revenue (million), by Material Type 2025 & 2033
- Figure 27: South America Industrial Absorbent Market Revenue Share (%), by Material Type 2025 & 2033
- Figure 28: South America Industrial Absorbent Market Revenue (million), by Type 2025 & 2033
- Figure 29: South America Industrial Absorbent Market Revenue Share (%), by Type 2025 & 2033
- Figure 30: South America Industrial Absorbent Market Revenue (million), by End-user Industry 2025 & 2033
- Figure 31: South America Industrial Absorbent Market Revenue Share (%), by End-user Industry 2025 & 2033
- Figure 32: South America Industrial Absorbent Market Revenue (million), by Country 2025 & 2033
- Figure 33: South America Industrial Absorbent Market Revenue Share (%), by Country 2025 & 2033
- Figure 34: Middle East and Africa Industrial Absorbent Market Revenue (million), by Material Type 2025 & 2033
- Figure 35: Middle East and Africa Industrial Absorbent Market Revenue Share (%), by Material Type 2025 & 2033
- Figure 36: Middle East and Africa Industrial Absorbent Market Revenue (million), by Type 2025 & 2033
- Figure 37: Middle East and Africa Industrial Absorbent Market Revenue Share (%), by Type 2025 & 2033
- Figure 38: Middle East and Africa Industrial Absorbent Market Revenue (million), by End-user Industry 2025 & 2033
- Figure 39: Middle East and Africa Industrial Absorbent Market Revenue Share (%), by End-user Industry 2025 & 2033
- Figure 40: Middle East and Africa Industrial Absorbent Market Revenue (million), by Country 2025 & 2033
- Figure 41: Middle East and Africa Industrial Absorbent Market Revenue Share (%), by Country 2025 & 2033
List of Tables
- Table 1: Global Industrial Absorbent Market Revenue million Forecast, by Material Type 2020 & 2033
- Table 2: Global Industrial Absorbent Market Revenue million Forecast, by Type 2020 & 2033
- Table 3: Global Industrial Absorbent Market Revenue million Forecast, by End-user Industry 2020 & 2033
- Table 4: Global Industrial Absorbent Market Revenue million Forecast, by Region 2020 & 2033
- Table 5: Global Industrial Absorbent Market Revenue million Forecast, by Material Type 2020 & 2033
- Table 6: Global Industrial Absorbent Market Revenue million Forecast, by Type 2020 & 2033
- Table 7: Global Industrial Absorbent Market Revenue million Forecast, by End-user Industry 2020 & 2033
- Table 8: Global Industrial Absorbent Market Revenue million Forecast, by Country 2020 & 2033
- Table 9: China Industrial Absorbent Market Revenue (million) Forecast, by Application 2020 & 2033
- Table 10: India Industrial Absorbent Market Revenue (million) Forecast, by Application 2020 & 2033
- Table 11: Japan Industrial Absorbent Market Revenue (million) Forecast, by Application 2020 & 2033
- Table 12: South Korea Industrial Absorbent Market Revenue (million) Forecast, by Application 2020 & 2033
- Table 13: Rest of Asia Pacific Industrial Absorbent Market Revenue (million) Forecast, by Application 2020 & 2033
- Table 14: Global Industrial Absorbent Market Revenue million Forecast, by Material Type 2020 & 2033
- Table 15: Global Industrial Absorbent Market Revenue million Forecast, by Type 2020 & 2033
- Table 16: Global Industrial Absorbent Market Revenue million Forecast, by End-user Industry 2020 & 2033
- Table 17: Global Industrial Absorbent Market Revenue million Forecast, by Country 2020 & 2033
- Table 18: United States Industrial Absorbent Market Revenue (million) Forecast, by Application 2020 & 2033
- Table 19: Canada Industrial Absorbent Market Revenue (million) Forecast, by Application 2020 & 2033
- Table 20: Mexico Industrial Absorbent Market Revenue (million) Forecast, by Application 2020 & 2033
- Table 21: Global Industrial Absorbent Market Revenue million Forecast, by Material Type 2020 & 2033
- Table 22: Global Industrial Absorbent Market Revenue million Forecast, by Type 2020 & 2033
- Table 23: Global Industrial Absorbent Market Revenue million Forecast, by End-user Industry 2020 & 2033
- Table 24: Global Industrial Absorbent Market Revenue million Forecast, by Country 2020 & 2033
- Table 25: Germany Industrial Absorbent Market Revenue (million) Forecast, by Application 2020 & 2033
- Table 26: United Kingdom Industrial Absorbent Market Revenue (million) Forecast, by Application 2020 & 2033
- Table 27: Italy Industrial Absorbent Market Revenue (million) Forecast, by Application 2020 & 2033
- Table 28: France Industrial Absorbent Market Revenue (million) Forecast, by Application 2020 & 2033
- Table 29: Rest of Europe Industrial Absorbent Market Revenue (million) Forecast, by Application 2020 & 2033
- Table 30: Global Industrial Absorbent Market Revenue million Forecast, by Material Type 2020 & 2033
- Table 31: Global Industrial Absorbent Market Revenue million Forecast, by Type 2020 & 2033
- Table 32: Global Industrial Absorbent Market Revenue million Forecast, by End-user Industry 2020 & 2033
- Table 33: Global Industrial Absorbent Market Revenue million Forecast, by Country 2020 & 2033
- Table 34: Brazil Industrial Absorbent Market Revenue (million) Forecast, by Application 2020 & 2033
- Table 35: Argentina Industrial Absorbent Market Revenue (million) Forecast, by Application 2020 & 2033
- Table 36: Rest of South America Industrial Absorbent Market Revenue (million) Forecast, by Application 2020 & 2033
- Table 37: Global Industrial Absorbent Market Revenue million Forecast, by Material Type 2020 & 2033
- Table 38: Global Industrial Absorbent Market Revenue million Forecast, by Type 2020 & 2033
- Table 39: Global Industrial Absorbent Market Revenue million Forecast, by End-user Industry 2020 & 2033
- Table 40: Global Industrial Absorbent Market Revenue million Forecast, by Country 2020 & 2033
- Table 41: Saudi Arabia Industrial Absorbent Market Revenue (million) Forecast, by Application 2020 & 2033
- Table 42: South Africa Industrial Absorbent Market Revenue (million) Forecast, by Application 2020 & 2033
- Table 43: Rest of Middle East and Africa Industrial Absorbent Market Revenue (million) Forecast, by Application 2020 & 2033
Frequently Asked Questions
1. What is the projected Compound Annual Growth Rate (CAGR) of the Industrial Absorbent Market?
The projected CAGR is approximately 4.1%.
2. Which companies are prominent players in the Industrial Absorbent Market?
Key companies in the market include UES Promura*List Not Exhaustive, TOLSA, Monarch Green Inc, Kimberly-Clark Worldwide Inc, 3M, Decorus Europe, Johnson Matthey, ANSELL LTD, Meltblown Technologies Inc, Brady Worldwide Inc.
3. What are the main segments of the Industrial Absorbent Market?
The market segments include Material Type, Type, End-user Industry.
4. Can you provide details about the market size?
The market size is estimated to be USD 4762.68 million as of 2022.
5. What are some drivers contributing to market growth?
Growing Demand from the Oil and Gas Industry; Other Drivers.
6. What are the notable trends driving market growth?
Oil and Gas Industry to Dominate the Demand.
7. Are there any restraints impacting market growth?
Health Hazards related to the Manufacturing of the Absorbents; Other Restraints.
8. Can you provide examples of recent developments in the market?
June 2022: Green Boom, a revolutionary line of eco-friendly oil absorbent products, announced a Memorandums of Understanding (MoUs) with Investment Promotion Agency Qatar (IPA Qatar) during the second annual Qatar Economic Forum. With this announcement, the company created its presence in the Middle East region to cater biodegradable line of oil-only absorbents suitable for large spill response, industrial and transportation applications.
9. What pricing options are available for accessing the report?
Pricing options include single-user, multi-user, and enterprise licenses priced at USD 4750, USD 5250, and USD 8750 respectively.
10. Is the market size provided in terms of value or volume?
The market size is provided in terms of value, measured in million.
11. Are there any specific market keywords associated with the report?
Yes, the market keyword associated with the report is "Industrial Absorbent Market," which aids in identifying and referencing the specific market segment covered.
12. How do I determine which pricing option suits my needs best?
The pricing options vary based on user requirements and access needs. Individual users may opt for single-user licenses, while businesses requiring broader access may choose multi-user or enterprise licenses for cost-effective access to the report.
13. Are there any additional resources or data provided in the Industrial Absorbent Market report?
While the report offers comprehensive insights, it's advisable to review the specific contents or supplementary materials provided to ascertain if additional resources or data are available.
14. How can I stay updated on further developments or reports in the Industrial Absorbent Market?
To stay informed about further developments, trends, and reports in the Industrial Absorbent Market, consider subscribing to industry newsletters, following relevant companies and organizations, or regularly checking reputable industry news sources and publications.
Methodology
Step 1 - Identification of Relevant Samples Size from Population Database


Step 2 - Approaches for Defining Global Market Size (Value, Volume* & Price*)

Note*: In applicable scenarios
Step 3 - Data Sources
Primary Research
- Web Analytics
- Survey Reports
- Research Institute
- Latest Research Reports
- Opinion Leaders
Secondary Research
- Annual Reports
- White Paper
- Latest Press Release
- Industry Association
- Paid Database
- Investor Presentations

Step 4 - Data Triangulation
Involves using different sources of information in order to increase the validity of a study
These sources are likely to be stakeholders in a program - participants, other researchers, program staff, other community members, and so on.
Then we put all data in single framework & apply various statistical tools to find out the dynamic on the market.
During the analysis stage, feedback from the stakeholder groups would be compared to determine areas of agreement as well as areas of divergence