
Key Insights
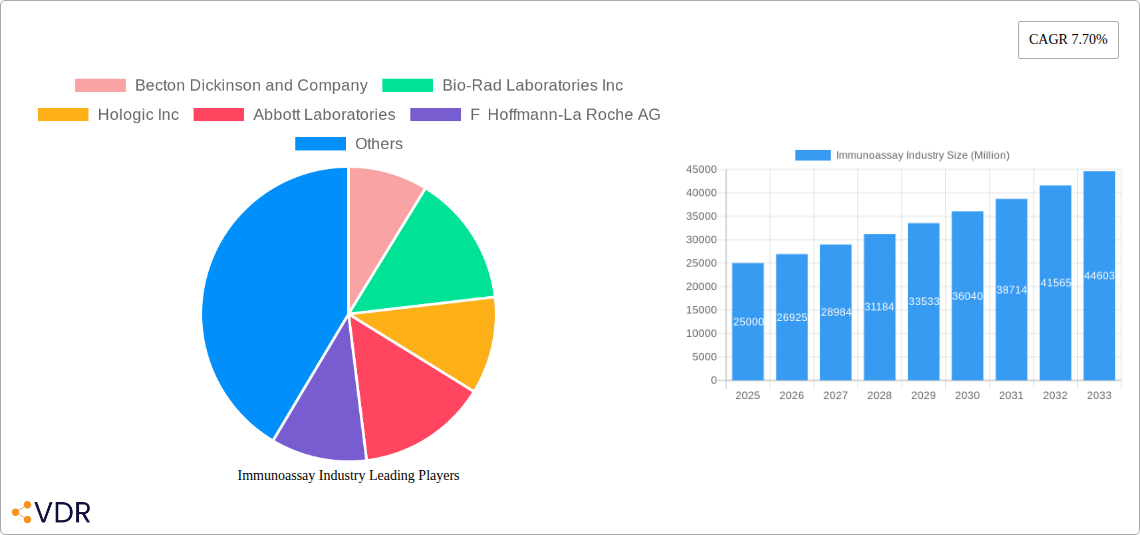
The immunoassay market, valued at approximately $XX million in 2025, is projected to experience robust growth, driven by a Compound Annual Growth Rate (CAGR) of 7.70% from 2025 to 2033. This expansion is fueled by several key factors. The increasing prevalence of chronic diseases globally necessitates advanced diagnostic tools, significantly boosting the demand for immunoassays in disease diagnosis and therapeutic drug monitoring. Technological advancements, such as the development of more sensitive and specific assays like Chemiluminescence Immunoassay (CLIA) and Fluoroimmunoassay (FIA), are further accelerating market growth. Furthermore, the rising adoption of point-of-care testing and the increasing investment in research and development within the pharmaceutical and biotechnology sectors contribute to market expansion. The segment breakdown reveals that Enzyme Immunoassays (EIA) and Chemiluminescence Immunoassays (CLIA) currently hold significant market share due to their widespread application and established reliability. However, the growing preference for high-throughput, automated systems and the increasing demand for faster results are driving the adoption of more sophisticated technologies like FIA.
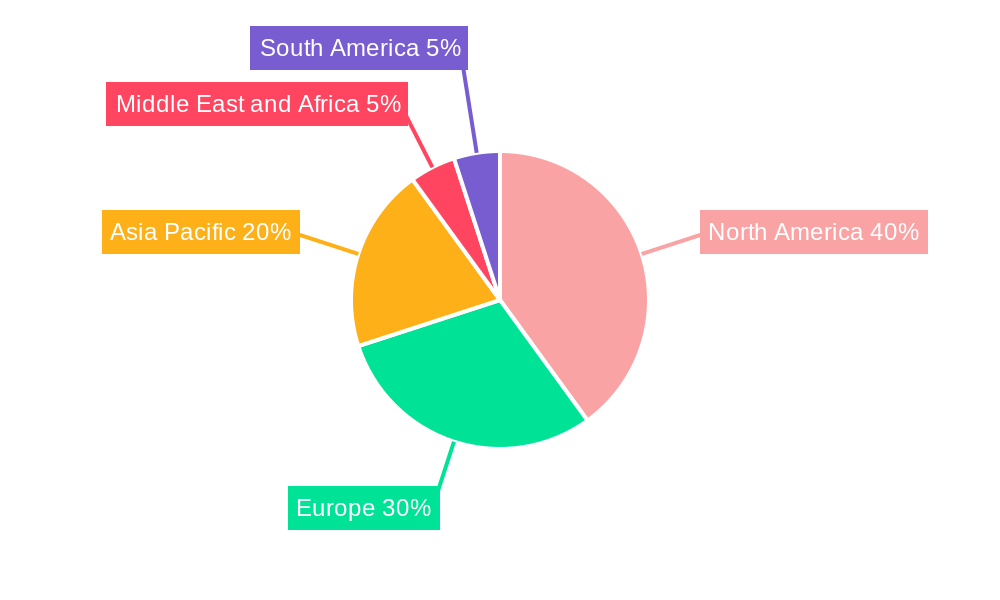
Geographical analysis indicates strong market presence in North America and Europe, driven by well-established healthcare infrastructure and high healthcare expenditure. However, the Asia-Pacific region is expected to witness significant growth in the coming years, fueled by rising healthcare awareness, increasing disposable incomes, and expanding healthcare infrastructure. Competition in the immunoassay market is intense, with key players such as Becton Dickinson, Bio-Rad Laboratories, Abbott Laboratories, and Roche actively engaged in product innovation and strategic partnerships to maintain their market share. Despite challenges such as stringent regulatory requirements and the potential for high assay costs, the long-term outlook for the immunoassay market remains highly promising, driven by continuous advancements in assay technology, increasing diagnostic needs, and expanding global healthcare spending.
Immunoassay Industry Market Report: 2019-2033
This comprehensive report provides a detailed analysis of the Immunoassay industry, encompassing market dynamics, growth trends, regional segmentation, product landscape, and key players. With a study period spanning 2019-2033, a base year of 2025, and a forecast period of 2025-2033, this report offers invaluable insights for industry professionals, investors, and strategic decision-makers. The market is segmented by Type (Radioimmunoassay (RIA), Enzyme Immunoassays (EIA), Fluoroimmunoassay (FIA), Chemiluminescence Immunoassay (CLIA), Others), Application (Disease Diagnosis, Therapeutic Drug Monitoring, Drug Discovery, Clinical Chemistry, Hematology, Others), and End User (Hospitals, Pharma & Biotech Companies, Clinical Laboratories, Others). The global Immunoassay market size is projected to reach xx Million units by 2033.
Immunoassay Industry Market Dynamics & Structure
The Immunoassay market is characterized by a moderately concentrated landscape, with key players like Abbott Laboratories, Roche, and Thermo Fisher Scientific holding significant market share. Technological innovation, particularly in areas like multiplex assays and point-of-care diagnostics, is a primary driver of growth. Stringent regulatory frameworks, particularly concerning diagnostic accuracy and safety, influence market dynamics. The emergence of advanced molecular diagnostic techniques presents competitive substitution, while mergers and acquisitions consolidate market power. The market exhibits significant growth in developing economies driven by rising healthcare expenditure and infectious disease prevalence.
- Market Concentration: Highly concentrated with top 5 players holding approximately xx% market share in 2024.
- Technological Innovation: Rapid advancements in automation, multiplexing, and miniaturization drive market growth.
- Regulatory Landscape: Stringent regulations on diagnostic accuracy and safety impact market entry and product development.
- Competitive Substitutes: Molecular diagnostics pose a competitive threat, necessitating continuous innovation.
- M&A Activity: Consolidation through mergers and acquisitions is observed, leading to increased market concentration. An estimated xx M&A deals occurred between 2019-2024.
- End-User Demographics: Growing geriatric population and increasing prevalence of chronic diseases fuel market demand.
Immunoassay Industry Growth Trends & Insights
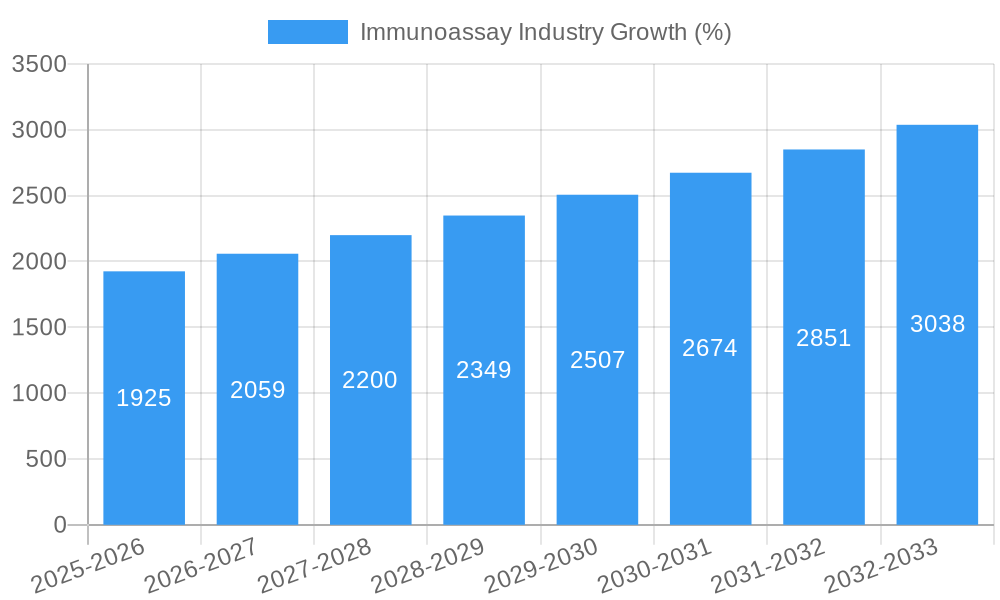
The Immunoassay market has witnessed consistent growth over the historical period (2019-2024), driven by factors such as technological advancements, rising healthcare expenditure, and increasing prevalence of chronic diseases. The market is expected to maintain a healthy Compound Annual Growth Rate (CAGR) of xx% during the forecast period (2025-2033). This growth is further fueled by the rising adoption of point-of-care diagnostics, which offer rapid and convenient testing. Consumer behavior is shifting towards personalized medicine, demanding more sophisticated and targeted diagnostic tools. Technological disruptions, such as the integration of artificial intelligence and big data analytics, are transforming the landscape, improving diagnostic accuracy and efficiency. Market penetration is expected to increase significantly in emerging markets.
Dominant Regions, Countries, or Segments in Immunoassay Industry
North America currently dominates the Immunoassay market, driven by robust healthcare infrastructure, high technological adoption, and significant research and development investment. However, Asia-Pacific is projected to experience the fastest growth rate due to rising healthcare spending, increasing disease prevalence, and expanding healthcare infrastructure. Within the segment breakdown:
- By Type: Chemiluminescence Immunoassay (CLIA) holds the largest market share, owing to its high sensitivity and specificity.
- By Application: Disease diagnosis represents the largest application segment, driven by the rising prevalence of infectious and chronic diseases.
- By End User: Hospitals are the primary end-users, followed by clinical laboratories.
Key Drivers:
- North America: High healthcare expenditure, advanced healthcare infrastructure, and strong regulatory support.
- Asia-Pacific: Rising healthcare spending, increasing prevalence of infectious diseases, and expanding healthcare infrastructure.
- Europe: Well-established healthcare systems and strong regulatory frameworks.
Immunoassay Industry Product Landscape
The Immunoassay product landscape is characterized by a wide range of assays, including RIA, EIA, FIA, and CLIA, each with unique features and applications. Recent innovations focus on improving assay sensitivity, specificity, and speed. The development of multiplexed assays allows for simultaneous detection of multiple analytes, improving efficiency and reducing costs. Miniaturization and point-of-care technologies are driving the development of portable and user-friendly devices, expanding accessibility. Key selling propositions include improved accuracy, faster turnaround times, and reduced costs.
Key Drivers, Barriers & Challenges in Immunoassay Industry
Key Drivers:
- Technological advancements in assay formats and automation.
- Rising prevalence of chronic diseases necessitating increased diagnostics.
- Growing demand for point-of-care testing.
- Increasing investments in research and development.
Key Challenges:
- High cost of equipment and reagents.
- Stringent regulatory approvals for new assays.
- Competition from alternative diagnostic techniques.
- Supply chain disruptions impacting reagent availability. (estimated xx% impact on market growth in 2024)
Emerging Opportunities in Immunoassay Industry
Emerging opportunities include the development of personalized medicine diagnostic tools, integration of artificial intelligence for improved diagnostic accuracy, expansion into untapped markets in developing countries, and development of novel assays for emerging diseases.
Growth Accelerators in the Immunoassay Industry
Technological breakthroughs, particularly in the development of highly sensitive and specific assays, are significant growth catalysts. Strategic partnerships between assay manufacturers and healthcare providers enhance market reach and adoption. Expansion into emerging markets, coupled with government initiatives supporting healthcare infrastructure development, further fuels growth.
Key Players Shaping the Immunoassay Industry Market
- Becton Dickinson and Company
- Bio-Rad Laboratories Inc
- Hologic Inc
- Abbott Laboratories
- F Hoffmann-La Roche AG
- Agilent Technologies Inc
- Danaher Corporation (Beckman Coulter Inc)
- Qiagen NV
- Sysmex Corporation
- Thermo Fisher Scientific
- Luminex Corporation
- PerkinElmer Inc
Notable Milestones in Immunoassay Industry Sector
- November 2022: Getein launched MAGICL 6000 CLIA analyzer at MEDICA 2022.
- November 2022: LumiraDx launched a rapid microfluidic immunoassay HbA1c test in Europe, parts of the Middle East, Asia, Latin America, and Africa.
In-Depth Immunoassay Industry Market Outlook
The Immunoassay market is poised for continued growth, driven by technological advancements, increasing disease prevalence, and rising healthcare spending. Strategic opportunities lie in developing innovative assays, expanding into emerging markets, and leveraging technological advancements such as AI and big data analytics to enhance diagnostic capabilities. The market is expected to experience significant expansion, creating lucrative opportunities for players who can effectively address the evolving needs of healthcare providers and patients.
Immunoassay Industry Segmentation
-
1. Type
- 1.1. Radioimmunoassay (RIA)
- 1.2. Enzyme Immunoassays (EIA)
- 1.3. Fluoroimmnoassay (FIA)
- 1.4. Chemiluminescence Immunoassay (CLIA)
- 1.5. Others
-
2. Application
- 2.1. Disease Diagnosis
- 2.2. Therapeutic Drug Monitoring
- 2.3. Drug Discovery
- 2.4. Clinical Chemistry
- 2.5. Hematology
- 2.6. Others
-
3. End User
- 3.1. Hospitals
- 3.2. Pharma & Biotech Companies
- 3.3. Clinical Laboratories
- 3.4. Others
Immunoassay Industry Segmentation By Geography
-
1. North America
- 1.1. United States
- 1.2. Canada
- 1.3. Mexico
-
2. Europe
- 2.1. Germany
- 2.2. United Kingdom
- 2.3. France
- 2.4. Italy
- 2.5. Spain
- 2.6. Rest of Europe
-
3. Asia Pacific
- 3.1. China
- 3.2. Japan
- 3.3. India
- 3.4. Australia
- 3.5. South Korea
- 3.6. Rest of Asia Pacific
-
4. Middle East and Africa
- 4.1. GCC
- 4.2. South Africa
- 4.3. Rest of Middle East and Africa
-
5. South America
- 5.1. Brazil
- 5.2. Argentina
- 5.3. Rest of South America
Immunoassay Industry REPORT HIGHLIGHTS
| Aspects | Details |
|---|---|
| Study Period | 2019-2033 |
| Base Year | 2024 |
| Estimated Year | 2025 |
| Forecast Period | 2025-2033 |
| Historical Period | 2019-2024 |
| Growth Rate | CAGR of 7.70% from 2019-2033 |
| Segmentation |
|
Table of Contents
- 1. Introduction
- 1.1. Research Scope
- 1.2. Market Segmentation
- 1.3. Research Methodology
- 1.4. Definitions and Assumptions
- 2. Executive Summary
- 2.1. Introduction
- 3. Market Dynamics
- 3.1. Introduction
- 3.2. Market Drivers
- 3.2.1. High Sensitivity and Specificity of Immunoassays; Technological Advancements in Immunoassay Instruments; Increasing Prevalence of Chronic and Infectious Diseases
- 3.3. Market Restrains
- 3.3.1. Stringent Regulatory Scenario for Approval of Immunoassays; Complexity of Procedures
- 3.4. Market Trends
- 3.4.1. Enzyme Immunoassays (EIA) Segment is Expected to Hold Significant Market Share in Immunoassay Market
- 4. Market Factor Analysis
- 4.1. Porters Five Forces
- 4.2. Supply/Value Chain
- 4.3. PESTEL analysis
- 4.4. Market Entropy
- 4.5. Patent/Trademark Analysis
- 5. Global Immunoassay Industry Analysis, Insights and Forecast, 2019-2031
- 5.1. Market Analysis, Insights and Forecast - by Type
- 5.1.1. Radioimmunoassay (RIA)
- 5.1.2. Enzyme Immunoassays (EIA)
- 5.1.3. Fluoroimmnoassay (FIA)
- 5.1.4. Chemiluminescence Immunoassay (CLIA)
- 5.1.5. Others
- 5.2. Market Analysis, Insights and Forecast - by Application
- 5.2.1. Disease Diagnosis
- 5.2.2. Therapeutic Drug Monitoring
- 5.2.3. Drug Discovery
- 5.2.4. Clinical Chemistry
- 5.2.5. Hematology
- 5.2.6. Others
- 5.3. Market Analysis, Insights and Forecast - by End User
- 5.3.1. Hospitals
- 5.3.2. Pharma & Biotech Companies
- 5.3.3. Clinical Laboratories
- 5.3.4. Others
- 5.4. Market Analysis, Insights and Forecast - by Region
- 5.4.1. North America
- 5.4.2. Europe
- 5.4.3. Asia Pacific
- 5.4.4. Middle East and Africa
- 5.4.5. South America
- 5.1. Market Analysis, Insights and Forecast - by Type
- 6. North America Immunoassay Industry Analysis, Insights and Forecast, 2019-2031
- 6.1. Market Analysis, Insights and Forecast - by Type
- 6.1.1. Radioimmunoassay (RIA)
- 6.1.2. Enzyme Immunoassays (EIA)
- 6.1.3. Fluoroimmnoassay (FIA)
- 6.1.4. Chemiluminescence Immunoassay (CLIA)
- 6.1.5. Others
- 6.2. Market Analysis, Insights and Forecast - by Application
- 6.2.1. Disease Diagnosis
- 6.2.2. Therapeutic Drug Monitoring
- 6.2.3. Drug Discovery
- 6.2.4. Clinical Chemistry
- 6.2.5. Hematology
- 6.2.6. Others
- 6.3. Market Analysis, Insights and Forecast - by End User
- 6.3.1. Hospitals
- 6.3.2. Pharma & Biotech Companies
- 6.3.3. Clinical Laboratories
- 6.3.4. Others
- 6.1. Market Analysis, Insights and Forecast - by Type
- 7. Europe Immunoassay Industry Analysis, Insights and Forecast, 2019-2031
- 7.1. Market Analysis, Insights and Forecast - by Type
- 7.1.1. Radioimmunoassay (RIA)
- 7.1.2. Enzyme Immunoassays (EIA)
- 7.1.3. Fluoroimmnoassay (FIA)
- 7.1.4. Chemiluminescence Immunoassay (CLIA)
- 7.1.5. Others
- 7.2. Market Analysis, Insights and Forecast - by Application
- 7.2.1. Disease Diagnosis
- 7.2.2. Therapeutic Drug Monitoring
- 7.2.3. Drug Discovery
- 7.2.4. Clinical Chemistry
- 7.2.5. Hematology
- 7.2.6. Others
- 7.3. Market Analysis, Insights and Forecast - by End User
- 7.3.1. Hospitals
- 7.3.2. Pharma & Biotech Companies
- 7.3.3. Clinical Laboratories
- 7.3.4. Others
- 7.1. Market Analysis, Insights and Forecast - by Type
- 8. Asia Pacific Immunoassay Industry Analysis, Insights and Forecast, 2019-2031
- 8.1. Market Analysis, Insights and Forecast - by Type
- 8.1.1. Radioimmunoassay (RIA)
- 8.1.2. Enzyme Immunoassays (EIA)
- 8.1.3. Fluoroimmnoassay (FIA)
- 8.1.4. Chemiluminescence Immunoassay (CLIA)
- 8.1.5. Others
- 8.2. Market Analysis, Insights and Forecast - by Application
- 8.2.1. Disease Diagnosis
- 8.2.2. Therapeutic Drug Monitoring
- 8.2.3. Drug Discovery
- 8.2.4. Clinical Chemistry
- 8.2.5. Hematology
- 8.2.6. Others
- 8.3. Market Analysis, Insights and Forecast - by End User
- 8.3.1. Hospitals
- 8.3.2. Pharma & Biotech Companies
- 8.3.3. Clinical Laboratories
- 8.3.4. Others
- 8.1. Market Analysis, Insights and Forecast - by Type
- 9. Middle East and Africa Immunoassay Industry Analysis, Insights and Forecast, 2019-2031
- 9.1. Market Analysis, Insights and Forecast - by Type
- 9.1.1. Radioimmunoassay (RIA)
- 9.1.2. Enzyme Immunoassays (EIA)
- 9.1.3. Fluoroimmnoassay (FIA)
- 9.1.4. Chemiluminescence Immunoassay (CLIA)
- 9.1.5. Others
- 9.2. Market Analysis, Insights and Forecast - by Application
- 9.2.1. Disease Diagnosis
- 9.2.2. Therapeutic Drug Monitoring
- 9.2.3. Drug Discovery
- 9.2.4. Clinical Chemistry
- 9.2.5. Hematology
- 9.2.6. Others
- 9.3. Market Analysis, Insights and Forecast - by End User
- 9.3.1. Hospitals
- 9.3.2. Pharma & Biotech Companies
- 9.3.3. Clinical Laboratories
- 9.3.4. Others
- 9.1. Market Analysis, Insights and Forecast - by Type
- 10. South America Immunoassay Industry Analysis, Insights and Forecast, 2019-2031
- 10.1. Market Analysis, Insights and Forecast - by Type
- 10.1.1. Radioimmunoassay (RIA)
- 10.1.2. Enzyme Immunoassays (EIA)
- 10.1.3. Fluoroimmnoassay (FIA)
- 10.1.4. Chemiluminescence Immunoassay (CLIA)
- 10.1.5. Others
- 10.2. Market Analysis, Insights and Forecast - by Application
- 10.2.1. Disease Diagnosis
- 10.2.2. Therapeutic Drug Monitoring
- 10.2.3. Drug Discovery
- 10.2.4. Clinical Chemistry
- 10.2.5. Hematology
- 10.2.6. Others
- 10.3. Market Analysis, Insights and Forecast - by End User
- 10.3.1. Hospitals
- 10.3.2. Pharma & Biotech Companies
- 10.3.3. Clinical Laboratories
- 10.3.4. Others
- 10.1. Market Analysis, Insights and Forecast - by Type
- 11. North America Immunoassay Industry Analysis, Insights and Forecast, 2019-2031
- 11.1. Market Analysis, Insights and Forecast - By Country/Sub-region
- 11.1.1 United States
- 11.1.2 Canada
- 11.1.3 Mexico
- 12. Europe Immunoassay Industry Analysis, Insights and Forecast, 2019-2031
- 12.1. Market Analysis, Insights and Forecast - By Country/Sub-region
- 12.1.1 Germany
- 12.1.2 United Kingdom
- 12.1.3 France
- 12.1.4 Italy
- 12.1.5 Spain
- 12.1.6 Rest of Europe
- 13. Asia Pacific Immunoassay Industry Analysis, Insights and Forecast, 2019-2031
- 13.1. Market Analysis, Insights and Forecast - By Country/Sub-region
- 13.1.1 China
- 13.1.2 Japan
- 13.1.3 India
- 13.1.4 Australia
- 13.1.5 South Korea
- 13.1.6 Rest of Asia Pacific
- 14. Middle East and Africa Immunoassay Industry Analysis, Insights and Forecast, 2019-2031
- 14.1. Market Analysis, Insights and Forecast - By Country/Sub-region
- 14.1.1 GCC
- 14.1.2 South Africa
- 14.1.3 Rest of Middle East and Africa
- 15. South America Immunoassay Industry Analysis, Insights and Forecast, 2019-2031
- 15.1. Market Analysis, Insights and Forecast - By Country/Sub-region
- 15.1.1 Brazil
- 15.1.2 Argentina
- 15.1.3 Rest of South America
- 16. Competitive Analysis
- 16.1. Global Market Share Analysis 2024
- 16.2. Company Profiles
- 16.2.1 Becton Dickinson and Company
- 16.2.1.1. Overview
- 16.2.1.2. Products
- 16.2.1.3. SWOT Analysis
- 16.2.1.4. Recent Developments
- 16.2.1.5. Financials (Based on Availability)
- 16.2.2 Bio-Rad Laboratories Inc
- 16.2.2.1. Overview
- 16.2.2.2. Products
- 16.2.2.3. SWOT Analysis
- 16.2.2.4. Recent Developments
- 16.2.2.5. Financials (Based on Availability)
- 16.2.3 Hologic Inc
- 16.2.3.1. Overview
- 16.2.3.2. Products
- 16.2.3.3. SWOT Analysis
- 16.2.3.4. Recent Developments
- 16.2.3.5. Financials (Based on Availability)
- 16.2.4 Abbott Laboratories
- 16.2.4.1. Overview
- 16.2.4.2. Products
- 16.2.4.3. SWOT Analysis
- 16.2.4.4. Recent Developments
- 16.2.4.5. Financials (Based on Availability)
- 16.2.5 F Hoffmann-La Roche AG
- 16.2.5.1. Overview
- 16.2.5.2. Products
- 16.2.5.3. SWOT Analysis
- 16.2.5.4. Recent Developments
- 16.2.5.5. Financials (Based on Availability)
- 16.2.6 Agilent Technologies Inc
- 16.2.6.1. Overview
- 16.2.6.2. Products
- 16.2.6.3. SWOT Analysis
- 16.2.6.4. Recent Developments
- 16.2.6.5. Financials (Based on Availability)
- 16.2.7 Danaher Corporation (Beckman Coulter Inc)
- 16.2.7.1. Overview
- 16.2.7.2. Products
- 16.2.7.3. SWOT Analysis
- 16.2.7.4. Recent Developments
- 16.2.7.5. Financials (Based on Availability)
- 16.2.8 Qiagen NV
- 16.2.8.1. Overview
- 16.2.8.2. Products
- 16.2.8.3. SWOT Analysis
- 16.2.8.4. Recent Developments
- 16.2.8.5. Financials (Based on Availability)
- 16.2.9 Sysmex Corporation
- 16.2.9.1. Overview
- 16.2.9.2. Products
- 16.2.9.3. SWOT Analysis
- 16.2.9.4. Recent Developments
- 16.2.9.5. Financials (Based on Availability)
- 16.2.10 Thermo Fisher Scientific
- 16.2.10.1. Overview
- 16.2.10.2. Products
- 16.2.10.3. SWOT Analysis
- 16.2.10.4. Recent Developments
- 16.2.10.5. Financials (Based on Availability)
- 16.2.11 Luminex Corporation
- 16.2.11.1. Overview
- 16.2.11.2. Products
- 16.2.11.3. SWOT Analysis
- 16.2.11.4. Recent Developments
- 16.2.11.5. Financials (Based on Availability)
- 16.2.12 PerkinElmer Inc
- 16.2.12.1. Overview
- 16.2.12.2. Products
- 16.2.12.3. SWOT Analysis
- 16.2.12.4. Recent Developments
- 16.2.12.5. Financials (Based on Availability)
- 16.2.1 Becton Dickinson and Company
List of Figures
- Figure 1: Global Immunoassay Industry Revenue Breakdown (Million, %) by Region 2024 & 2032
- Figure 2: Global Immunoassay Industry Volume Breakdown (K Unit, %) by Region 2024 & 2032
- Figure 3: North America Immunoassay Industry Revenue (Million), by Country 2024 & 2032
- Figure 4: North America Immunoassay Industry Volume (K Unit), by Country 2024 & 2032
- Figure 5: North America Immunoassay Industry Revenue Share (%), by Country 2024 & 2032
- Figure 6: North America Immunoassay Industry Volume Share (%), by Country 2024 & 2032
- Figure 7: Europe Immunoassay Industry Revenue (Million), by Country 2024 & 2032
- Figure 8: Europe Immunoassay Industry Volume (K Unit), by Country 2024 & 2032
- Figure 9: Europe Immunoassay Industry Revenue Share (%), by Country 2024 & 2032
- Figure 10: Europe Immunoassay Industry Volume Share (%), by Country 2024 & 2032
- Figure 11: Asia Pacific Immunoassay Industry Revenue (Million), by Country 2024 & 2032
- Figure 12: Asia Pacific Immunoassay Industry Volume (K Unit), by Country 2024 & 2032
- Figure 13: Asia Pacific Immunoassay Industry Revenue Share (%), by Country 2024 & 2032
- Figure 14: Asia Pacific Immunoassay Industry Volume Share (%), by Country 2024 & 2032
- Figure 15: Middle East and Africa Immunoassay Industry Revenue (Million), by Country 2024 & 2032
- Figure 16: Middle East and Africa Immunoassay Industry Volume (K Unit), by Country 2024 & 2032
- Figure 17: Middle East and Africa Immunoassay Industry Revenue Share (%), by Country 2024 & 2032
- Figure 18: Middle East and Africa Immunoassay Industry Volume Share (%), by Country 2024 & 2032
- Figure 19: South America Immunoassay Industry Revenue (Million), by Country 2024 & 2032
- Figure 20: South America Immunoassay Industry Volume (K Unit), by Country 2024 & 2032
- Figure 21: South America Immunoassay Industry Revenue Share (%), by Country 2024 & 2032
- Figure 22: South America Immunoassay Industry Volume Share (%), by Country 2024 & 2032
- Figure 23: North America Immunoassay Industry Revenue (Million), by Type 2024 & 2032
- Figure 24: North America Immunoassay Industry Volume (K Unit), by Type 2024 & 2032
- Figure 25: North America Immunoassay Industry Revenue Share (%), by Type 2024 & 2032
- Figure 26: North America Immunoassay Industry Volume Share (%), by Type 2024 & 2032
- Figure 27: North America Immunoassay Industry Revenue (Million), by Application 2024 & 2032
- Figure 28: North America Immunoassay Industry Volume (K Unit), by Application 2024 & 2032
- Figure 29: North America Immunoassay Industry Revenue Share (%), by Application 2024 & 2032
- Figure 30: North America Immunoassay Industry Volume Share (%), by Application 2024 & 2032
- Figure 31: North America Immunoassay Industry Revenue (Million), by End User 2024 & 2032
- Figure 32: North America Immunoassay Industry Volume (K Unit), by End User 2024 & 2032
- Figure 33: North America Immunoassay Industry Revenue Share (%), by End User 2024 & 2032
- Figure 34: North America Immunoassay Industry Volume Share (%), by End User 2024 & 2032
- Figure 35: North America Immunoassay Industry Revenue (Million), by Country 2024 & 2032
- Figure 36: North America Immunoassay Industry Volume (K Unit), by Country 2024 & 2032
- Figure 37: North America Immunoassay Industry Revenue Share (%), by Country 2024 & 2032
- Figure 38: North America Immunoassay Industry Volume Share (%), by Country 2024 & 2032
- Figure 39: Europe Immunoassay Industry Revenue (Million), by Type 2024 & 2032
- Figure 40: Europe Immunoassay Industry Volume (K Unit), by Type 2024 & 2032
- Figure 41: Europe Immunoassay Industry Revenue Share (%), by Type 2024 & 2032
- Figure 42: Europe Immunoassay Industry Volume Share (%), by Type 2024 & 2032
- Figure 43: Europe Immunoassay Industry Revenue (Million), by Application 2024 & 2032
- Figure 44: Europe Immunoassay Industry Volume (K Unit), by Application 2024 & 2032
- Figure 45: Europe Immunoassay Industry Revenue Share (%), by Application 2024 & 2032
- Figure 46: Europe Immunoassay Industry Volume Share (%), by Application 2024 & 2032
- Figure 47: Europe Immunoassay Industry Revenue (Million), by End User 2024 & 2032
- Figure 48: Europe Immunoassay Industry Volume (K Unit), by End User 2024 & 2032
- Figure 49: Europe Immunoassay Industry Revenue Share (%), by End User 2024 & 2032
- Figure 50: Europe Immunoassay Industry Volume Share (%), by End User 2024 & 2032
- Figure 51: Europe Immunoassay Industry Revenue (Million), by Country 2024 & 2032
- Figure 52: Europe Immunoassay Industry Volume (K Unit), by Country 2024 & 2032
- Figure 53: Europe Immunoassay Industry Revenue Share (%), by Country 2024 & 2032
- Figure 54: Europe Immunoassay Industry Volume Share (%), by Country 2024 & 2032
- Figure 55: Asia Pacific Immunoassay Industry Revenue (Million), by Type 2024 & 2032
- Figure 56: Asia Pacific Immunoassay Industry Volume (K Unit), by Type 2024 & 2032
- Figure 57: Asia Pacific Immunoassay Industry Revenue Share (%), by Type 2024 & 2032
- Figure 58: Asia Pacific Immunoassay Industry Volume Share (%), by Type 2024 & 2032
- Figure 59: Asia Pacific Immunoassay Industry Revenue (Million), by Application 2024 & 2032
- Figure 60: Asia Pacific Immunoassay Industry Volume (K Unit), by Application 2024 & 2032
- Figure 61: Asia Pacific Immunoassay Industry Revenue Share (%), by Application 2024 & 2032
- Figure 62: Asia Pacific Immunoassay Industry Volume Share (%), by Application 2024 & 2032
- Figure 63: Asia Pacific Immunoassay Industry Revenue (Million), by End User 2024 & 2032
- Figure 64: Asia Pacific Immunoassay Industry Volume (K Unit), by End User 2024 & 2032
- Figure 65: Asia Pacific Immunoassay Industry Revenue Share (%), by End User 2024 & 2032
- Figure 66: Asia Pacific Immunoassay Industry Volume Share (%), by End User 2024 & 2032
- Figure 67: Asia Pacific Immunoassay Industry Revenue (Million), by Country 2024 & 2032
- Figure 68: Asia Pacific Immunoassay Industry Volume (K Unit), by Country 2024 & 2032
- Figure 69: Asia Pacific Immunoassay Industry Revenue Share (%), by Country 2024 & 2032
- Figure 70: Asia Pacific Immunoassay Industry Volume Share (%), by Country 2024 & 2032
- Figure 71: Middle East and Africa Immunoassay Industry Revenue (Million), by Type 2024 & 2032
- Figure 72: Middle East and Africa Immunoassay Industry Volume (K Unit), by Type 2024 & 2032
- Figure 73: Middle East and Africa Immunoassay Industry Revenue Share (%), by Type 2024 & 2032
- Figure 74: Middle East and Africa Immunoassay Industry Volume Share (%), by Type 2024 & 2032
- Figure 75: Middle East and Africa Immunoassay Industry Revenue (Million), by Application 2024 & 2032
- Figure 76: Middle East and Africa Immunoassay Industry Volume (K Unit), by Application 2024 & 2032
- Figure 77: Middle East and Africa Immunoassay Industry Revenue Share (%), by Application 2024 & 2032
- Figure 78: Middle East and Africa Immunoassay Industry Volume Share (%), by Application 2024 & 2032
- Figure 79: Middle East and Africa Immunoassay Industry Revenue (Million), by End User 2024 & 2032
- Figure 80: Middle East and Africa Immunoassay Industry Volume (K Unit), by End User 2024 & 2032
- Figure 81: Middle East and Africa Immunoassay Industry Revenue Share (%), by End User 2024 & 2032
- Figure 82: Middle East and Africa Immunoassay Industry Volume Share (%), by End User 2024 & 2032
- Figure 83: Middle East and Africa Immunoassay Industry Revenue (Million), by Country 2024 & 2032
- Figure 84: Middle East and Africa Immunoassay Industry Volume (K Unit), by Country 2024 & 2032
- Figure 85: Middle East and Africa Immunoassay Industry Revenue Share (%), by Country 2024 & 2032
- Figure 86: Middle East and Africa Immunoassay Industry Volume Share (%), by Country 2024 & 2032
- Figure 87: South America Immunoassay Industry Revenue (Million), by Type 2024 & 2032
- Figure 88: South America Immunoassay Industry Volume (K Unit), by Type 2024 & 2032
- Figure 89: South America Immunoassay Industry Revenue Share (%), by Type 2024 & 2032
- Figure 90: South America Immunoassay Industry Volume Share (%), by Type 2024 & 2032
- Figure 91: South America Immunoassay Industry Revenue (Million), by Application 2024 & 2032
- Figure 92: South America Immunoassay Industry Volume (K Unit), by Application 2024 & 2032
- Figure 93: South America Immunoassay Industry Revenue Share (%), by Application 2024 & 2032
- Figure 94: South America Immunoassay Industry Volume Share (%), by Application 2024 & 2032
- Figure 95: South America Immunoassay Industry Revenue (Million), by End User 2024 & 2032
- Figure 96: South America Immunoassay Industry Volume (K Unit), by End User 2024 & 2032
- Figure 97: South America Immunoassay Industry Revenue Share (%), by End User 2024 & 2032
- Figure 98: South America Immunoassay Industry Volume Share (%), by End User 2024 & 2032
- Figure 99: South America Immunoassay Industry Revenue (Million), by Country 2024 & 2032
- Figure 100: South America Immunoassay Industry Volume (K Unit), by Country 2024 & 2032
- Figure 101: South America Immunoassay Industry Revenue Share (%), by Country 2024 & 2032
- Figure 102: South America Immunoassay Industry Volume Share (%), by Country 2024 & 2032
List of Tables
- Table 1: Global Immunoassay Industry Revenue Million Forecast, by Region 2019 & 2032
- Table 2: Global Immunoassay Industry Volume K Unit Forecast, by Region 2019 & 2032
- Table 3: Global Immunoassay Industry Revenue Million Forecast, by Type 2019 & 2032
- Table 4: Global Immunoassay Industry Volume K Unit Forecast, by Type 2019 & 2032
- Table 5: Global Immunoassay Industry Revenue Million Forecast, by Application 2019 & 2032
- Table 6: Global Immunoassay Industry Volume K Unit Forecast, by Application 2019 & 2032
- Table 7: Global Immunoassay Industry Revenue Million Forecast, by End User 2019 & 2032
- Table 8: Global Immunoassay Industry Volume K Unit Forecast, by End User 2019 & 2032
- Table 9: Global Immunoassay Industry Revenue Million Forecast, by Region 2019 & 2032
- Table 10: Global Immunoassay Industry Volume K Unit Forecast, by Region 2019 & 2032
- Table 11: Global Immunoassay Industry Revenue Million Forecast, by Country 2019 & 2032
- Table 12: Global Immunoassay Industry Volume K Unit Forecast, by Country 2019 & 2032
- Table 13: United States Immunoassay Industry Revenue (Million) Forecast, by Application 2019 & 2032
- Table 14: United States Immunoassay Industry Volume (K Unit) Forecast, by Application 2019 & 2032
- Table 15: Canada Immunoassay Industry Revenue (Million) Forecast, by Application 2019 & 2032
- Table 16: Canada Immunoassay Industry Volume (K Unit) Forecast, by Application 2019 & 2032
- Table 17: Mexico Immunoassay Industry Revenue (Million) Forecast, by Application 2019 & 2032
- Table 18: Mexico Immunoassay Industry Volume (K Unit) Forecast, by Application 2019 & 2032
- Table 19: Global Immunoassay Industry Revenue Million Forecast, by Country 2019 & 2032
- Table 20: Global Immunoassay Industry Volume K Unit Forecast, by Country 2019 & 2032
- Table 21: Germany Immunoassay Industry Revenue (Million) Forecast, by Application 2019 & 2032
- Table 22: Germany Immunoassay Industry Volume (K Unit) Forecast, by Application 2019 & 2032
- Table 23: United Kingdom Immunoassay Industry Revenue (Million) Forecast, by Application 2019 & 2032
- Table 24: United Kingdom Immunoassay Industry Volume (K Unit) Forecast, by Application 2019 & 2032
- Table 25: France Immunoassay Industry Revenue (Million) Forecast, by Application 2019 & 2032
- Table 26: France Immunoassay Industry Volume (K Unit) Forecast, by Application 2019 & 2032
- Table 27: Italy Immunoassay Industry Revenue (Million) Forecast, by Application 2019 & 2032
- Table 28: Italy Immunoassay Industry Volume (K Unit) Forecast, by Application 2019 & 2032
- Table 29: Spain Immunoassay Industry Revenue (Million) Forecast, by Application 2019 & 2032
- Table 30: Spain Immunoassay Industry Volume (K Unit) Forecast, by Application 2019 & 2032
- Table 31: Rest of Europe Immunoassay Industry Revenue (Million) Forecast, by Application 2019 & 2032
- Table 32: Rest of Europe Immunoassay Industry Volume (K Unit) Forecast, by Application 2019 & 2032
- Table 33: Global Immunoassay Industry Revenue Million Forecast, by Country 2019 & 2032
- Table 34: Global Immunoassay Industry Volume K Unit Forecast, by Country 2019 & 2032
- Table 35: China Immunoassay Industry Revenue (Million) Forecast, by Application 2019 & 2032
- Table 36: China Immunoassay Industry Volume (K Unit) Forecast, by Application 2019 & 2032
- Table 37: Japan Immunoassay Industry Revenue (Million) Forecast, by Application 2019 & 2032
- Table 38: Japan Immunoassay Industry Volume (K Unit) Forecast, by Application 2019 & 2032
- Table 39: India Immunoassay Industry Revenue (Million) Forecast, by Application 2019 & 2032
- Table 40: India Immunoassay Industry Volume (K Unit) Forecast, by Application 2019 & 2032
- Table 41: Australia Immunoassay Industry Revenue (Million) Forecast, by Application 2019 & 2032
- Table 42: Australia Immunoassay Industry Volume (K Unit) Forecast, by Application 2019 & 2032
- Table 43: South Korea Immunoassay Industry Revenue (Million) Forecast, by Application 2019 & 2032
- Table 44: South Korea Immunoassay Industry Volume (K Unit) Forecast, by Application 2019 & 2032
- Table 45: Rest of Asia Pacific Immunoassay Industry Revenue (Million) Forecast, by Application 2019 & 2032
- Table 46: Rest of Asia Pacific Immunoassay Industry Volume (K Unit) Forecast, by Application 2019 & 2032
- Table 47: Global Immunoassay Industry Revenue Million Forecast, by Country 2019 & 2032
- Table 48: Global Immunoassay Industry Volume K Unit Forecast, by Country 2019 & 2032
- Table 49: GCC Immunoassay Industry Revenue (Million) Forecast, by Application 2019 & 2032
- Table 50: GCC Immunoassay Industry Volume (K Unit) Forecast, by Application 2019 & 2032
- Table 51: South Africa Immunoassay Industry Revenue (Million) Forecast, by Application 2019 & 2032
- Table 52: South Africa Immunoassay Industry Volume (K Unit) Forecast, by Application 2019 & 2032
- Table 53: Rest of Middle East and Africa Immunoassay Industry Revenue (Million) Forecast, by Application 2019 & 2032
- Table 54: Rest of Middle East and Africa Immunoassay Industry Volume (K Unit) Forecast, by Application 2019 & 2032
- Table 55: Global Immunoassay Industry Revenue Million Forecast, by Country 2019 & 2032
- Table 56: Global Immunoassay Industry Volume K Unit Forecast, by Country 2019 & 2032
- Table 57: Brazil Immunoassay Industry Revenue (Million) Forecast, by Application 2019 & 2032
- Table 58: Brazil Immunoassay Industry Volume (K Unit) Forecast, by Application 2019 & 2032
- Table 59: Argentina Immunoassay Industry Revenue (Million) Forecast, by Application 2019 & 2032
- Table 60: Argentina Immunoassay Industry Volume (K Unit) Forecast, by Application 2019 & 2032
- Table 61: Rest of South America Immunoassay Industry Revenue (Million) Forecast, by Application 2019 & 2032
- Table 62: Rest of South America Immunoassay Industry Volume (K Unit) Forecast, by Application 2019 & 2032
- Table 63: Global Immunoassay Industry Revenue Million Forecast, by Type 2019 & 2032
- Table 64: Global Immunoassay Industry Volume K Unit Forecast, by Type 2019 & 2032
- Table 65: Global Immunoassay Industry Revenue Million Forecast, by Application 2019 & 2032
- Table 66: Global Immunoassay Industry Volume K Unit Forecast, by Application 2019 & 2032
- Table 67: Global Immunoassay Industry Revenue Million Forecast, by End User 2019 & 2032
- Table 68: Global Immunoassay Industry Volume K Unit Forecast, by End User 2019 & 2032
- Table 69: Global Immunoassay Industry Revenue Million Forecast, by Country 2019 & 2032
- Table 70: Global Immunoassay Industry Volume K Unit Forecast, by Country 2019 & 2032
- Table 71: United States Immunoassay Industry Revenue (Million) Forecast, by Application 2019 & 2032
- Table 72: United States Immunoassay Industry Volume (K Unit) Forecast, by Application 2019 & 2032
- Table 73: Canada Immunoassay Industry Revenue (Million) Forecast, by Application 2019 & 2032
- Table 74: Canada Immunoassay Industry Volume (K Unit) Forecast, by Application 2019 & 2032
- Table 75: Mexico Immunoassay Industry Revenue (Million) Forecast, by Application 2019 & 2032
- Table 76: Mexico Immunoassay Industry Volume (K Unit) Forecast, by Application 2019 & 2032
- Table 77: Global Immunoassay Industry Revenue Million Forecast, by Type 2019 & 2032
- Table 78: Global Immunoassay Industry Volume K Unit Forecast, by Type 2019 & 2032
- Table 79: Global Immunoassay Industry Revenue Million Forecast, by Application 2019 & 2032
- Table 80: Global Immunoassay Industry Volume K Unit Forecast, by Application 2019 & 2032
- Table 81: Global Immunoassay Industry Revenue Million Forecast, by End User 2019 & 2032
- Table 82: Global Immunoassay Industry Volume K Unit Forecast, by End User 2019 & 2032
- Table 83: Global Immunoassay Industry Revenue Million Forecast, by Country 2019 & 2032
- Table 84: Global Immunoassay Industry Volume K Unit Forecast, by Country 2019 & 2032
- Table 85: Germany Immunoassay Industry Revenue (Million) Forecast, by Application 2019 & 2032
- Table 86: Germany Immunoassay Industry Volume (K Unit) Forecast, by Application 2019 & 2032
- Table 87: United Kingdom Immunoassay Industry Revenue (Million) Forecast, by Application 2019 & 2032
- Table 88: United Kingdom Immunoassay Industry Volume (K Unit) Forecast, by Application 2019 & 2032
- Table 89: France Immunoassay Industry Revenue (Million) Forecast, by Application 2019 & 2032
- Table 90: France Immunoassay Industry Volume (K Unit) Forecast, by Application 2019 & 2032
- Table 91: Italy Immunoassay Industry Revenue (Million) Forecast, by Application 2019 & 2032
- Table 92: Italy Immunoassay Industry Volume (K Unit) Forecast, by Application 2019 & 2032
- Table 93: Spain Immunoassay Industry Revenue (Million) Forecast, by Application 2019 & 2032
- Table 94: Spain Immunoassay Industry Volume (K Unit) Forecast, by Application 2019 & 2032
- Table 95: Rest of Europe Immunoassay Industry Revenue (Million) Forecast, by Application 2019 & 2032
- Table 96: Rest of Europe Immunoassay Industry Volume (K Unit) Forecast, by Application 2019 & 2032
- Table 97: Global Immunoassay Industry Revenue Million Forecast, by Type 2019 & 2032
- Table 98: Global Immunoassay Industry Volume K Unit Forecast, by Type 2019 & 2032
- Table 99: Global Immunoassay Industry Revenue Million Forecast, by Application 2019 & 2032
- Table 100: Global Immunoassay Industry Volume K Unit Forecast, by Application 2019 & 2032
- Table 101: Global Immunoassay Industry Revenue Million Forecast, by End User 2019 & 2032
- Table 102: Global Immunoassay Industry Volume K Unit Forecast, by End User 2019 & 2032
- Table 103: Global Immunoassay Industry Revenue Million Forecast, by Country 2019 & 2032
- Table 104: Global Immunoassay Industry Volume K Unit Forecast, by Country 2019 & 2032
- Table 105: China Immunoassay Industry Revenue (Million) Forecast, by Application 2019 & 2032
- Table 106: China Immunoassay Industry Volume (K Unit) Forecast, by Application 2019 & 2032
- Table 107: Japan Immunoassay Industry Revenue (Million) Forecast, by Application 2019 & 2032
- Table 108: Japan Immunoassay Industry Volume (K Unit) Forecast, by Application 2019 & 2032
- Table 109: India Immunoassay Industry Revenue (Million) Forecast, by Application 2019 & 2032
- Table 110: India Immunoassay Industry Volume (K Unit) Forecast, by Application 2019 & 2032
- Table 111: Australia Immunoassay Industry Revenue (Million) Forecast, by Application 2019 & 2032
- Table 112: Australia Immunoassay Industry Volume (K Unit) Forecast, by Application 2019 & 2032
- Table 113: South Korea Immunoassay Industry Revenue (Million) Forecast, by Application 2019 & 2032
- Table 114: South Korea Immunoassay Industry Volume (K Unit) Forecast, by Application 2019 & 2032
- Table 115: Rest of Asia Pacific Immunoassay Industry Revenue (Million) Forecast, by Application 2019 & 2032
- Table 116: Rest of Asia Pacific Immunoassay Industry Volume (K Unit) Forecast, by Application 2019 & 2032
- Table 117: Global Immunoassay Industry Revenue Million Forecast, by Type 2019 & 2032
- Table 118: Global Immunoassay Industry Volume K Unit Forecast, by Type 2019 & 2032
- Table 119: Global Immunoassay Industry Revenue Million Forecast, by Application 2019 & 2032
- Table 120: Global Immunoassay Industry Volume K Unit Forecast, by Application 2019 & 2032
- Table 121: Global Immunoassay Industry Revenue Million Forecast, by End User 2019 & 2032
- Table 122: Global Immunoassay Industry Volume K Unit Forecast, by End User 2019 & 2032
- Table 123: Global Immunoassay Industry Revenue Million Forecast, by Country 2019 & 2032
- Table 124: Global Immunoassay Industry Volume K Unit Forecast, by Country 2019 & 2032
- Table 125: GCC Immunoassay Industry Revenue (Million) Forecast, by Application 2019 & 2032
- Table 126: GCC Immunoassay Industry Volume (K Unit) Forecast, by Application 2019 & 2032
- Table 127: South Africa Immunoassay Industry Revenue (Million) Forecast, by Application 2019 & 2032
- Table 128: South Africa Immunoassay Industry Volume (K Unit) Forecast, by Application 2019 & 2032
- Table 129: Rest of Middle East and Africa Immunoassay Industry Revenue (Million) Forecast, by Application 2019 & 2032
- Table 130: Rest of Middle East and Africa Immunoassay Industry Volume (K Unit) Forecast, by Application 2019 & 2032
- Table 131: Global Immunoassay Industry Revenue Million Forecast, by Type 2019 & 2032
- Table 132: Global Immunoassay Industry Volume K Unit Forecast, by Type 2019 & 2032
- Table 133: Global Immunoassay Industry Revenue Million Forecast, by Application 2019 & 2032
- Table 134: Global Immunoassay Industry Volume K Unit Forecast, by Application 2019 & 2032
- Table 135: Global Immunoassay Industry Revenue Million Forecast, by End User 2019 & 2032
- Table 136: Global Immunoassay Industry Volume K Unit Forecast, by End User 2019 & 2032
- Table 137: Global Immunoassay Industry Revenue Million Forecast, by Country 2019 & 2032
- Table 138: Global Immunoassay Industry Volume K Unit Forecast, by Country 2019 & 2032
- Table 139: Brazil Immunoassay Industry Revenue (Million) Forecast, by Application 2019 & 2032
- Table 140: Brazil Immunoassay Industry Volume (K Unit) Forecast, by Application 2019 & 2032
- Table 141: Argentina Immunoassay Industry Revenue (Million) Forecast, by Application 2019 & 2032
- Table 142: Argentina Immunoassay Industry Volume (K Unit) Forecast, by Application 2019 & 2032
- Table 143: Rest of South America Immunoassay Industry Revenue (Million) Forecast, by Application 2019 & 2032
- Table 144: Rest of South America Immunoassay Industry Volume (K Unit) Forecast, by Application 2019 & 2032
Frequently Asked Questions
1. What is the projected Compound Annual Growth Rate (CAGR) of the Immunoassay Industry?
The projected CAGR is approximately 7.70%.
2. Which companies are prominent players in the Immunoassay Industry?
Key companies in the market include Becton Dickinson and Company, Bio-Rad Laboratories Inc, Hologic Inc, Abbott Laboratories, F Hoffmann-La Roche AG, Agilent Technologies Inc, Danaher Corporation (Beckman Coulter Inc), Qiagen NV, Sysmex Corporation, Thermo Fisher Scientific, Luminex Corporation, PerkinElmer Inc .
3. What are the main segments of the Immunoassay Industry?
The market segments include Type, Application, End User.
4. Can you provide details about the market size?
The market size is estimated to be USD XX Million as of 2022.
5. What are some drivers contributing to market growth?
High Sensitivity and Specificity of Immunoassays; Technological Advancements in Immunoassay Instruments; Increasing Prevalence of Chronic and Infectious Diseases.
6. What are the notable trends driving market growth?
Enzyme Immunoassays (EIA) Segment is Expected to Hold Significant Market Share in Immunoassay Market.
7. Are there any restraints impacting market growth?
Stringent Regulatory Scenario for Approval of Immunoassays; Complexity of Procedures.
8. Can you provide examples of recent developments in the market?
In November 2022, Getein launched MAGICL 6000 CLIA analyzer at MEDICA 2022. MAGICL 6000 is a compact and innovative CLIA analyzer, with optimal choice for mid to high-workflow laboratories that require a one-step CLIA solution.
9. What pricing options are available for accessing the report?
Pricing options include single-user, multi-user, and enterprise licenses priced at USD 4750, USD 5250, and USD 8750 respectively.
10. Is the market size provided in terms of value or volume?
The market size is provided in terms of value, measured in Million and volume, measured in K Unit.
11. Are there any specific market keywords associated with the report?
Yes, the market keyword associated with the report is "Immunoassay Industry," which aids in identifying and referencing the specific market segment covered.
12. How do I determine which pricing option suits my needs best?
The pricing options vary based on user requirements and access needs. Individual users may opt for single-user licenses, while businesses requiring broader access may choose multi-user or enterprise licenses for cost-effective access to the report.
13. Are there any additional resources or data provided in the Immunoassay Industry report?
While the report offers comprehensive insights, it's advisable to review the specific contents or supplementary materials provided to ascertain if additional resources or data are available.
14. How can I stay updated on further developments or reports in the Immunoassay Industry?
To stay informed about further developments, trends, and reports in the Immunoassay Industry, consider subscribing to industry newsletters, following relevant companies and organizations, or regularly checking reputable industry news sources and publications.
Methodology
Step 1 - Identification of Relevant Samples Size from Population Database


Step 2 - Approaches for Defining Global Market Size (Value, Volume* & Price*)

Note*: In applicable scenarios
Step 3 - Data Sources
Primary Research
- Web Analytics
- Survey Reports
- Research Institute
- Latest Research Reports
- Opinion Leaders
Secondary Research
- Annual Reports
- White Paper
- Latest Press Release
- Industry Association
- Paid Database
- Investor Presentations

Step 4 - Data Triangulation
Involves using different sources of information in order to increase the validity of a study
These sources are likely to be stakeholders in a program - participants, other researchers, program staff, other community members, and so on.
Then we put all data in single framework & apply various statistical tools to find out the dynamic on the market.
During the analysis stage, feedback from the stakeholder groups would be compared to determine areas of agreement as well as areas of divergence


