

Key Insights
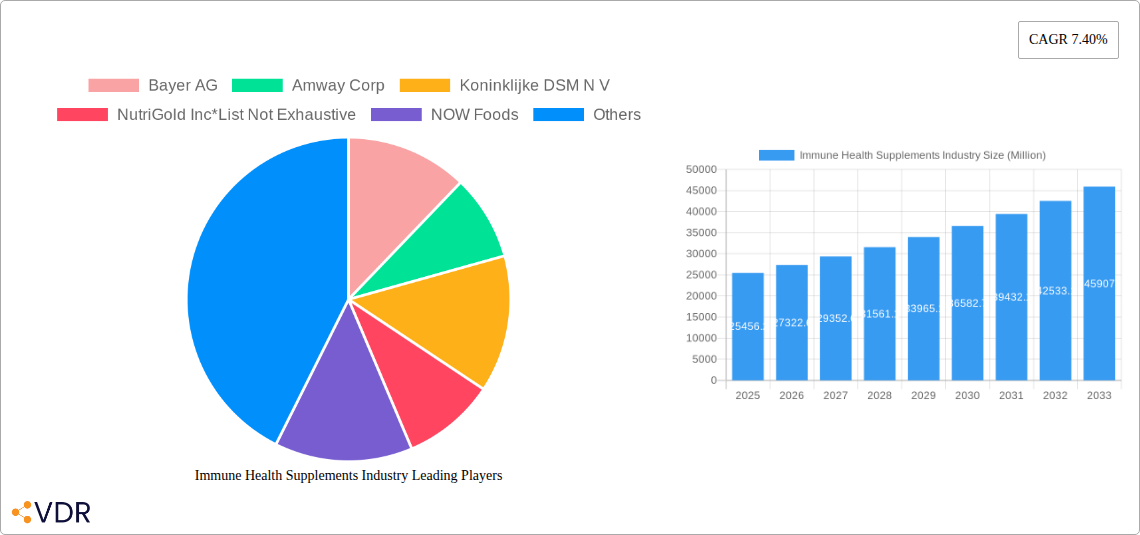
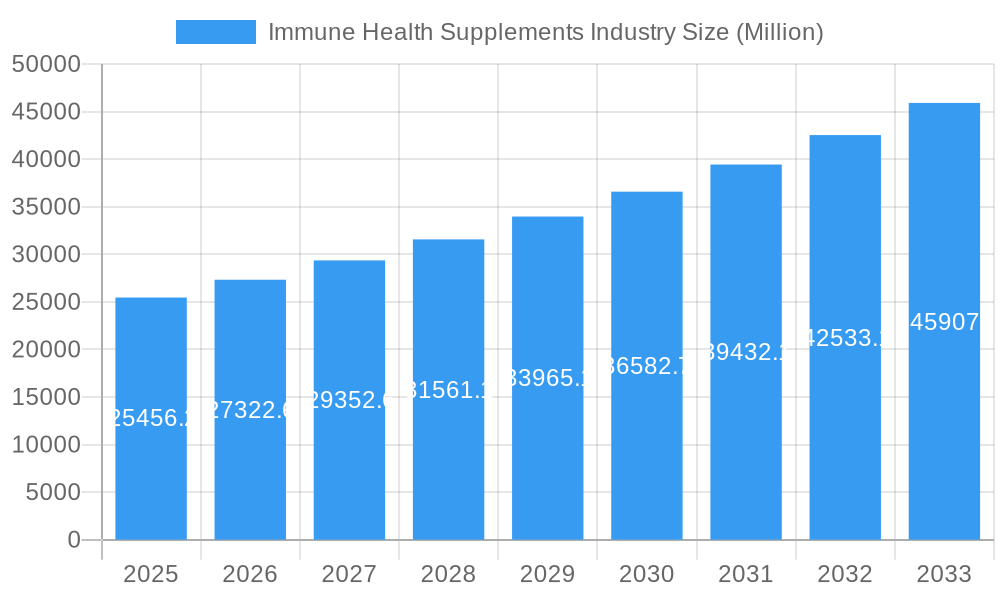
The global immune health supplements market, valued at $25.4562 billion in 2025, is projected to experience robust growth, driven by increasing health consciousness, rising prevalence of chronic diseases, and growing demand for natural and preventative healthcare solutions. The market's Compound Annual Growth Rate (CAGR) of 7.40% from 2019 to 2024 indicates a consistent upward trajectory, expected to continue throughout the forecast period (2025-2033). Key growth drivers include the escalating incidence of immune-compromising conditions like autoimmune diseases and respiratory infections, alongside a rising preference for convenient and effective supplement formats such as soft gels and tablets. The market is segmented by product type (vitamins & minerals, herbal/botanical extracts, amino acids, probiotics, omega-3 fatty acids), source (animal-based, plant-based), format (soft gels, tablets, powder, liquid), and distribution channel (supermarkets, pharmacies, online retail). While the North American market currently holds a significant share, Asia-Pacific is poised for substantial growth fueled by expanding middle classes and increased awareness of health and wellness. The presence of established players like Bayer AG, Amway Corp, and DSM N.V., alongside a competitive landscape of smaller, specialized brands, contributes to market dynamism and innovation.
Immune Health Supplements Industry Market Size (In Billion)
This growth is also influenced by evolving consumer preferences towards personalized nutrition and functional foods. The increasing integration of technology and data analytics in the development and marketing of immune health supplements further contributes to market expansion. However, potential market restraints include concerns about supplement safety and efficacy, stringent regulatory frameworks, and the fluctuating prices of raw materials. The market's future hinges on the continued development of innovative products, targeted marketing strategies, and a strong focus on consumer education to build trust and promote responsible supplement use. Companies are increasingly focusing on research and development to create highly effective and scientifically-backed immune health products, ensuring their continued relevance and appeal.
Immune Health Supplements Industry Company Market Share
Immune Health Supplements Industry Market Report: 2019-2033
This comprehensive report provides an in-depth analysis of the global immune health supplements market, covering the period 2019-2033. It delves into market dynamics, growth trends, regional performance, key players, and future outlook, offering valuable insights for industry professionals, investors, and stakeholders. The report segments the market by product type (Vitamins & Minerals, Herbal/Botanical Extracts, Amino Acids, Probiotics, Omega-3 Fatty Acids), source (Animal Based, Plant Based), format (Soft Gels, Tablets, Powder, Liquid), and distribution channel (Supermarkets and Hypermarkets, Convenience Stores, Pharmacies & drug stores, Online Retail, Others). The parent market is the broader dietary supplements market, while the child market encompasses specific immune-boosting products. The market size is presented in Million units.
Study Period: 2019-2033; Base Year: 2025; Estimated Year: 2025; Forecast Period: 2025-2033; Historical Period: 2019-2024
Immune Health Supplements Industry Market Dynamics & Structure
The global immune health supplements market is characterized by moderate concentration, with several major players holding significant market share. The market size in 2025 is estimated at xx Million units, projected to reach xx Million units by 2033. Technological innovation, particularly in delivery systems and ingredient sourcing, is a key driver. Stringent regulatory frameworks, especially concerning ingredient safety and labeling, influence market dynamics. Competition from functional foods and beverages offering similar benefits presents a challenge. Consumer demographics, including age, health awareness, and income levels, significantly influence market demand. M&A activity within the sector has been steady, with xx major deals recorded between 2019 and 2024, reflecting consolidation and expansion strategies.
- Market Concentration: Moderately concentrated, with top 5 players holding approximately xx% market share in 2025.
- Technological Innovation: Focus on novel delivery systems (e.g., liposomal encapsulation), personalized formulations, and sustainable sourcing.
- Regulatory Framework: Stringent regulations regarding ingredient safety and labeling in major markets create barriers to entry and compliance costs.
- Competitive Substitutes: Functional foods, beverages, and other health products offer similar immune-boosting benefits, posing competitive pressure.
- End-User Demographics: Growing health consciousness among aging populations and increasing disposable incomes are key drivers.
- M&A Trends: Steady M&A activity driven by expansion into new markets and product lines, and integration of innovative technologies.
Immune Health Supplements Industry Growth Trends & Insights
The immune health supplements market has experienced significant growth during the historical period (2019-2024), driven by increasing consumer awareness of immune health and the rising prevalence of chronic diseases. The market exhibited a CAGR of xx% during this period. Technological advancements, such as improved extraction methods for herbal extracts and the development of more bioavailable formulations, have fuelled market expansion. Changes in consumer behavior, such as increased online purchasing and a preference for natural and organic products, have also impacted market growth. The adoption rate of immune health supplements is increasing, particularly among health-conscious consumers. Disruptive technologies, including personalized nutrition and microbiome-based supplements, are expected to reshape the market landscape in the forecast period. Market penetration is expected to reach xx% by 2033, driven by rising consumer awareness and product innovation.
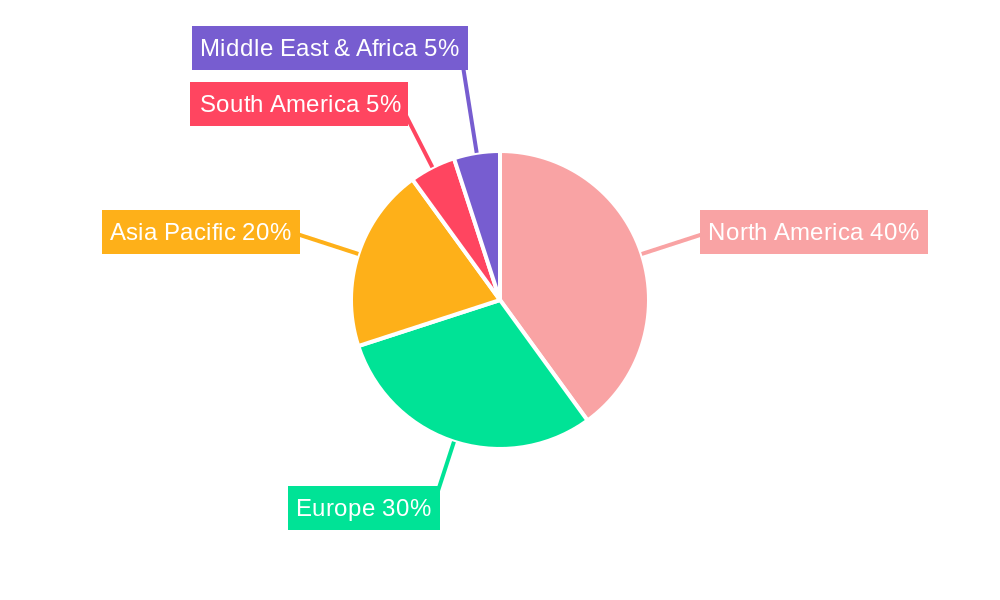
Dominant Regions, Countries, or Segments in Immune Health Supplements Industry
North America currently holds the largest market share, followed by Europe and Asia-Pacific. Within product types, Vitamins & Minerals dominate, accounting for approximately xx% of the market in 2025. Plant-based sources are increasingly preferred over animal-based options, driven by consumer demand for vegan and vegetarian products. Tablets and capsules remain the dominant formats, while the demand for convenient formats like powders and liquids is growing. Online retail channels are experiencing rapid growth, while traditional channels like pharmacies and supermarkets continue to hold significant market share.
Key Drivers:
- North America: High health awareness and disposable incomes.
- Europe: Growing adoption of functional foods and supplements.
- Asia-Pacific: Rising middle class and increasing health concerns.
- Vitamins & Minerals: Established efficacy and widespread availability.
- Plant-based: Growing consumer preference for natural and sustainable products.
- Online Retail: Convenience and wider product selection.
Dominance Factors: Market share, growth potential, regulatory environment, consumer preferences, and infrastructure development are key factors influencing regional and segment dominance.
Immune Health Supplements Industry Product Landscape
The immune health supplements market features a wide range of products with varying formulations and functionalities. Innovation focuses on enhanced bioavailability, targeted immune support (e.g., specific immune cells), and personalized formulations. Products are marketed based on their unique selling propositions (USPs), including ingredients, efficacy, and convenience. Technological advancements in ingredient extraction, encapsulation, and delivery systems are continually improving product performance.
Key Drivers, Barriers & Challenges in Immune Health Supplements Industry
Key Drivers:
- Increasing prevalence of chronic diseases and infectious illnesses
- Rising health awareness and consumer demand for preventive healthcare
- Technological advancements improving product efficacy and bioavailability
- Government initiatives promoting health and wellness
Key Challenges & Restraints:
- Stringent regulations regarding ingredient safety and labeling creating compliance barriers
- Competition from functional foods and other health products reducing market share
- Supply chain vulnerabilities affecting product availability and cost
- Fluctuating raw material prices increasing production costs
Emerging Opportunities in Immune Health Supplements Industry
Emerging opportunities include the development of personalized immune support products, leveraging genomics and microbiome data. Untapped markets in developing economies present significant growth potential. Innovative delivery systems, such as targeted drug delivery, offer improved efficacy. Evolving consumer preferences for natural, sustainable, and transparent products create opportunities for brands emphasizing these aspects.
Growth Accelerators in the Immune Health Supplements Industry
Technological advancements, such as personalized nutrition and microbiome-based supplements, are key growth drivers. Strategic partnerships between supplement manufacturers and healthcare providers can expand market reach and credibility. Expansion into emerging markets and the development of novel product formulations enhance market growth potential.
Key Players Shaping the Immune Health Supplements Industry Market
- Bayer AG
- Amway Corp
- Koninklijke DSM N V
- NutriGold Inc
- NOW Foods
- Glanbia Plc
- The Himalayan Drug Company
Notable Milestones in Immune Health Supplements Industry Sector
- 2020: Launch of several novel immune-supporting supplements incorporating emerging ingredients.
- 2021: Increased regulatory scrutiny of supplement labeling and claims.
- 2022: Several significant M&A activities consolidate market players.
- 2023: Emergence of personalized immune health solutions.
- 2024: Growth of online retail channels for immune health supplements.
In-Depth Immune Health Supplements Industry Market Outlook
The immune health supplements market is poised for continued growth, driven by technological advancements, increasing consumer awareness, and expansion into new markets. Strategic partnerships, product innovation, and robust supply chains will be crucial for success in this dynamic market. The long-term outlook is positive, with substantial growth potential in emerging economies and among specific demographic groups.
Immune Health Supplements Industry Segmentation
-
1. Product Type
- 1.1. Vitamins & Minerals
- 1.2. Herbal/Botanical Extracts
- 1.3. Amino Acids
- 1.4. Probiotics
- 1.5. Omega-3 Fatty Acids
-
2. Source
- 2.1. Animal Based
- 2.2. Plant Based
-
3. Format
- 3.1. Soft Gels
- 3.2. Tablets
- 3.3. Powder
- 3.4. Liquid
-
4. Distribution Channel
- 4.1. Supermarkets and Hypermarkets
- 4.2. Convenience Stores
- 4.3. Pharmacies & drug stores
- 4.4. Online Retail
- 4.5. Others
Immune Health Supplements Industry Segmentation By Geography
-
1. North America
- 1.1. United States
- 1.2. Canada
- 1.3. Mexico
- 1.4. Rest of North America
-
2. Europe
- 2.1. United Kingdom
- 2.2. Germany
- 2.3. Spain
- 2.4. France
- 2.5. Italy
- 2.6. Russia
- 2.7. Rest of Europe
-
3. Asia Pacific
- 3.1. China
- 3.2. India
- 3.3. Japan
- 3.4. Australia
- 3.5. Rest of Asia Pacific
-
4. South America
- 4.1. Brazil
- 4.2. Argentina
- 4.3. Rest of South America
- 5. Middle East
-
6. South Africa
- 6.1. Saudi Arabia
- 6.2. Rest of Middle East
Immune Health Supplements Industry Regional Market Share
Geographic Coverage of Immune Health Supplements Industry
Immune Health Supplements Industry REPORT HIGHLIGHTS
| Aspects | Details |
|---|---|
| Study Period | 2020-2034 |
| Base Year | 2025 |
| Estimated Year | 2026 |
| Forecast Period | 2026-2034 |
| Historical Period | 2020-2025 |
| Growth Rate | CAGR of 7.40% from 2020-2034 |
| Segmentation |
|
Table of Contents
- 1. Introduction
- 1.1. Research Scope
- 1.2. Market Segmentation
- 1.3. Research Objective
- 1.4. Definitions and Assumptions
- 2. Executive Summary
- 2.1. Market Snapshot
- 3. Market Dynamics
- 3.1. Market Drivers
- 3.2. Market Restrains
- 3.3. Market Trends
- 3.4. Market Opportunities
- 4. Market Factor Analysis
- 4.1. Porters Five Forces
- 4.1.1. Bargaining Power of Suppliers
- 4.1.2. Bargaining Power of Buyers
- 4.1.3. Threat of New Entrants
- 4.1.4. Threat of Substitutes
- 4.1.5. Competitive Rivalry
- 4.2. PESTEL analysis
- 4.3. BCG Analysis
- 4.3.1. Stars (High Growth, High Market Share)
- 4.3.2. Cash Cows (Low Growth, High Market Share)
- 4.3.3. Question Mark (High Growth, Low Market Share)
- 4.3.4. Dogs (Low Growth, Low Market Share)
- 4.4. Ansoff Matrix Analysis
- 4.5. Supply Chain Analysis
- 4.6. Regulatory Landscape
- 4.7. Current Market Potential and Opportunity Assessment (TAM–SAM–SOM Framework)
- 4.8. VDR Analyst Note
- 4.1. Porters Five Forces
- 5. Market Analysis, Insights and Forecast 2021-2033
- 5.1. Market Analysis, Insights and Forecast - by Product Type
- 5.1.1. Vitamins & Minerals
- 5.1.2. Herbal/Botanical Extracts
- 5.1.3. Amino Acids
- 5.1.4. Probiotics
- 5.1.5. Omega-3 Fatty Acids
- 5.2. Market Analysis, Insights and Forecast - by Source
- 5.2.1. Animal Based
- 5.2.2. Plant Based
- 5.3. Market Analysis, Insights and Forecast - by Format
- 5.3.1. Soft Gels
- 5.3.2. Tablets
- 5.3.3. Powder
- 5.3.4. Liquid
- 5.4. Market Analysis, Insights and Forecast - by Distribution Channel
- 5.4.1. Supermarkets and Hypermarkets
- 5.4.2. Convenience Stores
- 5.4.3. Pharmacies & drug stores
- 5.4.4. Online Retail
- 5.4.5. Others
- 5.5. Market Analysis, Insights and Forecast - by Region
- 5.5.1. North America
- 5.5.2. Europe
- 5.5.3. Asia Pacific
- 5.5.4. South America
- 5.5.5. Middle East
- 5.5.6. South Africa
- 5.1. Market Analysis, Insights and Forecast - by Product Type
- 6. Global Immune Health Supplements Industry Analysis, Insights and Forecast, 2021-2033
- 6.1. Market Analysis, Insights and Forecast - by Product Type
- 6.1.1. Vitamins & Minerals
- 6.1.2. Herbal/Botanical Extracts
- 6.1.3. Amino Acids
- 6.1.4. Probiotics
- 6.1.5. Omega-3 Fatty Acids
- 6.2. Market Analysis, Insights and Forecast - by Source
- 6.2.1. Animal Based
- 6.2.2. Plant Based
- 6.3. Market Analysis, Insights and Forecast - by Format
- 6.3.1. Soft Gels
- 6.3.2. Tablets
- 6.3.3. Powder
- 6.3.4. Liquid
- 6.4. Market Analysis, Insights and Forecast - by Distribution Channel
- 6.4.1. Supermarkets and Hypermarkets
- 6.4.2. Convenience Stores
- 6.4.3. Pharmacies & drug stores
- 6.4.4. Online Retail
- 6.4.5. Others
- 6.1. Market Analysis, Insights and Forecast - by Product Type
- 7. North America Immune Health Supplements Industry Analysis, Insights and Forecast, 2021-2033
- 7.1. Market Analysis, Insights and Forecast - by Product Type
- 7.1.1. Vitamins & Minerals
- 7.1.2. Herbal/Botanical Extracts
- 7.1.3. Amino Acids
- 7.1.4. Probiotics
- 7.1.5. Omega-3 Fatty Acids
- 7.2. Market Analysis, Insights and Forecast - by Source
- 7.2.1. Animal Based
- 7.2.2. Plant Based
- 7.3. Market Analysis, Insights and Forecast - by Format
- 7.3.1. Soft Gels
- 7.3.2. Tablets
- 7.3.3. Powder
- 7.3.4. Liquid
- 7.4. Market Analysis, Insights and Forecast - by Distribution Channel
- 7.4.1. Supermarkets and Hypermarkets
- 7.4.2. Convenience Stores
- 7.4.3. Pharmacies & drug stores
- 7.4.4. Online Retail
- 7.4.5. Others
- 7.1. Market Analysis, Insights and Forecast - by Product Type
- 8. Europe Immune Health Supplements Industry Analysis, Insights and Forecast, 2021-2033
- 8.1. Market Analysis, Insights and Forecast - by Product Type
- 8.1.1. Vitamins & Minerals
- 8.1.2. Herbal/Botanical Extracts
- 8.1.3. Amino Acids
- 8.1.4. Probiotics
- 8.1.5. Omega-3 Fatty Acids
- 8.2. Market Analysis, Insights and Forecast - by Source
- 8.2.1. Animal Based
- 8.2.2. Plant Based
- 8.3. Market Analysis, Insights and Forecast - by Format
- 8.3.1. Soft Gels
- 8.3.2. Tablets
- 8.3.3. Powder
- 8.3.4. Liquid
- 8.4. Market Analysis, Insights and Forecast - by Distribution Channel
- 8.4.1. Supermarkets and Hypermarkets
- 8.4.2. Convenience Stores
- 8.4.3. Pharmacies & drug stores
- 8.4.4. Online Retail
- 8.4.5. Others
- 8.1. Market Analysis, Insights and Forecast - by Product Type
- 9. Asia Pacific Immune Health Supplements Industry Analysis, Insights and Forecast, 2021-2033
- 9.1. Market Analysis, Insights and Forecast - by Product Type
- 9.1.1. Vitamins & Minerals
- 9.1.2. Herbal/Botanical Extracts
- 9.1.3. Amino Acids
- 9.1.4. Probiotics
- 9.1.5. Omega-3 Fatty Acids
- 9.2. Market Analysis, Insights and Forecast - by Source
- 9.2.1. Animal Based
- 9.2.2. Plant Based
- 9.3. Market Analysis, Insights and Forecast - by Format
- 9.3.1. Soft Gels
- 9.3.2. Tablets
- 9.3.3. Powder
- 9.3.4. Liquid
- 9.4. Market Analysis, Insights and Forecast - by Distribution Channel
- 9.4.1. Supermarkets and Hypermarkets
- 9.4.2. Convenience Stores
- 9.4.3. Pharmacies & drug stores
- 9.4.4. Online Retail
- 9.4.5. Others
- 9.1. Market Analysis, Insights and Forecast - by Product Type
- 10. South America Immune Health Supplements Industry Analysis, Insights and Forecast, 2021-2033
- 10.1. Market Analysis, Insights and Forecast - by Product Type
- 10.1.1. Vitamins & Minerals
- 10.1.2. Herbal/Botanical Extracts
- 10.1.3. Amino Acids
- 10.1.4. Probiotics
- 10.1.5. Omega-3 Fatty Acids
- 10.2. Market Analysis, Insights and Forecast - by Source
- 10.2.1. Animal Based
- 10.2.2. Plant Based
- 10.3. Market Analysis, Insights and Forecast - by Format
- 10.3.1. Soft Gels
- 10.3.2. Tablets
- 10.3.3. Powder
- 10.3.4. Liquid
- 10.4. Market Analysis, Insights and Forecast - by Distribution Channel
- 10.4.1. Supermarkets and Hypermarkets
- 10.4.2. Convenience Stores
- 10.4.3. Pharmacies & drug stores
- 10.4.4. Online Retail
- 10.4.5. Others
- 10.1. Market Analysis, Insights and Forecast - by Product Type
- 11. Middle East Immune Health Supplements Industry Analysis, Insights and Forecast, 2021-2033
- 11.1. Market Analysis, Insights and Forecast - by Product Type
- 11.1.1. Vitamins & Minerals
- 11.1.2. Herbal/Botanical Extracts
- 11.1.3. Amino Acids
- 11.1.4. Probiotics
- 11.1.5. Omega-3 Fatty Acids
- 11.2. Market Analysis, Insights and Forecast - by Source
- 11.2.1. Animal Based
- 11.2.2. Plant Based
- 11.3. Market Analysis, Insights and Forecast - by Format
- 11.3.1. Soft Gels
- 11.3.2. Tablets
- 11.3.3. Powder
- 11.3.4. Liquid
- 11.4. Market Analysis, Insights and Forecast - by Distribution Channel
- 11.4.1. Supermarkets and Hypermarkets
- 11.4.2. Convenience Stores
- 11.4.3. Pharmacies & drug stores
- 11.4.4. Online Retail
- 11.4.5. Others
- 11.1. Market Analysis, Insights and Forecast - by Product Type
- 12. South Africa Immune Health Supplements Industry Analysis, Insights and Forecast, 2021-2033
- 12.1. Market Analysis, Insights and Forecast - by Product Type
- 12.1.1. Vitamins & Minerals
- 12.1.2. Herbal/Botanical Extracts
- 12.1.3. Amino Acids
- 12.1.4. Probiotics
- 12.1.5. Omega-3 Fatty Acids
- 12.2. Market Analysis, Insights and Forecast - by Source
- 12.2.1. Animal Based
- 12.2.2. Plant Based
- 12.3. Market Analysis, Insights and Forecast - by Format
- 12.3.1. Soft Gels
- 12.3.2. Tablets
- 12.3.3. Powder
- 12.3.4. Liquid
- 12.4. Market Analysis, Insights and Forecast - by Distribution Channel
- 12.4.1. Supermarkets and Hypermarkets
- 12.4.2. Convenience Stores
- 12.4.3. Pharmacies & drug stores
- 12.4.4. Online Retail
- 12.4.5. Others
- 12.1. Market Analysis, Insights and Forecast - by Product Type
- 13. Competitive Analysis
- 13.1. Company Profiles
- 13.1.1 Bayer AG
- 13.1.1.1. Company Overview
- 13.1.1.2. Products
- 13.1.1.3. Company Financials
- 13.1.1.4. SWOT Analysis
- 13.1.2 Amway Corp
- 13.1.2.1. Company Overview
- 13.1.2.2. Products
- 13.1.2.3. Company Financials
- 13.1.2.4. SWOT Analysis
- 13.1.3 Koninklijke DSM N V
- 13.1.3.1. Company Overview
- 13.1.3.2. Products
- 13.1.3.3. Company Financials
- 13.1.3.4. SWOT Analysis
- 13.1.4 NutriGold Inc*List Not Exhaustive
- 13.1.4.1. Company Overview
- 13.1.4.2. Products
- 13.1.4.3. Company Financials
- 13.1.4.4. SWOT Analysis
- 13.1.5 NOW Foods
- 13.1.5.1. Company Overview
- 13.1.5.2. Products
- 13.1.5.3. Company Financials
- 13.1.5.4. SWOT Analysis
- 13.1.6 Glanbia Plc
- 13.1.6.1. Company Overview
- 13.1.6.2. Products
- 13.1.6.3. Company Financials
- 13.1.6.4. SWOT Analysis
- 13.1.7 The Himalayan Drug Company
- 13.1.7.1. Company Overview
- 13.1.7.2. Products
- 13.1.7.3. Company Financials
- 13.1.7.4. SWOT Analysis
- 13.1.1 Bayer AG
- 13.2. Market Entropy
- 13.2.1 Company's Key Areas Served
- 13.2.2 Recent Developments
- 13.3. Company Market Share Analysis 2025
- 13.3.1 Top 5 Companies Market Share Analysis
- 13.3.2 Top 3 Companies Market Share Analysis
- 13.4. List of Potential Customers
- 14. Research Methodology
List of Figures
- Figure 1: Global Immune Health Supplements Industry Revenue Breakdown (Million, %) by Region 2025 & 2033
- Figure 2: North America Immune Health Supplements Industry Revenue (Million), by Product Type 2025 & 2033
- Figure 3: North America Immune Health Supplements Industry Revenue Share (%), by Product Type 2025 & 2033
- Figure 4: North America Immune Health Supplements Industry Revenue (Million), by Source 2025 & 2033
- Figure 5: North America Immune Health Supplements Industry Revenue Share (%), by Source 2025 & 2033
- Figure 6: North America Immune Health Supplements Industry Revenue (Million), by Format 2025 & 2033
- Figure 7: North America Immune Health Supplements Industry Revenue Share (%), by Format 2025 & 2033
- Figure 8: North America Immune Health Supplements Industry Revenue (Million), by Distribution Channel 2025 & 2033
- Figure 9: North America Immune Health Supplements Industry Revenue Share (%), by Distribution Channel 2025 & 2033
- Figure 10: North America Immune Health Supplements Industry Revenue (Million), by Country 2025 & 2033
- Figure 11: North America Immune Health Supplements Industry Revenue Share (%), by Country 2025 & 2033
- Figure 12: Europe Immune Health Supplements Industry Revenue (Million), by Product Type 2025 & 2033
- Figure 13: Europe Immune Health Supplements Industry Revenue Share (%), by Product Type 2025 & 2033
- Figure 14: Europe Immune Health Supplements Industry Revenue (Million), by Source 2025 & 2033
- Figure 15: Europe Immune Health Supplements Industry Revenue Share (%), by Source 2025 & 2033
- Figure 16: Europe Immune Health Supplements Industry Revenue (Million), by Format 2025 & 2033
- Figure 17: Europe Immune Health Supplements Industry Revenue Share (%), by Format 2025 & 2033
- Figure 18: Europe Immune Health Supplements Industry Revenue (Million), by Distribution Channel 2025 & 2033
- Figure 19: Europe Immune Health Supplements Industry Revenue Share (%), by Distribution Channel 2025 & 2033
- Figure 20: Europe Immune Health Supplements Industry Revenue (Million), by Country 2025 & 2033
- Figure 21: Europe Immune Health Supplements Industry Revenue Share (%), by Country 2025 & 2033
- Figure 22: Asia Pacific Immune Health Supplements Industry Revenue (Million), by Product Type 2025 & 2033
- Figure 23: Asia Pacific Immune Health Supplements Industry Revenue Share (%), by Product Type 2025 & 2033
- Figure 24: Asia Pacific Immune Health Supplements Industry Revenue (Million), by Source 2025 & 2033
- Figure 25: Asia Pacific Immune Health Supplements Industry Revenue Share (%), by Source 2025 & 2033
- Figure 26: Asia Pacific Immune Health Supplements Industry Revenue (Million), by Format 2025 & 2033
- Figure 27: Asia Pacific Immune Health Supplements Industry Revenue Share (%), by Format 2025 & 2033
- Figure 28: Asia Pacific Immune Health Supplements Industry Revenue (Million), by Distribution Channel 2025 & 2033
- Figure 29: Asia Pacific Immune Health Supplements Industry Revenue Share (%), by Distribution Channel 2025 & 2033
- Figure 30: Asia Pacific Immune Health Supplements Industry Revenue (Million), by Country 2025 & 2033
- Figure 31: Asia Pacific Immune Health Supplements Industry Revenue Share (%), by Country 2025 & 2033
- Figure 32: South America Immune Health Supplements Industry Revenue (Million), by Product Type 2025 & 2033
- Figure 33: South America Immune Health Supplements Industry Revenue Share (%), by Product Type 2025 & 2033
- Figure 34: South America Immune Health Supplements Industry Revenue (Million), by Source 2025 & 2033
- Figure 35: South America Immune Health Supplements Industry Revenue Share (%), by Source 2025 & 2033
- Figure 36: South America Immune Health Supplements Industry Revenue (Million), by Format 2025 & 2033
- Figure 37: South America Immune Health Supplements Industry Revenue Share (%), by Format 2025 & 2033
- Figure 38: South America Immune Health Supplements Industry Revenue (Million), by Distribution Channel 2025 & 2033
- Figure 39: South America Immune Health Supplements Industry Revenue Share (%), by Distribution Channel 2025 & 2033
- Figure 40: South America Immune Health Supplements Industry Revenue (Million), by Country 2025 & 2033
- Figure 41: South America Immune Health Supplements Industry Revenue Share (%), by Country 2025 & 2033
- Figure 42: Middle East Immune Health Supplements Industry Revenue (Million), by Product Type 2025 & 2033
- Figure 43: Middle East Immune Health Supplements Industry Revenue Share (%), by Product Type 2025 & 2033
- Figure 44: Middle East Immune Health Supplements Industry Revenue (Million), by Source 2025 & 2033
- Figure 45: Middle East Immune Health Supplements Industry Revenue Share (%), by Source 2025 & 2033
- Figure 46: Middle East Immune Health Supplements Industry Revenue (Million), by Format 2025 & 2033
- Figure 47: Middle East Immune Health Supplements Industry Revenue Share (%), by Format 2025 & 2033
- Figure 48: Middle East Immune Health Supplements Industry Revenue (Million), by Distribution Channel 2025 & 2033
- Figure 49: Middle East Immune Health Supplements Industry Revenue Share (%), by Distribution Channel 2025 & 2033
- Figure 50: Middle East Immune Health Supplements Industry Revenue (Million), by Country 2025 & 2033
- Figure 51: Middle East Immune Health Supplements Industry Revenue Share (%), by Country 2025 & 2033
- Figure 52: South Africa Immune Health Supplements Industry Revenue (Million), by Product Type 2025 & 2033
- Figure 53: South Africa Immune Health Supplements Industry Revenue Share (%), by Product Type 2025 & 2033
- Figure 54: South Africa Immune Health Supplements Industry Revenue (Million), by Source 2025 & 2033
- Figure 55: South Africa Immune Health Supplements Industry Revenue Share (%), by Source 2025 & 2033
- Figure 56: South Africa Immune Health Supplements Industry Revenue (Million), by Format 2025 & 2033
- Figure 57: South Africa Immune Health Supplements Industry Revenue Share (%), by Format 2025 & 2033
- Figure 58: South Africa Immune Health Supplements Industry Revenue (Million), by Distribution Channel 2025 & 2033
- Figure 59: South Africa Immune Health Supplements Industry Revenue Share (%), by Distribution Channel 2025 & 2033
- Figure 60: South Africa Immune Health Supplements Industry Revenue (Million), by Country 2025 & 2033
- Figure 61: South Africa Immune Health Supplements Industry Revenue Share (%), by Country 2025 & 2033
List of Tables
- Table 1: Global Immune Health Supplements Industry Revenue Million Forecast, by Product Type 2020 & 2033
- Table 2: Global Immune Health Supplements Industry Revenue Million Forecast, by Source 2020 & 2033
- Table 3: Global Immune Health Supplements Industry Revenue Million Forecast, by Format 2020 & 2033
- Table 4: Global Immune Health Supplements Industry Revenue Million Forecast, by Distribution Channel 2020 & 2033
- Table 5: Global Immune Health Supplements Industry Revenue Million Forecast, by Region 2020 & 2033
- Table 6: Global Immune Health Supplements Industry Revenue Million Forecast, by Product Type 2020 & 2033
- Table 7: Global Immune Health Supplements Industry Revenue Million Forecast, by Source 2020 & 2033
- Table 8: Global Immune Health Supplements Industry Revenue Million Forecast, by Format 2020 & 2033
- Table 9: Global Immune Health Supplements Industry Revenue Million Forecast, by Distribution Channel 2020 & 2033
- Table 10: Global Immune Health Supplements Industry Revenue Million Forecast, by Country 2020 & 2033
- Table 11: United States Immune Health Supplements Industry Revenue (Million) Forecast, by Application 2020 & 2033
- Table 12: Canada Immune Health Supplements Industry Revenue (Million) Forecast, by Application 2020 & 2033
- Table 13: Mexico Immune Health Supplements Industry Revenue (Million) Forecast, by Application 2020 & 2033
- Table 14: Rest of North America Immune Health Supplements Industry Revenue (Million) Forecast, by Application 2020 & 2033
- Table 15: Global Immune Health Supplements Industry Revenue Million Forecast, by Product Type 2020 & 2033
- Table 16: Global Immune Health Supplements Industry Revenue Million Forecast, by Source 2020 & 2033
- Table 17: Global Immune Health Supplements Industry Revenue Million Forecast, by Format 2020 & 2033
- Table 18: Global Immune Health Supplements Industry Revenue Million Forecast, by Distribution Channel 2020 & 2033
- Table 19: Global Immune Health Supplements Industry Revenue Million Forecast, by Country 2020 & 2033
- Table 20: United Kingdom Immune Health Supplements Industry Revenue (Million) Forecast, by Application 2020 & 2033
- Table 21: Germany Immune Health Supplements Industry Revenue (Million) Forecast, by Application 2020 & 2033
- Table 22: Spain Immune Health Supplements Industry Revenue (Million) Forecast, by Application 2020 & 2033
- Table 23: France Immune Health Supplements Industry Revenue (Million) Forecast, by Application 2020 & 2033
- Table 24: Italy Immune Health Supplements Industry Revenue (Million) Forecast, by Application 2020 & 2033
- Table 25: Russia Immune Health Supplements Industry Revenue (Million) Forecast, by Application 2020 & 2033
- Table 26: Rest of Europe Immune Health Supplements Industry Revenue (Million) Forecast, by Application 2020 & 2033
- Table 27: Global Immune Health Supplements Industry Revenue Million Forecast, by Product Type 2020 & 2033
- Table 28: Global Immune Health Supplements Industry Revenue Million Forecast, by Source 2020 & 2033
- Table 29: Global Immune Health Supplements Industry Revenue Million Forecast, by Format 2020 & 2033
- Table 30: Global Immune Health Supplements Industry Revenue Million Forecast, by Distribution Channel 2020 & 2033
- Table 31: Global Immune Health Supplements Industry Revenue Million Forecast, by Country 2020 & 2033
- Table 32: China Immune Health Supplements Industry Revenue (Million) Forecast, by Application 2020 & 2033
- Table 33: India Immune Health Supplements Industry Revenue (Million) Forecast, by Application 2020 & 2033
- Table 34: Japan Immune Health Supplements Industry Revenue (Million) Forecast, by Application 2020 & 2033
- Table 35: Australia Immune Health Supplements Industry Revenue (Million) Forecast, by Application 2020 & 2033
- Table 36: Rest of Asia Pacific Immune Health Supplements Industry Revenue (Million) Forecast, by Application 2020 & 2033
- Table 37: Global Immune Health Supplements Industry Revenue Million Forecast, by Product Type 2020 & 2033
- Table 38: Global Immune Health Supplements Industry Revenue Million Forecast, by Source 2020 & 2033
- Table 39: Global Immune Health Supplements Industry Revenue Million Forecast, by Format 2020 & 2033
- Table 40: Global Immune Health Supplements Industry Revenue Million Forecast, by Distribution Channel 2020 & 2033
- Table 41: Global Immune Health Supplements Industry Revenue Million Forecast, by Country 2020 & 2033
- Table 42: Brazil Immune Health Supplements Industry Revenue (Million) Forecast, by Application 2020 & 2033
- Table 43: Argentina Immune Health Supplements Industry Revenue (Million) Forecast, by Application 2020 & 2033
- Table 44: Rest of South America Immune Health Supplements Industry Revenue (Million) Forecast, by Application 2020 & 2033
- Table 45: Global Immune Health Supplements Industry Revenue Million Forecast, by Product Type 2020 & 2033
- Table 46: Global Immune Health Supplements Industry Revenue Million Forecast, by Source 2020 & 2033
- Table 47: Global Immune Health Supplements Industry Revenue Million Forecast, by Format 2020 & 2033
- Table 48: Global Immune Health Supplements Industry Revenue Million Forecast, by Distribution Channel 2020 & 2033
- Table 49: Global Immune Health Supplements Industry Revenue Million Forecast, by Country 2020 & 2033
- Table 50: Global Immune Health Supplements Industry Revenue Million Forecast, by Product Type 2020 & 2033
- Table 51: Global Immune Health Supplements Industry Revenue Million Forecast, by Source 2020 & 2033
- Table 52: Global Immune Health Supplements Industry Revenue Million Forecast, by Format 2020 & 2033
- Table 53: Global Immune Health Supplements Industry Revenue Million Forecast, by Distribution Channel 2020 & 2033
- Table 54: Global Immune Health Supplements Industry Revenue Million Forecast, by Country 2020 & 2033
- Table 55: Saudi Arabia Immune Health Supplements Industry Revenue (Million) Forecast, by Application 2020 & 2033
- Table 56: Rest of Middle East Immune Health Supplements Industry Revenue (Million) Forecast, by Application 2020 & 2033
Frequently Asked Questions
1. What is the projected Compound Annual Growth Rate (CAGR) of the Immune Health Supplements Industry?
The projected CAGR is approximately 7.40%.
2. Which companies are prominent players in the Immune Health Supplements Industry?
Key companies in the market include Bayer AG, Amway Corp, Koninklijke DSM N V, NutriGold Inc*List Not Exhaustive, NOW Foods, Glanbia Plc, The Himalayan Drug Company.
3. What are the main segments of the Immune Health Supplements Industry?
The market segments include Product Type, Source, Format, Distribution Channel.
4. Can you provide details about the market size?
The market size is estimated to be USD 25,456.2 Million as of 2022.
5. What are some drivers contributing to market growth?
Popularity of Convenient and On the Go Snacking Options; Product Differentiation Playing a Key Role in Market Expansion.
6. What are the notable trends driving market growth?
Increasing Healthcare Costs and Growing Dependence on Supplements.
7. Are there any restraints impacting market growth?
Associated Health Risks; Easy Availability of Healthy Substitutes.
8. Can you provide examples of recent developments in the market?
N/A
9. What pricing options are available for accessing the report?
Pricing options include single-user, multi-user, and enterprise licenses priced at USD 4750, USD 5250, and USD 8750 respectively.
10. Is the market size provided in terms of value or volume?
The market size is provided in terms of value, measured in Million.
11. Are there any specific market keywords associated with the report?
Yes, the market keyword associated with the report is "Immune Health Supplements Industry," which aids in identifying and referencing the specific market segment covered.
12. How do I determine which pricing option suits my needs best?
The pricing options vary based on user requirements and access needs. Individual users may opt for single-user licenses, while businesses requiring broader access may choose multi-user or enterprise licenses for cost-effective access to the report.
13. Are there any additional resources or data provided in the Immune Health Supplements Industry report?
While the report offers comprehensive insights, it's advisable to review the specific contents or supplementary materials provided to ascertain if additional resources or data are available.
14. How can I stay updated on further developments or reports in the Immune Health Supplements Industry?
To stay informed about further developments, trends, and reports in the Immune Health Supplements Industry, consider subscribing to industry newsletters, following relevant companies and organizations, or regularly checking reputable industry news sources and publications.
Methodology
Step 1 - Identification of Relevant Samples Size from Population Database


Step 2 - Approaches for Defining Global Market Size (Value, Volume* & Price*)

Note*: In applicable scenarios
Step 3 - Data Sources
Primary Research
- Web Analytics
- Survey Reports
- Research Institute
- Latest Research Reports
- Opinion Leaders
Secondary Research
- Annual Reports
- White Paper
- Latest Press Release
- Industry Association
- Paid Database
- Investor Presentations

Step 4 - Data Triangulation
Involves using different sources of information in order to increase the validity of a study
These sources are likely to be stakeholders in a program - participants, other researchers, program staff, other community members, and so on.
Then we put all data in single framework & apply various statistical tools to find out the dynamic on the market.
During the analysis stage, feedback from the stakeholder groups would be compared to determine areas of agreement as well as areas of divergence