

Key Insights
The global hydrogen gas market is projected for substantial expansion, driven by a projected Compound Annual Growth Rate (CAGR) of 8.6%. Expected to reach 204.86 billion by 2025, the market's robust growth is underpinned by several key factors. The escalating adoption of fuel cell electric vehicles (FCEVs) across diverse sectors is a primary demand driver. Concurrently, a heightened focus on decarbonization strategies and the imperative for sustainable energy solutions are fostering a supportive market environment. Significant applications are found within the industrial sector, notably in ammonia production, methanol synthesis, refining operations, and the rapidly advancing direct reduced iron (DRI) industry. The distribution network, encompassing pipelines, high-pressure tube trailers, and cylinders, is undergoing continuous development, with ongoing investments in pipeline infrastructure and specialized logistics solutions to accommodate rising demand. Nonetheless, challenges persist, including the considerable cost associated with hydrogen production and storage, and the absence of a universally standardized infrastructure across all regions. Addressing these impediments will be vital for unlocking the market's full potential.
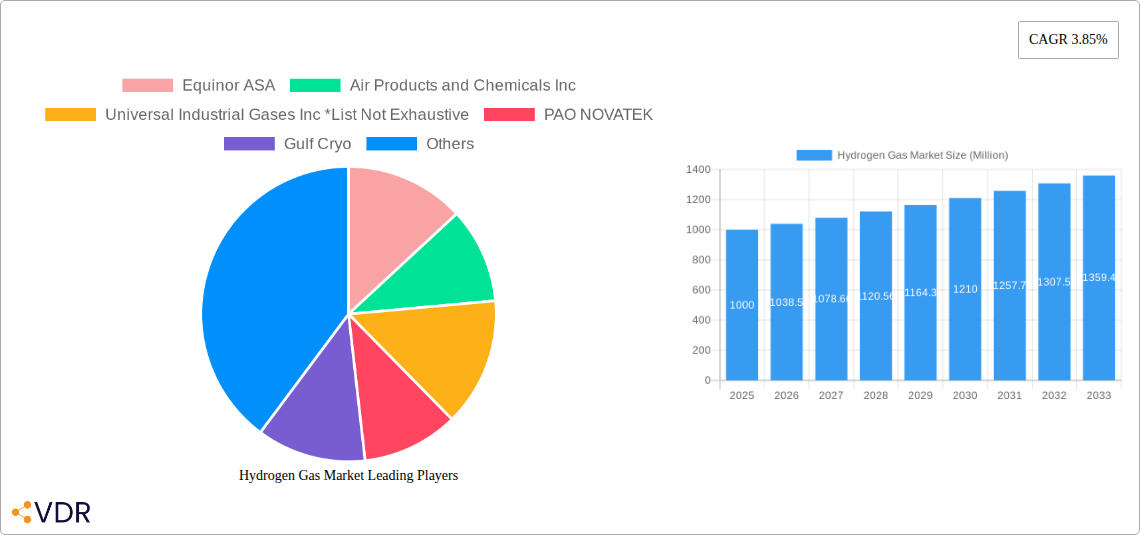
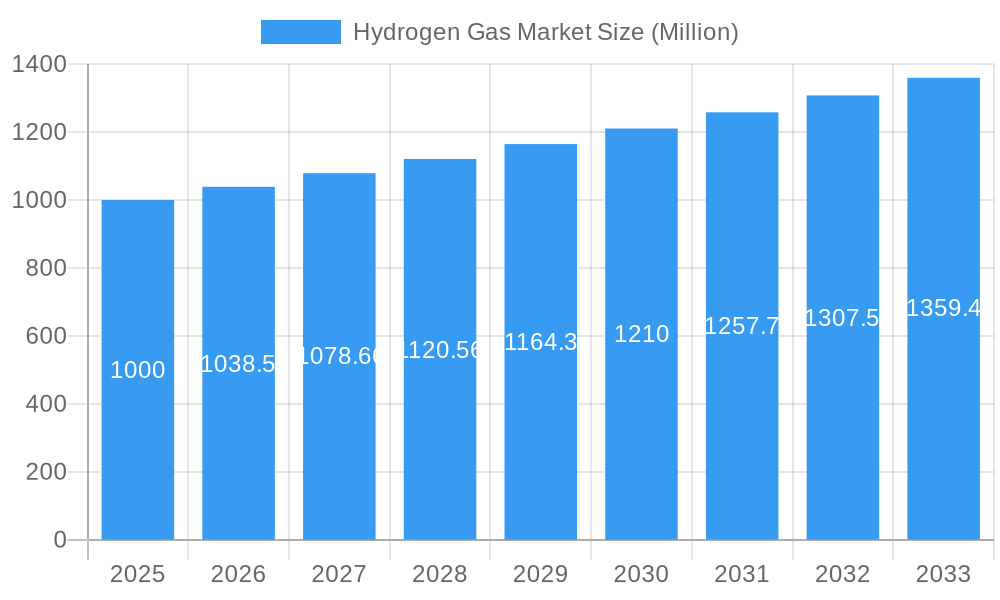
Hydrogen Gas Market Market Size (In Billion)
Geographically, the Asia Pacific region, led by China and India, is poised to command the largest market share, fueled by rapid industrial expansion and governmental backing for clean energy technologies. North America and Europe are also significant contributors, propelled by stringent regulatory frameworks and substantial investments in renewable hydrogen production. Market segmentation indicates varied distribution across applications; ammonia and methanol production are anticipated to remain dominant segments, while FCEVs are forecasted for exponential growth throughout the forecast period. Leading market participants such as Air Products and Chemicals, Linde plc, and Air Liquide are actively influencing market trajectories through strategic investments, technological innovations, and global expansion initiatives. The competitive arena features a blend of established industry leaders and emerging contenders, cultivating innovation and contributing to cost reduction.
Hydrogen Gas Market Company Market Share
Hydrogen Gas Market: A Comprehensive Report (2019-2033)
This comprehensive report provides an in-depth analysis of the Hydrogen Gas Market, encompassing its parent market (renewable energy) and child markets (fuel cell vehicles, ammonia production, etc.), from 2019 to 2033. The study covers market dynamics, growth trends, regional segmentation, product landscape, key players, and future opportunities, offering invaluable insights for industry professionals, investors, and strategic decision-makers. The report leverages extensive data analysis and expert insights to deliver a clear and actionable understanding of this rapidly evolving market projected to reach xx Million units by 2033.
Hydrogen Gas Market Dynamics & Structure
This section delves into the intricate dynamics of the hydrogen gas market, analyzing market concentration, technological advancements, regulatory landscapes, competitive substitutes, and merger & acquisition (M&A) activities. The report quantifies market share among key players and explores qualitative factors impacting innovation.
Market Concentration: The hydrogen gas market is characterized by a moderately concentrated structure with several large global players holding significant market share. The top five companies—Air Liquide, Linde plc, Air Products and Chemicals Inc, Messer SE & Co KGaA, and Equinor ASA—account for approximately xx% of the global market. Smaller regional players also contribute significantly to the market.
Technological Innovation: Technological advancements in electrolysis, including alkaline, proton exchange membrane (PEM), and solid oxide electrolysis (SOE) are driving efficiency improvements and cost reductions in green hydrogen production. Innovation in hydrogen storage and transportation technologies, such as high-pressure cylinders, tube trailers, and pipelines, is also crucial for market expansion. However, barriers to innovation include high initial investment costs and the need for specialized infrastructure.
Regulatory Framework: Government policies and incentives play a critical role in shaping the hydrogen gas market. Many countries are implementing supportive regulations, including carbon pricing mechanisms, tax credits, and research grants, to encourage the adoption of hydrogen as a clean energy carrier. However, regulatory uncertainty and inconsistencies across regions remain a challenge.
Competitive Substitutes: Natural gas and other fossil fuels remain strong competitors, particularly in applications where hydrogen is not economically competitive. However, rising environmental concerns and stringent emission regulations are expected to reduce the competitiveness of fossil fuels in the long run.
End-User Demographics: The key end-use sectors driving demand for hydrogen gas include ammonia production, methanol synthesis, refining, direct reduced iron (DRI) production, and fuel cell electric vehicles (FCEVs). Growth in these sectors is expected to fuel significant demand for hydrogen.
M&A Trends: The hydrogen gas market has witnessed a surge in mergers and acquisitions in recent years, with major players consolidating their positions and expanding their geographic reach. The number of M&A deals increased by xx% between 2021 and 2022, indicating strong industry consolidation. Examples include the June 2022 acquisition of Triton Power by Equinor and SSE Thermal.
Hydrogen Gas Market Growth Trends & Insights
The global hydrogen gas market exhibited strong growth during the historical period (2019-2024), with a CAGR of xx%. This growth is attributed to several factors, including the increasing demand for clean energy solutions, supportive government policies, and technological advancements in hydrogen production and storage. The market size is expected to reach xx Million units in 2025 and is projected to grow at a CAGR of xx% from 2025 to 2033, reaching xx Million units by 2033. This growth will be driven by increasing adoption rates across various sectors, particularly in transportation and industrial applications. Technological advancements, including improvements in electrolysis technology and hydrogen storage solutions, are further accelerating market adoption. Shifting consumer preferences towards environmentally friendly alternatives will continue to drive growth.
Dominant Regions, Countries, or Segments in Hydrogen Gas Market
The hydrogen gas market is geographically diverse, with significant growth observed across various regions. However, certain regions and segments are emerging as leaders, driven by specific factors such as economic policies, infrastructure development, and industrial activity.
Leading Region: Asia-Pacific is currently the dominant region, driven by large-scale industrial activities, particularly in China, Japan, and South Korea. This region’s strong economic growth and commitment to renewable energy goals fuels significant hydrogen demand, accounting for approximately xx% of the global market share. Europe is another key region with strong growth potential due to supportive government policies and significant investments in green hydrogen projects.
Leading Countries: China leads the global hydrogen gas market in terms of production and consumption, followed by Japan, and the United States. These countries are making substantial investments in hydrogen infrastructure and technology development.
Leading Segments: The application segments of Ammonia and Methanol synthesis, and refining, along with DRI production contribute significantly to the overall market, while the distribution segment is mainly driven by pipelines and high-pressure tube trailers due to their cost efficiency for large-scale transport. Fuel cell vehicles (FCVs) are expected to show exponential growth in the coming decade.
Key Drivers:
- Supportive government policies and incentives.
- Growing demand for clean energy solutions.
- Increasing investment in hydrogen infrastructure.
- Technological advancements in hydrogen production and storage.
- Expanding industrial applications of hydrogen.
Hydrogen Gas Market Product Landscape
The hydrogen gas market is characterized by a diverse product portfolio catering to a wide spectrum of industrial and energy needs. Key offerings include high-purity hydrogen, essential for sensitive applications such as semiconductor manufacturing, pharmaceuticals, and analytical laboratories. Alongside this, industrial-grade hydrogen serves broader applications in sectors like refining, chemical synthesis, and metallurgy. A rapidly growing segment is hydrogen for fuel cell applications, specifically engineered for clean energy solutions in transportation and stationary power generation.
Recent innovations are significantly impacting production methodologies, with a strong emphasis on enhancing the efficiency and reducing the cost of hydrogen production. This includes advancements in electrolysis technologies, particularly PEM and alkaline electrolyzers, and optimizing gasification processes for a wider range of feedstocks. The core selling propositions that resonate with buyers are consistently high purity, unwavering quality control, robust safe handling protocols, and the compelling environmental benefits associated with hydrogen as a clean energy carrier.
Technological advancements are continuously shaping the market. This is evident in the development of more sophisticated and energy-efficient electrolyzers, as well as the evolution of improved hydrogen storage technologies. These advancements encompass novel materials for enhanced storage density and the design of advanced, lightweight pressure vessels that improve safety and reduce transportation costs.
Key Drivers, Barriers & Challenges in Hydrogen Gas Market
Key Drivers:
- The increasing need for cleaner energy sources, driven by environmental concerns and stricter emission regulations, is a significant driver.
- Technological advancements in hydrogen production and storage are making it more cost-effective and efficient.
- Government incentives and support programs are accelerating adoption and investments in hydrogen technologies.
Key Challenges and Restraints:
- High production costs, particularly for green hydrogen, remain a significant barrier to wider adoption. This adds approximately xx% to the total cost of production.
- Establishing a robust hydrogen infrastructure, including production, storage, and transportation networks, requires significant investment and long-term planning. This causes delays in projects by approximately xx months.
- Safety concerns associated with hydrogen storage and handling can hinder market growth. These safety issues impact market growth by approximately xx%.
Emerging Opportunities in Hydrogen Gas Market
The hydrogen gas market is currently experiencing a surge of new opportunities, driven by global decarbonization efforts and technological breakthroughs. These emerging avenues represent significant potential for growth and investment:
- Green Hydrogen Production: This is arguably the most dynamic area, with substantial and increasing investment flowing into the production of hydrogen derived from renewable energy sources (solar, wind, hydro). This pathway offers a truly carbon-neutral solution and is supported by supportive government incentives and a growing corporate commitment to sustainability.
- Fuel Cell Electric Vehicles (FCEVs): The burgeoning market for FCEVs, encompassing passenger cars, trucks, buses, and even trains and ships, is a major growth driver for hydrogen as a clean and efficient fuel source. As infrastructure develops and vehicle adoption accelerates, the demand for hydrogen in this sector is set to skyrocket.
- Industrial Decarbonization Applications: Hydrogen is increasingly being recognized as a vital tool for decarbonizing hard-to-abate industrial sectors. Its applications are expanding significantly in areas such as green ammonia and methanol production (for fuels and chemicals), sustainable refining processes, the production of low-carbon steel, and advanced metal processing, reducing reliance on fossil fuels.
- Energy Storage and Grid Balancing: Hydrogen's potential for long-duration energy storage is a critical emerging opportunity. It can be produced when renewable energy is abundant and stored for later use, providing grid stability and a reliable power source, especially in conjunction with fuel cells.
Growth Accelerators in the Hydrogen Gas Market Industry
Technological breakthroughs in hydrogen production, storage, and transportation, along with strategic partnerships between energy companies and technology providers, are key catalysts for long-term growth. Furthermore, government initiatives promoting hydrogen as a clean energy vector are vital growth drivers. Expanding market penetration into new sectors and applications, such as long-haul transportation and energy storage, will also stimulate market growth significantly.
Key Players Shaping the Hydrogen Gas Market Market
- Equinor ASA
- Air Products and Chemicals Inc
- Universal Industrial Gases Inc
- PAO NOVATEK
- Gulf Cryo
- Lords Chloro Alkali Limited
- Gujarat Alkalies and Chemicals Limited
- Matheson Tri-Gas Inc
- BASF SE
- Aditya Birla Chemicals
- Linde plc
- TAIYO NIPPON SANSO CORPORATION
- Air Liquide
- Messer SE & Co KGaA
Notable Milestones in Hydrogen Gas Market Sector
The hydrogen gas market has witnessed several significant developments and strategic moves that underscore its rapid evolution and growing momentum:
- June 2022: BASF and Shell announced a collaboration aimed at significantly enhancing green hydrogen production. This partnership leveraged BASF's advanced Puristar R0-20 and Sorbead Adsorption Technology, leading to substantial improvements in the efficiency and effectiveness of hydrogen purification and dehydration processes.
- June 2022: Equinor and SSE Thermal completed the acquisition of Triton Power, which includes the Saltend Power Station. This acquisition signals a major commitment to integrating hydrogen into power generation, with ambitious targets of achieving up to 30% hydrogen usage by 2027 and aiming for 100% hydrogen fuel in the long term, demonstrating a clear pathway towards decarbonizing the power sector.
- July 2022: Air Products and VPI entered into a partnership to develop the Humber Hydrogen Hub (H3). This ambitious project is set to establish an 800 MW low-carbon hydrogen production facility, representing a significant, large-scale investment in critical hydrogen production infrastructure and underscoring the growing importance of the Humber region as a hydrogen hub.
In-Depth Hydrogen Gas Market Market Outlook
The global hydrogen gas market is on an unprecedented growth trajectory, with forecasts indicating substantial expansion in the coming years. This optimism is fueled by a confluence of powerful drivers, including rapid technological advancements, increasingly supportive government policies and regulatory frameworks worldwide, and a surging demand across a multitude of key sectors. Strategic alliances, joint ventures, and substantial investments in research and development are proving to be pivotal in accelerating market expansion and unlocking new frontiers.
The exploration and adoption of novel applications for hydrogen are particularly noteworthy. Its burgeoning role in large-scale power generation, enabling the decarbonization of electricity grids, and its critical function in facilitating long-distance and heavy-duty transportation (e.g., trucks, ships, aviation) are poised to create significant and lucrative opportunities for market participants. As the world pivots towards a cleaner energy future, the hydrogen market's future potential is immense, offering substantial and profitable avenues for businesses that are strategically positioned to embrace and capitalize on this dynamic and evolving landscape.
Hydrogen Gas Market Segmentation
-
1. Distribution
- 1.1. Pipelines
- 1.2. High-pressure Tube Trailers
- 1.3. Cylinders
-
2. Application
- 2.1. Ammonia
- 2.2. Methanol
- 2.3. Refining
- 2.4. Direct Reduced Iron (DRI)
- 2.5. Fuel Cell Vehicles (FCV)
- 2.6. Other Ap
Hydrogen Gas Market Segmentation By Geography
-
1. Asia Pacific
- 1.1. China
- 1.2. India
- 1.3. Japan
- 1.4. South Korea
- 1.5. Malaysia
- 1.6. Thailand
- 1.7. Indonesia
- 1.8. Vietnam
- 1.9. Rest of Asia Pacific
-
2. North America
- 2.1. United States
- 2.2. Canada
- 2.3. Mexico
-
3. Europe
- 3.1. Germany
- 3.2. United Kingdom
- 3.3. Italy
- 3.4. France
- 3.5. Spain
- 3.6. NORDIC
- 3.7. Turkey
- 3.8. Russia
- 3.9. Rest of Europe
-
4. South America
- 4.1. Brazil
- 4.2. Argentina
- 4.3. Colombia
- 4.4. Rest of South America
-
5. Middle East and Africa
- 5.1. Saudi Arabia
- 5.2. South Africa
- 5.3. Nigeria
- 5.4. Qatar
- 5.5. Egypt
- 5.6. United Arab Emirates
- 5.7. Rest of Middle East and Africa
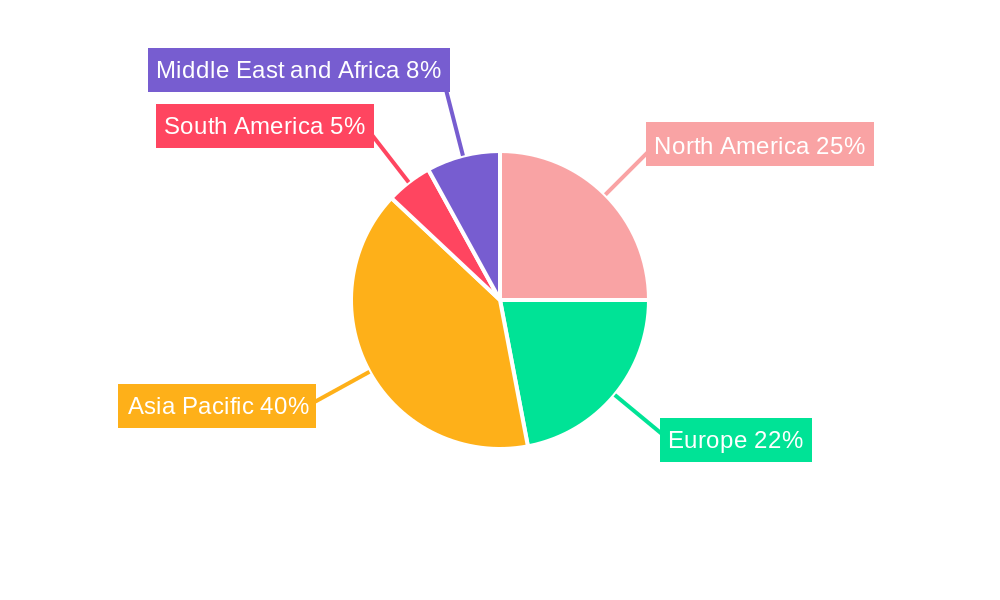
Hydrogen Gas Market Regional Market Share
Geographic Coverage of Hydrogen Gas Market
Hydrogen Gas Market REPORT HIGHLIGHTS
| Aspects | Details |
|---|---|
| Study Period | 2020-2034 |
| Base Year | 2025 |
| Estimated Year | 2026 |
| Forecast Period | 2026-2034 |
| Historical Period | 2020-2025 |
| Growth Rate | CAGR of 8.6% from 2020-2034 |
| Segmentation |
|
Table of Contents
- 1. Introduction
- 1.1. Research Scope
- 1.2. Market Segmentation
- 1.3. Research Objective
- 1.4. Definitions and Assumptions
- 2. Executive Summary
- 2.1. Market Snapshot
- 3. Market Dynamics
- 3.1. Market Drivers
- 3.2. Market Restrains
- 3.3. Market Trends
- 3.4. Market Opportunities
- 4. Market Factor Analysis
- 4.1. Porters Five Forces
- 4.1.1. Bargaining Power of Suppliers
- 4.1.2. Bargaining Power of Buyers
- 4.1.3. Threat of New Entrants
- 4.1.4. Threat of Substitutes
- 4.1.5. Competitive Rivalry
- 4.2. PESTEL analysis
- 4.3. BCG Analysis
- 4.3.1. Stars (High Growth, High Market Share)
- 4.3.2. Cash Cows (Low Growth, High Market Share)
- 4.3.3. Question Mark (High Growth, Low Market Share)
- 4.3.4. Dogs (Low Growth, Low Market Share)
- 4.4. Ansoff Matrix Analysis
- 4.5. Supply Chain Analysis
- 4.6. Regulatory Landscape
- 4.7. Current Market Potential and Opportunity Assessment (TAM–SAM–SOM Framework)
- 4.8. VDR Analyst Note
- 4.1. Porters Five Forces
- 5. Market Analysis, Insights and Forecast 2021-2033
- 5.1. Market Analysis, Insights and Forecast - by Distribution
- 5.1.1. Pipelines
- 5.1.2. High-pressure Tube Trailers
- 5.1.3. Cylinders
- 5.2. Market Analysis, Insights and Forecast - by Application
- 5.2.1. Ammonia
- 5.2.2. Methanol
- 5.2.3. Refining
- 5.2.4. Direct Reduced Iron (DRI)
- 5.2.5. Fuel Cell Vehicles (FCV)
- 5.2.6. Other Ap
- 5.3. Market Analysis, Insights and Forecast - by Region
- 5.3.1. Asia Pacific
- 5.3.2. North America
- 5.3.3. Europe
- 5.3.4. South America
- 5.3.5. Middle East and Africa
- 5.1. Market Analysis, Insights and Forecast - by Distribution
- 6. Global Hydrogen Gas Market Analysis, Insights and Forecast, 2021-2033
- 6.1. Market Analysis, Insights and Forecast - by Distribution
- 6.1.1. Pipelines
- 6.1.2. High-pressure Tube Trailers
- 6.1.3. Cylinders
- 6.2. Market Analysis, Insights and Forecast - by Application
- 6.2.1. Ammonia
- 6.2.2. Methanol
- 6.2.3. Refining
- 6.2.4. Direct Reduced Iron (DRI)
- 6.2.5. Fuel Cell Vehicles (FCV)
- 6.2.6. Other Ap
- 6.1. Market Analysis, Insights and Forecast - by Distribution
- 7. Asia Pacific Hydrogen Gas Market Analysis, Insights and Forecast, 2021-2033
- 7.1. Market Analysis, Insights and Forecast - by Distribution
- 7.1.1. Pipelines
- 7.1.2. High-pressure Tube Trailers
- 7.1.3. Cylinders
- 7.2. Market Analysis, Insights and Forecast - by Application
- 7.2.1. Ammonia
- 7.2.2. Methanol
- 7.2.3. Refining
- 7.2.4. Direct Reduced Iron (DRI)
- 7.2.5. Fuel Cell Vehicles (FCV)
- 7.2.6. Other Ap
- 7.1. Market Analysis, Insights and Forecast - by Distribution
- 8. North America Hydrogen Gas Market Analysis, Insights and Forecast, 2021-2033
- 8.1. Market Analysis, Insights and Forecast - by Distribution
- 8.1.1. Pipelines
- 8.1.2. High-pressure Tube Trailers
- 8.1.3. Cylinders
- 8.2. Market Analysis, Insights and Forecast - by Application
- 8.2.1. Ammonia
- 8.2.2. Methanol
- 8.2.3. Refining
- 8.2.4. Direct Reduced Iron (DRI)
- 8.2.5. Fuel Cell Vehicles (FCV)
- 8.2.6. Other Ap
- 8.1. Market Analysis, Insights and Forecast - by Distribution
- 9. Europe Hydrogen Gas Market Analysis, Insights and Forecast, 2021-2033
- 9.1. Market Analysis, Insights and Forecast - by Distribution
- 9.1.1. Pipelines
- 9.1.2. High-pressure Tube Trailers
- 9.1.3. Cylinders
- 9.2. Market Analysis, Insights and Forecast - by Application
- 9.2.1. Ammonia
- 9.2.2. Methanol
- 9.2.3. Refining
- 9.2.4. Direct Reduced Iron (DRI)
- 9.2.5. Fuel Cell Vehicles (FCV)
- 9.2.6. Other Ap
- 9.1. Market Analysis, Insights and Forecast - by Distribution
- 10. South America Hydrogen Gas Market Analysis, Insights and Forecast, 2021-2033
- 10.1. Market Analysis, Insights and Forecast - by Distribution
- 10.1.1. Pipelines
- 10.1.2. High-pressure Tube Trailers
- 10.1.3. Cylinders
- 10.2. Market Analysis, Insights and Forecast - by Application
- 10.2.1. Ammonia
- 10.2.2. Methanol
- 10.2.3. Refining
- 10.2.4. Direct Reduced Iron (DRI)
- 10.2.5. Fuel Cell Vehicles (FCV)
- 10.2.6. Other Ap
- 10.1. Market Analysis, Insights and Forecast - by Distribution
- 11. Middle East and Africa Hydrogen Gas Market Analysis, Insights and Forecast, 2021-2033
- 11.1. Market Analysis, Insights and Forecast - by Distribution
- 11.1.1. Pipelines
- 11.1.2. High-pressure Tube Trailers
- 11.1.3. Cylinders
- 11.2. Market Analysis, Insights and Forecast - by Application
- 11.2.1. Ammonia
- 11.2.2. Methanol
- 11.2.3. Refining
- 11.2.4. Direct Reduced Iron (DRI)
- 11.2.5. Fuel Cell Vehicles (FCV)
- 11.2.6. Other Ap
- 11.1. Market Analysis, Insights and Forecast - by Distribution
- 12. Competitive Analysis
- 12.1. Company Profiles
- 12.1.1 Equinor ASA
- 12.1.1.1. Company Overview
- 12.1.1.2. Products
- 12.1.1.3. Company Financials
- 12.1.1.4. SWOT Analysis
- 12.1.2 Air Products and Chemicals Inc
- 12.1.2.1. Company Overview
- 12.1.2.2. Products
- 12.1.2.3. Company Financials
- 12.1.2.4. SWOT Analysis
- 12.1.3 Universal Industrial Gases Inc *List Not Exhaustive
- 12.1.3.1. Company Overview
- 12.1.3.2. Products
- 12.1.3.3. Company Financials
- 12.1.3.4. SWOT Analysis
- 12.1.4 PAO NOVATEK
- 12.1.4.1. Company Overview
- 12.1.4.2. Products
- 12.1.4.3. Company Financials
- 12.1.4.4. SWOT Analysis
- 12.1.5 Gulf Cryo
- 12.1.5.1. Company Overview
- 12.1.5.2. Products
- 12.1.5.3. Company Financials
- 12.1.5.4. SWOT Analysis
- 12.1.6 Lords Chloro Alkali Limited
- 12.1.6.1. Company Overview
- 12.1.6.2. Products
- 12.1.6.3. Company Financials
- 12.1.6.4. SWOT Analysis
- 12.1.7 Gujarat Alkalies and Chemicals Limited
- 12.1.7.1. Company Overview
- 12.1.7.2. Products
- 12.1.7.3. Company Financials
- 12.1.7.4. SWOT Analysis
- 12.1.8 Matheson Tri-Gas Inc
- 12.1.8.1. Company Overview
- 12.1.8.2. Products
- 12.1.8.3. Company Financials
- 12.1.8.4. SWOT Analysis
- 12.1.9 BASF SE
- 12.1.9.1. Company Overview
- 12.1.9.2. Products
- 12.1.9.3. Company Financials
- 12.1.9.4. SWOT Analysis
- 12.1.10 Aditya Birla Chemicals
- 12.1.10.1. Company Overview
- 12.1.10.2. Products
- 12.1.10.3. Company Financials
- 12.1.10.4. SWOT Analysis
- 12.1.11 Linde plc
- 12.1.11.1. Company Overview
- 12.1.11.2. Products
- 12.1.11.3. Company Financials
- 12.1.11.4. SWOT Analysis
- 12.1.12 TAIYO NIPPON SANSO CORPORATION
- 12.1.12.1. Company Overview
- 12.1.12.2. Products
- 12.1.12.3. Company Financials
- 12.1.12.4. SWOT Analysis
- 12.1.13 Air Liquide
- 12.1.13.1. Company Overview
- 12.1.13.2. Products
- 12.1.13.3. Company Financials
- 12.1.13.4. SWOT Analysis
- 12.1.14 Messer SE & Co KGaA
- 12.1.14.1. Company Overview
- 12.1.14.2. Products
- 12.1.14.3. Company Financials
- 12.1.14.4. SWOT Analysis
- 12.1.1 Equinor ASA
- 12.2. Market Entropy
- 12.2.1 Company's Key Areas Served
- 12.2.2 Recent Developments
- 12.3. Company Market Share Analysis 2025
- 12.3.1 Top 5 Companies Market Share Analysis
- 12.3.2 Top 3 Companies Market Share Analysis
- 12.4. List of Potential Customers
- 13. Research Methodology
List of Figures
- Figure 1: Global Hydrogen Gas Market Revenue Breakdown (billion, %) by Region 2025 & 2033
- Figure 2: Global Hydrogen Gas Market Volume Breakdown (Million, %) by Region 2025 & 2033
- Figure 3: Asia Pacific Hydrogen Gas Market Revenue (billion), by Distribution 2025 & 2033
- Figure 4: Asia Pacific Hydrogen Gas Market Volume (Million), by Distribution 2025 & 2033
- Figure 5: Asia Pacific Hydrogen Gas Market Revenue Share (%), by Distribution 2025 & 2033
- Figure 6: Asia Pacific Hydrogen Gas Market Volume Share (%), by Distribution 2025 & 2033
- Figure 7: Asia Pacific Hydrogen Gas Market Revenue (billion), by Application 2025 & 2033
- Figure 8: Asia Pacific Hydrogen Gas Market Volume (Million), by Application 2025 & 2033
- Figure 9: Asia Pacific Hydrogen Gas Market Revenue Share (%), by Application 2025 & 2033
- Figure 10: Asia Pacific Hydrogen Gas Market Volume Share (%), by Application 2025 & 2033
- Figure 11: Asia Pacific Hydrogen Gas Market Revenue (billion), by Country 2025 & 2033
- Figure 12: Asia Pacific Hydrogen Gas Market Volume (Million), by Country 2025 & 2033
- Figure 13: Asia Pacific Hydrogen Gas Market Revenue Share (%), by Country 2025 & 2033
- Figure 14: Asia Pacific Hydrogen Gas Market Volume Share (%), by Country 2025 & 2033
- Figure 15: North America Hydrogen Gas Market Revenue (billion), by Distribution 2025 & 2033
- Figure 16: North America Hydrogen Gas Market Volume (Million), by Distribution 2025 & 2033
- Figure 17: North America Hydrogen Gas Market Revenue Share (%), by Distribution 2025 & 2033
- Figure 18: North America Hydrogen Gas Market Volume Share (%), by Distribution 2025 & 2033
- Figure 19: North America Hydrogen Gas Market Revenue (billion), by Application 2025 & 2033
- Figure 20: North America Hydrogen Gas Market Volume (Million), by Application 2025 & 2033
- Figure 21: North America Hydrogen Gas Market Revenue Share (%), by Application 2025 & 2033
- Figure 22: North America Hydrogen Gas Market Volume Share (%), by Application 2025 & 2033
- Figure 23: North America Hydrogen Gas Market Revenue (billion), by Country 2025 & 2033
- Figure 24: North America Hydrogen Gas Market Volume (Million), by Country 2025 & 2033
- Figure 25: North America Hydrogen Gas Market Revenue Share (%), by Country 2025 & 2033
- Figure 26: North America Hydrogen Gas Market Volume Share (%), by Country 2025 & 2033
- Figure 27: Europe Hydrogen Gas Market Revenue (billion), by Distribution 2025 & 2033
- Figure 28: Europe Hydrogen Gas Market Volume (Million), by Distribution 2025 & 2033
- Figure 29: Europe Hydrogen Gas Market Revenue Share (%), by Distribution 2025 & 2033
- Figure 30: Europe Hydrogen Gas Market Volume Share (%), by Distribution 2025 & 2033
- Figure 31: Europe Hydrogen Gas Market Revenue (billion), by Application 2025 & 2033
- Figure 32: Europe Hydrogen Gas Market Volume (Million), by Application 2025 & 2033
- Figure 33: Europe Hydrogen Gas Market Revenue Share (%), by Application 2025 & 2033
- Figure 34: Europe Hydrogen Gas Market Volume Share (%), by Application 2025 & 2033
- Figure 35: Europe Hydrogen Gas Market Revenue (billion), by Country 2025 & 2033
- Figure 36: Europe Hydrogen Gas Market Volume (Million), by Country 2025 & 2033
- Figure 37: Europe Hydrogen Gas Market Revenue Share (%), by Country 2025 & 2033
- Figure 38: Europe Hydrogen Gas Market Volume Share (%), by Country 2025 & 2033
- Figure 39: South America Hydrogen Gas Market Revenue (billion), by Distribution 2025 & 2033
- Figure 40: South America Hydrogen Gas Market Volume (Million), by Distribution 2025 & 2033
- Figure 41: South America Hydrogen Gas Market Revenue Share (%), by Distribution 2025 & 2033
- Figure 42: South America Hydrogen Gas Market Volume Share (%), by Distribution 2025 & 2033
- Figure 43: South America Hydrogen Gas Market Revenue (billion), by Application 2025 & 2033
- Figure 44: South America Hydrogen Gas Market Volume (Million), by Application 2025 & 2033
- Figure 45: South America Hydrogen Gas Market Revenue Share (%), by Application 2025 & 2033
- Figure 46: South America Hydrogen Gas Market Volume Share (%), by Application 2025 & 2033
- Figure 47: South America Hydrogen Gas Market Revenue (billion), by Country 2025 & 2033
- Figure 48: South America Hydrogen Gas Market Volume (Million), by Country 2025 & 2033
- Figure 49: South America Hydrogen Gas Market Revenue Share (%), by Country 2025 & 2033
- Figure 50: South America Hydrogen Gas Market Volume Share (%), by Country 2025 & 2033
- Figure 51: Middle East and Africa Hydrogen Gas Market Revenue (billion), by Distribution 2025 & 2033
- Figure 52: Middle East and Africa Hydrogen Gas Market Volume (Million), by Distribution 2025 & 2033
- Figure 53: Middle East and Africa Hydrogen Gas Market Revenue Share (%), by Distribution 2025 & 2033
- Figure 54: Middle East and Africa Hydrogen Gas Market Volume Share (%), by Distribution 2025 & 2033
- Figure 55: Middle East and Africa Hydrogen Gas Market Revenue (billion), by Application 2025 & 2033
- Figure 56: Middle East and Africa Hydrogen Gas Market Volume (Million), by Application 2025 & 2033
- Figure 57: Middle East and Africa Hydrogen Gas Market Revenue Share (%), by Application 2025 & 2033
- Figure 58: Middle East and Africa Hydrogen Gas Market Volume Share (%), by Application 2025 & 2033
- Figure 59: Middle East and Africa Hydrogen Gas Market Revenue (billion), by Country 2025 & 2033
- Figure 60: Middle East and Africa Hydrogen Gas Market Volume (Million), by Country 2025 & 2033
- Figure 61: Middle East and Africa Hydrogen Gas Market Revenue Share (%), by Country 2025 & 2033
- Figure 62: Middle East and Africa Hydrogen Gas Market Volume Share (%), by Country 2025 & 2033
List of Tables
- Table 1: Global Hydrogen Gas Market Revenue billion Forecast, by Distribution 2020 & 2033
- Table 2: Global Hydrogen Gas Market Volume Million Forecast, by Distribution 2020 & 2033
- Table 3: Global Hydrogen Gas Market Revenue billion Forecast, by Application 2020 & 2033
- Table 4: Global Hydrogen Gas Market Volume Million Forecast, by Application 2020 & 2033
- Table 5: Global Hydrogen Gas Market Revenue billion Forecast, by Region 2020 & 2033
- Table 6: Global Hydrogen Gas Market Volume Million Forecast, by Region 2020 & 2033
- Table 7: Global Hydrogen Gas Market Revenue billion Forecast, by Distribution 2020 & 2033
- Table 8: Global Hydrogen Gas Market Volume Million Forecast, by Distribution 2020 & 2033
- Table 9: Global Hydrogen Gas Market Revenue billion Forecast, by Application 2020 & 2033
- Table 10: Global Hydrogen Gas Market Volume Million Forecast, by Application 2020 & 2033
- Table 11: Global Hydrogen Gas Market Revenue billion Forecast, by Country 2020 & 2033
- Table 12: Global Hydrogen Gas Market Volume Million Forecast, by Country 2020 & 2033
- Table 13: China Hydrogen Gas Market Revenue (billion) Forecast, by Application 2020 & 2033
- Table 14: China Hydrogen Gas Market Volume (Million) Forecast, by Application 2020 & 2033
- Table 15: India Hydrogen Gas Market Revenue (billion) Forecast, by Application 2020 & 2033
- Table 16: India Hydrogen Gas Market Volume (Million) Forecast, by Application 2020 & 2033
- Table 17: Japan Hydrogen Gas Market Revenue (billion) Forecast, by Application 2020 & 2033
- Table 18: Japan Hydrogen Gas Market Volume (Million) Forecast, by Application 2020 & 2033
- Table 19: South Korea Hydrogen Gas Market Revenue (billion) Forecast, by Application 2020 & 2033
- Table 20: South Korea Hydrogen Gas Market Volume (Million) Forecast, by Application 2020 & 2033
- Table 21: Malaysia Hydrogen Gas Market Revenue (billion) Forecast, by Application 2020 & 2033
- Table 22: Malaysia Hydrogen Gas Market Volume (Million) Forecast, by Application 2020 & 2033
- Table 23: Thailand Hydrogen Gas Market Revenue (billion) Forecast, by Application 2020 & 2033
- Table 24: Thailand Hydrogen Gas Market Volume (Million) Forecast, by Application 2020 & 2033
- Table 25: Indonesia Hydrogen Gas Market Revenue (billion) Forecast, by Application 2020 & 2033
- Table 26: Indonesia Hydrogen Gas Market Volume (Million) Forecast, by Application 2020 & 2033
- Table 27: Vietnam Hydrogen Gas Market Revenue (billion) Forecast, by Application 2020 & 2033
- Table 28: Vietnam Hydrogen Gas Market Volume (Million) Forecast, by Application 2020 & 2033
- Table 29: Rest of Asia Pacific Hydrogen Gas Market Revenue (billion) Forecast, by Application 2020 & 2033
- Table 30: Rest of Asia Pacific Hydrogen Gas Market Volume (Million) Forecast, by Application 2020 & 2033
- Table 31: Global Hydrogen Gas Market Revenue billion Forecast, by Distribution 2020 & 2033
- Table 32: Global Hydrogen Gas Market Volume Million Forecast, by Distribution 2020 & 2033
- Table 33: Global Hydrogen Gas Market Revenue billion Forecast, by Application 2020 & 2033
- Table 34: Global Hydrogen Gas Market Volume Million Forecast, by Application 2020 & 2033
- Table 35: Global Hydrogen Gas Market Revenue billion Forecast, by Country 2020 & 2033
- Table 36: Global Hydrogen Gas Market Volume Million Forecast, by Country 2020 & 2033
- Table 37: United States Hydrogen Gas Market Revenue (billion) Forecast, by Application 2020 & 2033
- Table 38: United States Hydrogen Gas Market Volume (Million) Forecast, by Application 2020 & 2033
- Table 39: Canada Hydrogen Gas Market Revenue (billion) Forecast, by Application 2020 & 2033
- Table 40: Canada Hydrogen Gas Market Volume (Million) Forecast, by Application 2020 & 2033
- Table 41: Mexico Hydrogen Gas Market Revenue (billion) Forecast, by Application 2020 & 2033
- Table 42: Mexico Hydrogen Gas Market Volume (Million) Forecast, by Application 2020 & 2033
- Table 43: Global Hydrogen Gas Market Revenue billion Forecast, by Distribution 2020 & 2033
- Table 44: Global Hydrogen Gas Market Volume Million Forecast, by Distribution 2020 & 2033
- Table 45: Global Hydrogen Gas Market Revenue billion Forecast, by Application 2020 & 2033
- Table 46: Global Hydrogen Gas Market Volume Million Forecast, by Application 2020 & 2033
- Table 47: Global Hydrogen Gas Market Revenue billion Forecast, by Country 2020 & 2033
- Table 48: Global Hydrogen Gas Market Volume Million Forecast, by Country 2020 & 2033
- Table 49: Germany Hydrogen Gas Market Revenue (billion) Forecast, by Application 2020 & 2033
- Table 50: Germany Hydrogen Gas Market Volume (Million) Forecast, by Application 2020 & 2033
- Table 51: United Kingdom Hydrogen Gas Market Revenue (billion) Forecast, by Application 2020 & 2033
- Table 52: United Kingdom Hydrogen Gas Market Volume (Million) Forecast, by Application 2020 & 2033
- Table 53: Italy Hydrogen Gas Market Revenue (billion) Forecast, by Application 2020 & 2033
- Table 54: Italy Hydrogen Gas Market Volume (Million) Forecast, by Application 2020 & 2033
- Table 55: France Hydrogen Gas Market Revenue (billion) Forecast, by Application 2020 & 2033
- Table 56: France Hydrogen Gas Market Volume (Million) Forecast, by Application 2020 & 2033
- Table 57: Spain Hydrogen Gas Market Revenue (billion) Forecast, by Application 2020 & 2033
- Table 58: Spain Hydrogen Gas Market Volume (Million) Forecast, by Application 2020 & 2033
- Table 59: NORDIC Hydrogen Gas Market Revenue (billion) Forecast, by Application 2020 & 2033
- Table 60: NORDIC Hydrogen Gas Market Volume (Million) Forecast, by Application 2020 & 2033
- Table 61: Turkey Hydrogen Gas Market Revenue (billion) Forecast, by Application 2020 & 2033
- Table 62: Turkey Hydrogen Gas Market Volume (Million) Forecast, by Application 2020 & 2033
- Table 63: Russia Hydrogen Gas Market Revenue (billion) Forecast, by Application 2020 & 2033
- Table 64: Russia Hydrogen Gas Market Volume (Million) Forecast, by Application 2020 & 2033
- Table 65: Rest of Europe Hydrogen Gas Market Revenue (billion) Forecast, by Application 2020 & 2033
- Table 66: Rest of Europe Hydrogen Gas Market Volume (Million) Forecast, by Application 2020 & 2033
- Table 67: Global Hydrogen Gas Market Revenue billion Forecast, by Distribution 2020 & 2033
- Table 68: Global Hydrogen Gas Market Volume Million Forecast, by Distribution 2020 & 2033
- Table 69: Global Hydrogen Gas Market Revenue billion Forecast, by Application 2020 & 2033
- Table 70: Global Hydrogen Gas Market Volume Million Forecast, by Application 2020 & 2033
- Table 71: Global Hydrogen Gas Market Revenue billion Forecast, by Country 2020 & 2033
- Table 72: Global Hydrogen Gas Market Volume Million Forecast, by Country 2020 & 2033
- Table 73: Brazil Hydrogen Gas Market Revenue (billion) Forecast, by Application 2020 & 2033
- Table 74: Brazil Hydrogen Gas Market Volume (Million) Forecast, by Application 2020 & 2033
- Table 75: Argentina Hydrogen Gas Market Revenue (billion) Forecast, by Application 2020 & 2033
- Table 76: Argentina Hydrogen Gas Market Volume (Million) Forecast, by Application 2020 & 2033
- Table 77: Colombia Hydrogen Gas Market Revenue (billion) Forecast, by Application 2020 & 2033
- Table 78: Colombia Hydrogen Gas Market Volume (Million) Forecast, by Application 2020 & 2033
- Table 79: Rest of South America Hydrogen Gas Market Revenue (billion) Forecast, by Application 2020 & 2033
- Table 80: Rest of South America Hydrogen Gas Market Volume (Million) Forecast, by Application 2020 & 2033
- Table 81: Global Hydrogen Gas Market Revenue billion Forecast, by Distribution 2020 & 2033
- Table 82: Global Hydrogen Gas Market Volume Million Forecast, by Distribution 2020 & 2033
- Table 83: Global Hydrogen Gas Market Revenue billion Forecast, by Application 2020 & 2033
- Table 84: Global Hydrogen Gas Market Volume Million Forecast, by Application 2020 & 2033
- Table 85: Global Hydrogen Gas Market Revenue billion Forecast, by Country 2020 & 2033
- Table 86: Global Hydrogen Gas Market Volume Million Forecast, by Country 2020 & 2033
- Table 87: Saudi Arabia Hydrogen Gas Market Revenue (billion) Forecast, by Application 2020 & 2033
- Table 88: Saudi Arabia Hydrogen Gas Market Volume (Million) Forecast, by Application 2020 & 2033
- Table 89: South Africa Hydrogen Gas Market Revenue (billion) Forecast, by Application 2020 & 2033
- Table 90: South Africa Hydrogen Gas Market Volume (Million) Forecast, by Application 2020 & 2033
- Table 91: Nigeria Hydrogen Gas Market Revenue (billion) Forecast, by Application 2020 & 2033
- Table 92: Nigeria Hydrogen Gas Market Volume (Million) Forecast, by Application 2020 & 2033
- Table 93: Qatar Hydrogen Gas Market Revenue (billion) Forecast, by Application 2020 & 2033
- Table 94: Qatar Hydrogen Gas Market Volume (Million) Forecast, by Application 2020 & 2033
- Table 95: Egypt Hydrogen Gas Market Revenue (billion) Forecast, by Application 2020 & 2033
- Table 96: Egypt Hydrogen Gas Market Volume (Million) Forecast, by Application 2020 & 2033
- Table 97: United Arab Emirates Hydrogen Gas Market Revenue (billion) Forecast, by Application 2020 & 2033
- Table 98: United Arab Emirates Hydrogen Gas Market Volume (Million) Forecast, by Application 2020 & 2033
- Table 99: Rest of Middle East and Africa Hydrogen Gas Market Revenue (billion) Forecast, by Application 2020 & 2033
- Table 100: Rest of Middle East and Africa Hydrogen Gas Market Volume (Million) Forecast, by Application 2020 & 2033
Frequently Asked Questions
1. What is the projected Compound Annual Growth Rate (CAGR) of the Hydrogen Gas Market?
The projected CAGR is approximately 8.6%.
2. Which companies are prominent players in the Hydrogen Gas Market?
Key companies in the market include Equinor ASA, Air Products and Chemicals Inc, Universal Industrial Gases Inc *List Not Exhaustive, PAO NOVATEK, Gulf Cryo, Lords Chloro Alkali Limited, Gujarat Alkalies and Chemicals Limited, Matheson Tri-Gas Inc, BASF SE, Aditya Birla Chemicals, Linde plc, TAIYO NIPPON SANSO CORPORATION, Air Liquide, Messer SE & Co KGaA.
3. What are the main segments of the Hydrogen Gas Market?
The market segments include Distribution, Application.
4. Can you provide details about the market size?
The market size is estimated to be USD 204.86 billion as of 2022.
5. What are some drivers contributing to market growth?
Increasing Demand From Chemical Industry; Expanding Usage Of Hydrogen In Refinery.
6. What are the notable trends driving market growth?
Ammonia Production to Dominate the Market Demand.
7. Are there any restraints impacting market growth?
High Production Cost Of Blue And Green Hydrogen; High Transportation And Storage Cost.
8. Can you provide examples of recent developments in the market?
July 2022: Air Products and VPI (a power generator company) signed a joint development agreement for driving the 'Humber Hydrogen Hub' or 'H3', which seeks to develop an 800 MW low-carbon hydrogen production facility in Immingham, United Kingdom.
9. What pricing options are available for accessing the report?
Pricing options include single-user, multi-user, and enterprise licenses priced at USD 4750, USD 5250, and USD 8750 respectively.
10. Is the market size provided in terms of value or volume?
The market size is provided in terms of value, measured in billion and volume, measured in Million.
11. Are there any specific market keywords associated with the report?
Yes, the market keyword associated with the report is "Hydrogen Gas Market," which aids in identifying and referencing the specific market segment covered.
12. How do I determine which pricing option suits my needs best?
The pricing options vary based on user requirements and access needs. Individual users may opt for single-user licenses, while businesses requiring broader access may choose multi-user or enterprise licenses for cost-effective access to the report.
13. Are there any additional resources or data provided in the Hydrogen Gas Market report?
While the report offers comprehensive insights, it's advisable to review the specific contents or supplementary materials provided to ascertain if additional resources or data are available.
14. How can I stay updated on further developments or reports in the Hydrogen Gas Market?
To stay informed about further developments, trends, and reports in the Hydrogen Gas Market, consider subscribing to industry newsletters, following relevant companies and organizations, or regularly checking reputable industry news sources and publications.
Methodology
Step 1 - Identification of Relevant Samples Size from Population Database


Step 2 - Approaches for Defining Global Market Size (Value, Volume* & Price*)

Note*: In applicable scenarios
Step 3 - Data Sources
Primary Research
- Web Analytics
- Survey Reports
- Research Institute
- Latest Research Reports
- Opinion Leaders
Secondary Research
- Annual Reports
- White Paper
- Latest Press Release
- Industry Association
- Paid Database
- Investor Presentations

Step 4 - Data Triangulation
Involves using different sources of information in order to increase the validity of a study
These sources are likely to be stakeholders in a program - participants, other researchers, program staff, other community members, and so on.
Then we put all data in single framework & apply various statistical tools to find out the dynamic on the market.
During the analysis stage, feedback from the stakeholder groups would be compared to determine areas of agreement as well as areas of divergence