

Key Insights
The global hydrocolloid market is experiencing robust growth, projected to maintain a Compound Annual Growth Rate (CAGR) exceeding 6% from 2025 to 2033. This expansion is driven by several key factors. The increasing demand for processed foods, particularly in developing economies across Asia-Pacific and South America, fuels the need for hydrocolloids as stabilizers, thickeners, and gelling agents. The bakery and confectionery sector, along with meat and poultry processing, are significant consumers, contributing substantially to market volume. Furthermore, the rising consumer preference for convenient, ready-to-eat meals and the growing health and wellness sector (demand for clean-label ingredients) are boosting the demand for natural hydrocolloids like pectin and carrageenan. The market is segmented by source (natural and synthetic), type (gelatin, carrageenan, pectin, xanthan gum, guar gum, and others), and function (thickener, stabilizer, coating agent, fat replacer, and gelling agent), offering diverse application possibilities across various food and beverage industries. Major players like ADM, Cargill, and Ingredion are driving innovation and expanding their product portfolios to cater to evolving market needs. While supply chain disruptions and fluctuating raw material prices pose some challenges, the long-term outlook for the hydrocolloid market remains positive due to its integral role in modern food production and processing.
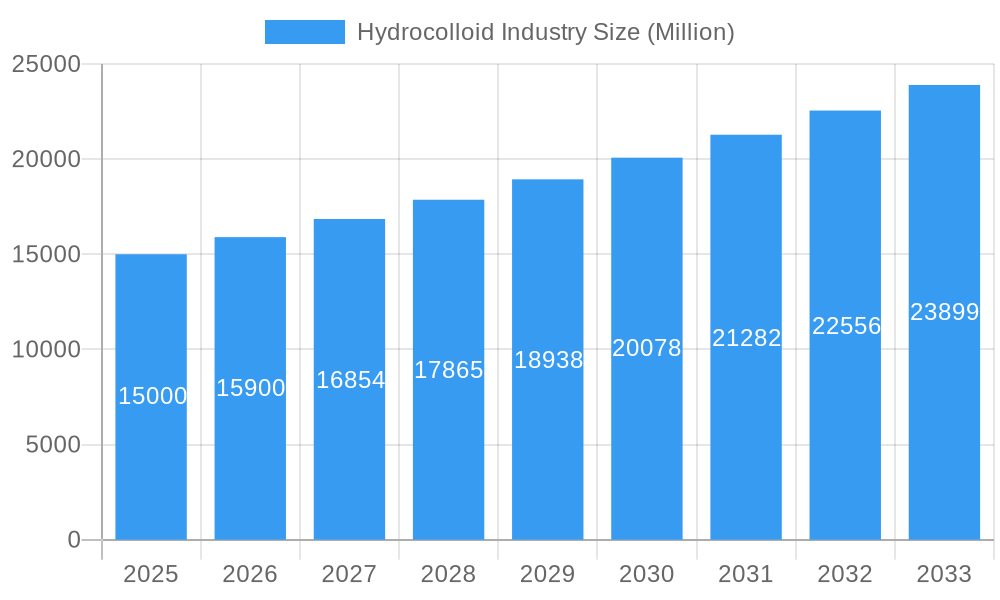
Hydrocolloid Industry Market Size (In Billion)
The competitive landscape is characterized by both large multinational corporations and specialized smaller producers. Established players leverage their extensive distribution networks and technological capabilities to maintain market share. However, smaller companies are increasingly focusing on niche applications and developing innovative hydrocolloid solutions, particularly in the natural and organic segments. Regional variations exist, with Asia-Pacific projected to hold a significant market share due to rapid economic growth and urbanization. North America and Europe maintain strong positions, driven by established food processing industries and high per capita consumption of processed food products. Future growth will depend on several factors, including technological advancements in hydrocolloid production, increased regulatory scrutiny of food additives, and the development of sustainable sourcing practices. The continuous evolution of consumer preferences and the rising awareness of clean-label ingredients will significantly influence the future trajectory of this market.
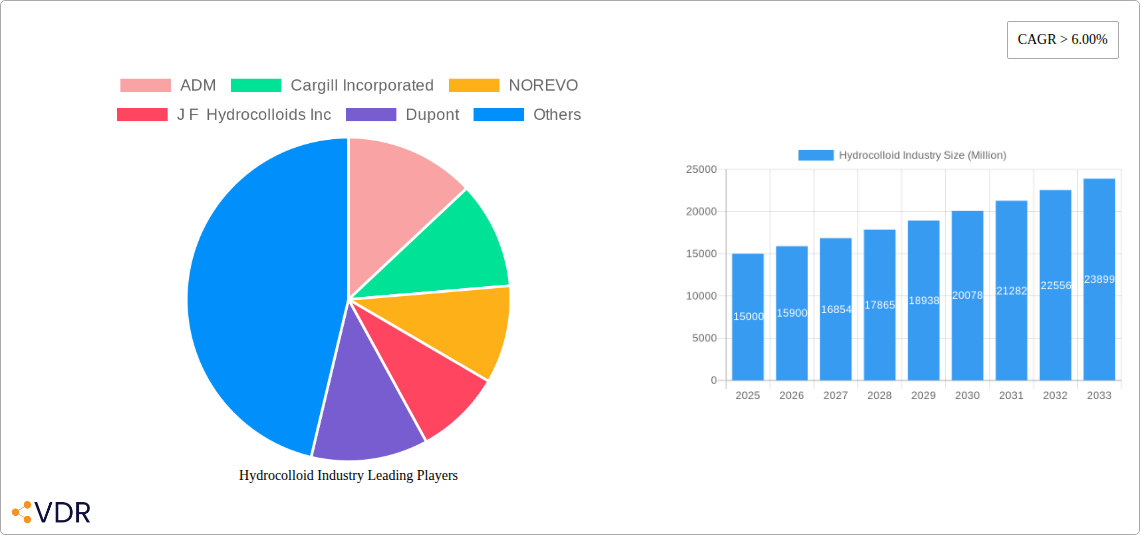
Hydrocolloid Industry Company Market Share
Hydrocolloid Industry Market Report: 2019-2033
This comprehensive report provides an in-depth analysis of the global hydrocolloid industry, encompassing market dynamics, growth trends, regional landscapes, and key player strategies. With a study period spanning 2019-2033, a base year of 2025, and a forecast period of 2025-2033, this report is an essential resource for industry professionals, investors, and strategic decision-makers. The report segments the market by application (Bakery & Confectionary, Meat & Poultry Products, Beverages, Sauces & Dressings, Dairy Products, Other Applications), source (Natural, Synthetic), type (Gelatin, Carrageenan, Pectin, Xanthum Gum, Guar Gum, Other Types), and function (Thickener, Stabilizer, Coating Agent, Fat Replacer, Gelling Agent). The global market size in 2025 is estimated at xx Million units.
Hydrocolloid Industry Market Dynamics & Structure
The hydrocolloid market is characterized by a moderately concentrated landscape, with major players such as ADM, Cargill Incorporated, and Ingredion Incorporated holding significant market share. The industry witnesses continuous technological innovation driven by the demand for enhanced functionalities and cost-effectiveness. Stringent regulatory frameworks concerning food safety and labeling influence product development and market access. Competitive pressures from substitutes, particularly synthetic alternatives, and evolving consumer preferences shape the market trajectory. Mergers and acquisitions (M&A) activity plays a crucial role in shaping the competitive landscape and expanding market reach.
- Market Concentration: Top 5 players hold approximately xx% market share in 2025.
- Technological Innovation: Focus on sustainable sourcing, improved functionalities (e.g., cleaner labels), and cost-effective production methods.
- Regulatory Landscape: Compliance with food safety regulations (e.g., FDA, EFSA) influences market access and product development.
- Competitive Substitutes: Synthetic hydrocolloids offer cost advantages, while natural alternatives gain traction due to increasing consumer demand for clean labels.
- M&A Activity: Significant M&A activity observed in recent years (e.g., IFF-DuPont merger) leading to market consolidation and expanded product portfolios. xx M&A deals were recorded between 2019-2024.
- End-user Demographics: Growing demand from food & beverage, pharmaceutical, and personal care industries.
Hydrocolloid Industry Growth Trends & Insights
The global hydrocolloid market is experiencing robust and sustained expansion, a trend propelled by several key drivers. The escalating demand for convenience and processed foods worldwide, coupled with a growing segment of health-conscious consumers actively seeking natural and functional ingredients, are primary catalysts. Furthermore, significant advancements in food technology are enabling the development and application of hydrocolloids in novel ways. The market demonstrated a compound annual growth rate (CAGR) of **[Insert historical CAGR here]**% during the period of 2019-2024. Projections indicate this impressive growth trajectory will continue, with an anticipated CAGR of **[Insert forecast CAGR here]**% during the forecast period of 2025-2033, culminating in an estimated market value of **[Insert market value by 2033 here]** Million units by 2033. This growth is further bolstered by increasing adoption rates across a diverse array of applications, with the food and beverage sector remaining a dominant force. Technological disruptions, including the creation of novel hydrocolloids with precisely tailored functionalities and improved performance characteristics, are actively contributing to market expansion. Concurrently, evolving consumer behaviors that favor healthier and more convenient food options are directly fueling the demand for hydrocolloids as indispensable functional ingredients. Market penetration rates are on the rise across all key geographical regions, with particularly dynamic growth observed in emerging economies.
Dominant Regions, Countries, or Segments in Hydrocolloid Industry
North America currently dominates the hydrocolloid market, followed by Europe and Asia-Pacific. Within applications, the Bakery and Confectionary segment holds the largest market share due to the widespread use of hydrocolloids as stabilizers, thickeners, and gelling agents. Natural sources of hydrocolloids are gaining popularity compared to synthetic ones, driven by growing consumer preference for clean-label products. Gelatin, carrageenan, and pectin remain the leading hydrocolloid types in terms of market volume.
- Key Drivers:
- Strong demand from the food and beverage sector in developed regions.
- Growing awareness of the functional benefits of hydrocolloids.
- Rising adoption in emerging markets.
- Favorable government policies promoting food processing industries.
- Dominance Factors:
- High consumption of processed foods in developed economies.
- Well-established supply chains and manufacturing infrastructure.
- Early adoption of advanced technologies in food processing.
- Stringent food safety regulations in certain regions.
Hydrocolloid Industry Product Landscape
The product landscape within the hydrocolloid industry is characterized by continuous innovation and a strong emphasis on meeting evolving market demands. Recent advancements highlight the development of hydrocolloids engineered with highly tailored functionalities, enabling precise control over texture, viscosity, gelling, and stabilization in various food systems. A significant trend shaping product development is the increasing focus on sustainable sourcing and the implementation of eco-friendly production methodologies, reflecting a commitment to environmental responsibility. Companies are strategically prioritizing the development of clean-label ingredients, directly responding to consumer preferences for natural, minimally processed, and healthy food products. These ongoing innovations and product refinements significantly enhance the inherent versatility and broaden the spectrum of applications for hydrocolloids across a multitude of industries.
Key Drivers, Barriers & Challenges in Hydrocolloid Industry
Key Drivers: Growing demand from the food industry, rising consumer awareness of health benefits, and technological advancements driving product innovation. The increasing demand for processed food and convenience food is creating opportunities for the growth of this market. Government regulations emphasizing clean labeling and natural ingredients are further contributing to the demand for natural hydrocolloids.
Key Challenges: Fluctuations in raw material prices, stringent regulatory compliance requirements, and intense competition from synthetic alternatives pose significant challenges. Supply chain disruptions, especially in sourcing raw materials, can impact production and pricing. Increased regulatory scrutiny in various regions necessitates high compliance costs.
Emerging Opportunities in Hydrocolloid Industry
Untapped markets in developing countries present significant growth opportunities. Emerging applications in areas like pharmaceuticals and personal care offer potential for market expansion. Innovation in novel hydrocolloids with specific functionalities to meet diverse consumer needs, such as gluten-free and allergen-free options, presents a growing opportunity.
Growth Accelerators in the Hydrocolloid Industry Industry
Several key factors are acting as significant growth accelerators for the hydrocolloid industry. Technological breakthroughs, particularly in the development of advanced bio-based hydrocolloids and innovative approaches like precision fermentation, are setting the stage for substantial long-term growth. Strategic collaborations and partnerships formed between leading hydrocolloid manufacturers and prominent food processors are crucial in fostering synergistic product development and facilitating market expansion. The continually growing demand for clean-label products in health-conscious markets, driven by informed consumer choices, further intensifies market expansion efforts and investment.
Key Players Shaping the Hydrocolloid Industry Market
- ADM
- Cargill Incorporated
- NOREVO
- J F Hydrocolloids Inc
- Dupont
- Ashland
- DSM
- AGARMEX SA DE CV
- Ingredion Incorporated
- B Braun Melsungen AG
- Tate & Lyle
- CP Kelco U S Inc
Notable Milestones in Hydrocolloid Industry Sector
- September 2021: Ingredion signed a new strategic distribution agreement with Batory Foods, expanding its reach in the US.
- February 2021: IFF completed its merger with DuPont's Nutrition & Biosciences business, creating a larger player in the industry.
- September 2020: W Hydrocolloids Inc. acquired Cargill's stake in Philippine Bio-Industries Inc., impacting the carrageenan market.
In-Depth Hydrocolloid Industry Market Outlook
The outlook for the hydrocolloid market remains exceptionally positive, signaling a period of continued and dynamic growth. This expansion will be primarily shaped by relentless innovation in product development, the strategic formation of impactful collaborations, and the successful penetration into an ever-widening array of new applications. The overarching industry trends of sustainable sourcing, the production of clean-label ingredients, and the delivery of customized functionalities will be paramount in defining future market dynamics. Furthermore, strategic mergers, acquisitions, and partnerships are expected to play a significant role in consolidating the market landscape and driving efficiency. The substantial potential for market expansion within emerging economies, coupled with the exploration of novel applications in specialized niche sectors, presents compelling and significant long-term growth opportunities for the hydrocolloid industry.
Hydrocolloid Industry Segmentation
-
1. Source
- 1.1. Natural
- 1.2. Synthetic
-
2. Type
- 2.1. Gelatin
- 2.2. Carrageenan
- 2.3. Pectin
- 2.4. Xanthum Gum
- 2.5. Guar Gum
- 2.6. Other Types
-
3. Function
- 3.1. Thickener
- 3.2. Stablizer
- 3.3. Coating Agent
- 3.4. Fat Replacer
- 3.5. Gelling Agent
-
4. Application
- 4.1. Bakery and Confectionary
- 4.2. Meat and Poultry Products
- 4.3. Beverages
- 4.4. Sauces and Dressings
- 4.5. Dairy Products
- 4.6. Other Applications
Hydrocolloid Industry Segmentation By Geography
-
1. Asia Pacific
- 1.1. China
- 1.2. India
- 1.3. Japan
- 1.4. South Korea
- 1.5. Rest of Asia Pacific
-
2. North America
- 2.1. United States
- 2.2. Canada
- 2.3. Mexico
-
3. Europe
- 3.1. Germany
- 3.2. United Kingdom
- 3.3. Italy
- 3.4. France
- 3.5. Rest of Europe
-
4. South America
- 4.1. Brazil
- 4.2. Argentina
- 4.3. Rest of South America
-
5. Middle East and Africa
- 5.1. Saudi Arabia
- 5.2. South Africa
- 5.3. Rest of Middle East and Africa
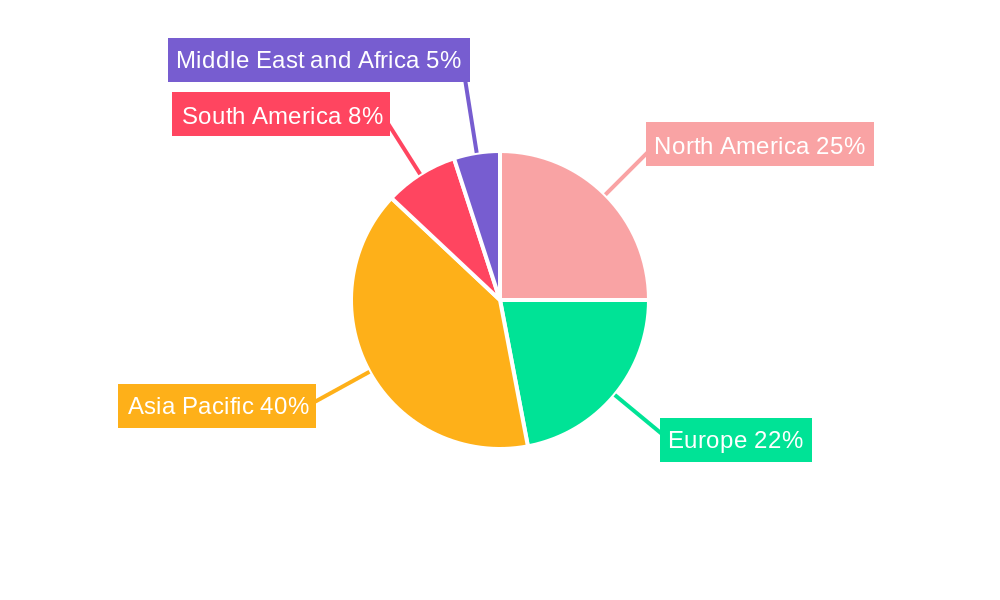
Hydrocolloid Industry Regional Market Share
Geographic Coverage of Hydrocolloid Industry
Hydrocolloid Industry REPORT HIGHLIGHTS
| Aspects | Details |
|---|---|
| Study Period | 2020-2034 |
| Base Year | 2025 |
| Estimated Year | 2026 |
| Forecast Period | 2026-2034 |
| Historical Period | 2020-2025 |
| Growth Rate | CAGR of 5% from 2020-2034 |
| Segmentation |
|
Table of Contents
- 1. Introduction
- 1.1. Research Scope
- 1.2. Market Segmentation
- 1.3. Research Objective
- 1.4. Definitions and Assumptions
- 2. Executive Summary
- 2.1. Market Snapshot
- 3. Market Dynamics
- 3.1. Market Drivers
- 3.2. Market Restrains
- 3.3. Market Trends
- 3.4. Market Opportunities
- 4. Market Factor Analysis
- 4.1. Porters Five Forces
- 4.1.1. Bargaining Power of Suppliers
- 4.1.2. Bargaining Power of Buyers
- 4.1.3. Threat of New Entrants
- 4.1.4. Threat of Substitutes
- 4.1.5. Competitive Rivalry
- 4.2. PESTEL analysis
- 4.3. BCG Analysis
- 4.3.1. Stars (High Growth, High Market Share)
- 4.3.2. Cash Cows (Low Growth, High Market Share)
- 4.3.3. Question Mark (High Growth, Low Market Share)
- 4.3.4. Dogs (Low Growth, Low Market Share)
- 4.4. Ansoff Matrix Analysis
- 4.5. Supply Chain Analysis
- 4.6. Regulatory Landscape
- 4.7. Current Market Potential and Opportunity Assessment (TAM–SAM–SOM Framework)
- 4.8. VDR Analyst Note
- 4.1. Porters Five Forces
- 5. Market Analysis, Insights and Forecast 2021-2033
- 5.1. Market Analysis, Insights and Forecast - by Source
- 5.1.1. Natural
- 5.1.2. Synthetic
- 5.2. Market Analysis, Insights and Forecast - by Type
- 5.2.1. Gelatin
- 5.2.2. Carrageenan
- 5.2.3. Pectin
- 5.2.4. Xanthum Gum
- 5.2.5. Guar Gum
- 5.2.6. Other Types
- 5.3. Market Analysis, Insights and Forecast - by Function
- 5.3.1. Thickener
- 5.3.2. Stablizer
- 5.3.3. Coating Agent
- 5.3.4. Fat Replacer
- 5.3.5. Gelling Agent
- 5.4. Market Analysis, Insights and Forecast - by Application
- 5.4.1. Bakery and Confectionary
- 5.4.2. Meat and Poultry Products
- 5.4.3. Beverages
- 5.4.4. Sauces and Dressings
- 5.4.5. Dairy Products
- 5.4.6. Other Applications
- 5.5. Market Analysis, Insights and Forecast - by Region
- 5.5.1. Asia Pacific
- 5.5.2. North America
- 5.5.3. Europe
- 5.5.4. South America
- 5.5.5. Middle East and Africa
- 5.1. Market Analysis, Insights and Forecast - by Source
- 6. Global Hydrocolloid Industry Analysis, Insights and Forecast, 2021-2033
- 6.1. Market Analysis, Insights and Forecast - by Source
- 6.1.1. Natural
- 6.1.2. Synthetic
- 6.2. Market Analysis, Insights and Forecast - by Type
- 6.2.1. Gelatin
- 6.2.2. Carrageenan
- 6.2.3. Pectin
- 6.2.4. Xanthum Gum
- 6.2.5. Guar Gum
- 6.2.6. Other Types
- 6.3. Market Analysis, Insights and Forecast - by Function
- 6.3.1. Thickener
- 6.3.2. Stablizer
- 6.3.3. Coating Agent
- 6.3.4. Fat Replacer
- 6.3.5. Gelling Agent
- 6.4. Market Analysis, Insights and Forecast - by Application
- 6.4.1. Bakery and Confectionary
- 6.4.2. Meat and Poultry Products
- 6.4.3. Beverages
- 6.4.4. Sauces and Dressings
- 6.4.5. Dairy Products
- 6.4.6. Other Applications
- 6.1. Market Analysis, Insights and Forecast - by Source
- 7. Asia Pacific Hydrocolloid Industry Analysis, Insights and Forecast, 2021-2033
- 7.1. Market Analysis, Insights and Forecast - by Source
- 7.1.1. Natural
- 7.1.2. Synthetic
- 7.2. Market Analysis, Insights and Forecast - by Type
- 7.2.1. Gelatin
- 7.2.2. Carrageenan
- 7.2.3. Pectin
- 7.2.4. Xanthum Gum
- 7.2.5. Guar Gum
- 7.2.6. Other Types
- 7.3. Market Analysis, Insights and Forecast - by Function
- 7.3.1. Thickener
- 7.3.2. Stablizer
- 7.3.3. Coating Agent
- 7.3.4. Fat Replacer
- 7.3.5. Gelling Agent
- 7.4. Market Analysis, Insights and Forecast - by Application
- 7.4.1. Bakery and Confectionary
- 7.4.2. Meat and Poultry Products
- 7.4.3. Beverages
- 7.4.4. Sauces and Dressings
- 7.4.5. Dairy Products
- 7.4.6. Other Applications
- 7.1. Market Analysis, Insights and Forecast - by Source
- 8. North America Hydrocolloid Industry Analysis, Insights and Forecast, 2021-2033
- 8.1. Market Analysis, Insights and Forecast - by Source
- 8.1.1. Natural
- 8.1.2. Synthetic
- 8.2. Market Analysis, Insights and Forecast - by Type
- 8.2.1. Gelatin
- 8.2.2. Carrageenan
- 8.2.3. Pectin
- 8.2.4. Xanthum Gum
- 8.2.5. Guar Gum
- 8.2.6. Other Types
- 8.3. Market Analysis, Insights and Forecast - by Function
- 8.3.1. Thickener
- 8.3.2. Stablizer
- 8.3.3. Coating Agent
- 8.3.4. Fat Replacer
- 8.3.5. Gelling Agent
- 8.4. Market Analysis, Insights and Forecast - by Application
- 8.4.1. Bakery and Confectionary
- 8.4.2. Meat and Poultry Products
- 8.4.3. Beverages
- 8.4.4. Sauces and Dressings
- 8.4.5. Dairy Products
- 8.4.6. Other Applications
- 8.1. Market Analysis, Insights and Forecast - by Source
- 9. Europe Hydrocolloid Industry Analysis, Insights and Forecast, 2021-2033
- 9.1. Market Analysis, Insights and Forecast - by Source
- 9.1.1. Natural
- 9.1.2. Synthetic
- 9.2. Market Analysis, Insights and Forecast - by Type
- 9.2.1. Gelatin
- 9.2.2. Carrageenan
- 9.2.3. Pectin
- 9.2.4. Xanthum Gum
- 9.2.5. Guar Gum
- 9.2.6. Other Types
- 9.3. Market Analysis, Insights and Forecast - by Function
- 9.3.1. Thickener
- 9.3.2. Stablizer
- 9.3.3. Coating Agent
- 9.3.4. Fat Replacer
- 9.3.5. Gelling Agent
- 9.4. Market Analysis, Insights and Forecast - by Application
- 9.4.1. Bakery and Confectionary
- 9.4.2. Meat and Poultry Products
- 9.4.3. Beverages
- 9.4.4. Sauces and Dressings
- 9.4.5. Dairy Products
- 9.4.6. Other Applications
- 9.1. Market Analysis, Insights and Forecast - by Source
- 10. South America Hydrocolloid Industry Analysis, Insights and Forecast, 2021-2033
- 10.1. Market Analysis, Insights and Forecast - by Source
- 10.1.1. Natural
- 10.1.2. Synthetic
- 10.2. Market Analysis, Insights and Forecast - by Type
- 10.2.1. Gelatin
- 10.2.2. Carrageenan
- 10.2.3. Pectin
- 10.2.4. Xanthum Gum
- 10.2.5. Guar Gum
- 10.2.6. Other Types
- 10.3. Market Analysis, Insights and Forecast - by Function
- 10.3.1. Thickener
- 10.3.2. Stablizer
- 10.3.3. Coating Agent
- 10.3.4. Fat Replacer
- 10.3.5. Gelling Agent
- 10.4. Market Analysis, Insights and Forecast - by Application
- 10.4.1. Bakery and Confectionary
- 10.4.2. Meat and Poultry Products
- 10.4.3. Beverages
- 10.4.4. Sauces and Dressings
- 10.4.5. Dairy Products
- 10.4.6. Other Applications
- 10.1. Market Analysis, Insights and Forecast - by Source
- 11. Middle East and Africa Hydrocolloid Industry Analysis, Insights and Forecast, 2021-2033
- 11.1. Market Analysis, Insights and Forecast - by Source
- 11.1.1. Natural
- 11.1.2. Synthetic
- 11.2. Market Analysis, Insights and Forecast - by Type
- 11.2.1. Gelatin
- 11.2.2. Carrageenan
- 11.2.3. Pectin
- 11.2.4. Xanthum Gum
- 11.2.5. Guar Gum
- 11.2.6. Other Types
- 11.3. Market Analysis, Insights and Forecast - by Function
- 11.3.1. Thickener
- 11.3.2. Stablizer
- 11.3.3. Coating Agent
- 11.3.4. Fat Replacer
- 11.3.5. Gelling Agent
- 11.4. Market Analysis, Insights and Forecast - by Application
- 11.4.1. Bakery and Confectionary
- 11.4.2. Meat and Poultry Products
- 11.4.3. Beverages
- 11.4.4. Sauces and Dressings
- 11.4.5. Dairy Products
- 11.4.6. Other Applications
- 11.1. Market Analysis, Insights and Forecast - by Source
- 12. Competitive Analysis
- 12.1. Company Profiles
- 12.1.1 ADM
- 12.1.1.1. Company Overview
- 12.1.1.2. Products
- 12.1.1.3. Company Financials
- 12.1.1.4. SWOT Analysis
- 12.1.2 Cargill Incorporated
- 12.1.2.1. Company Overview
- 12.1.2.2. Products
- 12.1.2.3. Company Financials
- 12.1.2.4. SWOT Analysis
- 12.1.3 NOREVO
- 12.1.3.1. Company Overview
- 12.1.3.2. Products
- 12.1.3.3. Company Financials
- 12.1.3.4. SWOT Analysis
- 12.1.4 J F Hydrocolloids Inc
- 12.1.4.1. Company Overview
- 12.1.4.2. Products
- 12.1.4.3. Company Financials
- 12.1.4.4. SWOT Analysis
- 12.1.5 Dupont
- 12.1.5.1. Company Overview
- 12.1.5.2. Products
- 12.1.5.3. Company Financials
- 12.1.5.4. SWOT Analysis
- 12.1.6 Ashland
- 12.1.6.1. Company Overview
- 12.1.6.2. Products
- 12.1.6.3. Company Financials
- 12.1.6.4. SWOT Analysis
- 12.1.7 DSM
- 12.1.7.1. Company Overview
- 12.1.7.2. Products
- 12.1.7.3. Company Financials
- 12.1.7.4. SWOT Analysis
- 12.1.8 AGARMEX SA DE CV
- 12.1.8.1. Company Overview
- 12.1.8.2. Products
- 12.1.8.3. Company Financials
- 12.1.8.4. SWOT Analysis
- 12.1.9 Ingredion Incorporated
- 12.1.9.1. Company Overview
- 12.1.9.2. Products
- 12.1.9.3. Company Financials
- 12.1.9.4. SWOT Analysis
- 12.1.10 B Braun Melsungen AG
- 12.1.10.1. Company Overview
- 12.1.10.2. Products
- 12.1.10.3. Company Financials
- 12.1.10.4. SWOT Analysis
- 12.1.11 Tate & Lyle*List Not Exhaustive
- 12.1.11.1. Company Overview
- 12.1.11.2. Products
- 12.1.11.3. Company Financials
- 12.1.11.4. SWOT Analysis
- 12.1.12 CP Kelco U S Inc
- 12.1.12.1. Company Overview
- 12.1.12.2. Products
- 12.1.12.3. Company Financials
- 12.1.12.4. SWOT Analysis
- 12.1.1 ADM
- 12.2. Market Entropy
- 12.2.1 Company's Key Areas Served
- 12.2.2 Recent Developments
- 12.3. Company Market Share Analysis 2025
- 12.3.1 Top 5 Companies Market Share Analysis
- 12.3.2 Top 3 Companies Market Share Analysis
- 12.4. List of Potential Customers
- 13. Research Methodology
List of Figures
- Figure 1: Global Hydrocolloid Industry Revenue Breakdown (million, %) by Region 2025 & 2033
- Figure 2: Asia Pacific Hydrocolloid Industry Revenue (million), by Source 2025 & 2033
- Figure 3: Asia Pacific Hydrocolloid Industry Revenue Share (%), by Source 2025 & 2033
- Figure 4: Asia Pacific Hydrocolloid Industry Revenue (million), by Type 2025 & 2033
- Figure 5: Asia Pacific Hydrocolloid Industry Revenue Share (%), by Type 2025 & 2033
- Figure 6: Asia Pacific Hydrocolloid Industry Revenue (million), by Function 2025 & 2033
- Figure 7: Asia Pacific Hydrocolloid Industry Revenue Share (%), by Function 2025 & 2033
- Figure 8: Asia Pacific Hydrocolloid Industry Revenue (million), by Application 2025 & 2033
- Figure 9: Asia Pacific Hydrocolloid Industry Revenue Share (%), by Application 2025 & 2033
- Figure 10: Asia Pacific Hydrocolloid Industry Revenue (million), by Country 2025 & 2033
- Figure 11: Asia Pacific Hydrocolloid Industry Revenue Share (%), by Country 2025 & 2033
- Figure 12: North America Hydrocolloid Industry Revenue (million), by Source 2025 & 2033
- Figure 13: North America Hydrocolloid Industry Revenue Share (%), by Source 2025 & 2033
- Figure 14: North America Hydrocolloid Industry Revenue (million), by Type 2025 & 2033
- Figure 15: North America Hydrocolloid Industry Revenue Share (%), by Type 2025 & 2033
- Figure 16: North America Hydrocolloid Industry Revenue (million), by Function 2025 & 2033
- Figure 17: North America Hydrocolloid Industry Revenue Share (%), by Function 2025 & 2033
- Figure 18: North America Hydrocolloid Industry Revenue (million), by Application 2025 & 2033
- Figure 19: North America Hydrocolloid Industry Revenue Share (%), by Application 2025 & 2033
- Figure 20: North America Hydrocolloid Industry Revenue (million), by Country 2025 & 2033
- Figure 21: North America Hydrocolloid Industry Revenue Share (%), by Country 2025 & 2033
- Figure 22: Europe Hydrocolloid Industry Revenue (million), by Source 2025 & 2033
- Figure 23: Europe Hydrocolloid Industry Revenue Share (%), by Source 2025 & 2033
- Figure 24: Europe Hydrocolloid Industry Revenue (million), by Type 2025 & 2033
- Figure 25: Europe Hydrocolloid Industry Revenue Share (%), by Type 2025 & 2033
- Figure 26: Europe Hydrocolloid Industry Revenue (million), by Function 2025 & 2033
- Figure 27: Europe Hydrocolloid Industry Revenue Share (%), by Function 2025 & 2033
- Figure 28: Europe Hydrocolloid Industry Revenue (million), by Application 2025 & 2033
- Figure 29: Europe Hydrocolloid Industry Revenue Share (%), by Application 2025 & 2033
- Figure 30: Europe Hydrocolloid Industry Revenue (million), by Country 2025 & 2033
- Figure 31: Europe Hydrocolloid Industry Revenue Share (%), by Country 2025 & 2033
- Figure 32: South America Hydrocolloid Industry Revenue (million), by Source 2025 & 2033
- Figure 33: South America Hydrocolloid Industry Revenue Share (%), by Source 2025 & 2033
- Figure 34: South America Hydrocolloid Industry Revenue (million), by Type 2025 & 2033
- Figure 35: South America Hydrocolloid Industry Revenue Share (%), by Type 2025 & 2033
- Figure 36: South America Hydrocolloid Industry Revenue (million), by Function 2025 & 2033
- Figure 37: South America Hydrocolloid Industry Revenue Share (%), by Function 2025 & 2033
- Figure 38: South America Hydrocolloid Industry Revenue (million), by Application 2025 & 2033
- Figure 39: South America Hydrocolloid Industry Revenue Share (%), by Application 2025 & 2033
- Figure 40: South America Hydrocolloid Industry Revenue (million), by Country 2025 & 2033
- Figure 41: South America Hydrocolloid Industry Revenue Share (%), by Country 2025 & 2033
- Figure 42: Middle East and Africa Hydrocolloid Industry Revenue (million), by Source 2025 & 2033
- Figure 43: Middle East and Africa Hydrocolloid Industry Revenue Share (%), by Source 2025 & 2033
- Figure 44: Middle East and Africa Hydrocolloid Industry Revenue (million), by Type 2025 & 2033
- Figure 45: Middle East and Africa Hydrocolloid Industry Revenue Share (%), by Type 2025 & 2033
- Figure 46: Middle East and Africa Hydrocolloid Industry Revenue (million), by Function 2025 & 2033
- Figure 47: Middle East and Africa Hydrocolloid Industry Revenue Share (%), by Function 2025 & 2033
- Figure 48: Middle East and Africa Hydrocolloid Industry Revenue (million), by Application 2025 & 2033
- Figure 49: Middle East and Africa Hydrocolloid Industry Revenue Share (%), by Application 2025 & 2033
- Figure 50: Middle East and Africa Hydrocolloid Industry Revenue (million), by Country 2025 & 2033
- Figure 51: Middle East and Africa Hydrocolloid Industry Revenue Share (%), by Country 2025 & 2033
List of Tables
- Table 1: Global Hydrocolloid Industry Revenue million Forecast, by Source 2020 & 2033
- Table 2: Global Hydrocolloid Industry Revenue million Forecast, by Type 2020 & 2033
- Table 3: Global Hydrocolloid Industry Revenue million Forecast, by Function 2020 & 2033
- Table 4: Global Hydrocolloid Industry Revenue million Forecast, by Application 2020 & 2033
- Table 5: Global Hydrocolloid Industry Revenue million Forecast, by Region 2020 & 2033
- Table 6: Global Hydrocolloid Industry Revenue million Forecast, by Source 2020 & 2033
- Table 7: Global Hydrocolloid Industry Revenue million Forecast, by Type 2020 & 2033
- Table 8: Global Hydrocolloid Industry Revenue million Forecast, by Function 2020 & 2033
- Table 9: Global Hydrocolloid Industry Revenue million Forecast, by Application 2020 & 2033
- Table 10: Global Hydrocolloid Industry Revenue million Forecast, by Country 2020 & 2033
- Table 11: China Hydrocolloid Industry Revenue (million) Forecast, by Application 2020 & 2033
- Table 12: India Hydrocolloid Industry Revenue (million) Forecast, by Application 2020 & 2033
- Table 13: Japan Hydrocolloid Industry Revenue (million) Forecast, by Application 2020 & 2033
- Table 14: South Korea Hydrocolloid Industry Revenue (million) Forecast, by Application 2020 & 2033
- Table 15: Rest of Asia Pacific Hydrocolloid Industry Revenue (million) Forecast, by Application 2020 & 2033
- Table 16: Global Hydrocolloid Industry Revenue million Forecast, by Source 2020 & 2033
- Table 17: Global Hydrocolloid Industry Revenue million Forecast, by Type 2020 & 2033
- Table 18: Global Hydrocolloid Industry Revenue million Forecast, by Function 2020 & 2033
- Table 19: Global Hydrocolloid Industry Revenue million Forecast, by Application 2020 & 2033
- Table 20: Global Hydrocolloid Industry Revenue million Forecast, by Country 2020 & 2033
- Table 21: United States Hydrocolloid Industry Revenue (million) Forecast, by Application 2020 & 2033
- Table 22: Canada Hydrocolloid Industry Revenue (million) Forecast, by Application 2020 & 2033
- Table 23: Mexico Hydrocolloid Industry Revenue (million) Forecast, by Application 2020 & 2033
- Table 24: Global Hydrocolloid Industry Revenue million Forecast, by Source 2020 & 2033
- Table 25: Global Hydrocolloid Industry Revenue million Forecast, by Type 2020 & 2033
- Table 26: Global Hydrocolloid Industry Revenue million Forecast, by Function 2020 & 2033
- Table 27: Global Hydrocolloid Industry Revenue million Forecast, by Application 2020 & 2033
- Table 28: Global Hydrocolloid Industry Revenue million Forecast, by Country 2020 & 2033
- Table 29: Germany Hydrocolloid Industry Revenue (million) Forecast, by Application 2020 & 2033
- Table 30: United Kingdom Hydrocolloid Industry Revenue (million) Forecast, by Application 2020 & 2033
- Table 31: Italy Hydrocolloid Industry Revenue (million) Forecast, by Application 2020 & 2033
- Table 32: France Hydrocolloid Industry Revenue (million) Forecast, by Application 2020 & 2033
- Table 33: Rest of Europe Hydrocolloid Industry Revenue (million) Forecast, by Application 2020 & 2033
- Table 34: Global Hydrocolloid Industry Revenue million Forecast, by Source 2020 & 2033
- Table 35: Global Hydrocolloid Industry Revenue million Forecast, by Type 2020 & 2033
- Table 36: Global Hydrocolloid Industry Revenue million Forecast, by Function 2020 & 2033
- Table 37: Global Hydrocolloid Industry Revenue million Forecast, by Application 2020 & 2033
- Table 38: Global Hydrocolloid Industry Revenue million Forecast, by Country 2020 & 2033
- Table 39: Brazil Hydrocolloid Industry Revenue (million) Forecast, by Application 2020 & 2033
- Table 40: Argentina Hydrocolloid Industry Revenue (million) Forecast, by Application 2020 & 2033
- Table 41: Rest of South America Hydrocolloid Industry Revenue (million) Forecast, by Application 2020 & 2033
- Table 42: Global Hydrocolloid Industry Revenue million Forecast, by Source 2020 & 2033
- Table 43: Global Hydrocolloid Industry Revenue million Forecast, by Type 2020 & 2033
- Table 44: Global Hydrocolloid Industry Revenue million Forecast, by Function 2020 & 2033
- Table 45: Global Hydrocolloid Industry Revenue million Forecast, by Application 2020 & 2033
- Table 46: Global Hydrocolloid Industry Revenue million Forecast, by Country 2020 & 2033
- Table 47: Saudi Arabia Hydrocolloid Industry Revenue (million) Forecast, by Application 2020 & 2033
- Table 48: South Africa Hydrocolloid Industry Revenue (million) Forecast, by Application 2020 & 2033
- Table 49: Rest of Middle East and Africa Hydrocolloid Industry Revenue (million) Forecast, by Application 2020 & 2033
Frequently Asked Questions
1. What is the projected Compound Annual Growth Rate (CAGR) of the Hydrocolloid Industry?
The projected CAGR is approximately 5%.
2. Which companies are prominent players in the Hydrocolloid Industry?
Key companies in the market include ADM, Cargill Incorporated, NOREVO, J F Hydrocolloids Inc, Dupont, Ashland, DSM, AGARMEX SA DE CV, Ingredion Incorporated, B Braun Melsungen AG, Tate & Lyle*List Not Exhaustive, CP Kelco U S Inc.
3. What are the main segments of the Hydrocolloid Industry?
The market segments include Source, Type, Function, Application.
4. Can you provide details about the market size?
The market size is estimated to be USD 13614.8 million as of 2022.
5. What are some drivers contributing to market growth?
Growing Demand in the Food and Beverage Industry; Increased R&D and Innovations in Hydrocolloids.
6. What are the notable trends driving market growth?
Increasing Demand from the Gelatin Segment.
7. Are there any restraints impacting market growth?
Adherence to International Quality Standards and Regulations; Unfavorable Conditions Arising Due to the COVID-19 Outbreak.
8. Can you provide examples of recent developments in the market?
In September 2021, Ingredion signed a new strategic distribution agreement with Batory Foods that consolidates Ingredion's reach in the west and central midwest in the United States.
9. What pricing options are available for accessing the report?
Pricing options include single-user, multi-user, and enterprise licenses priced at USD 4750, USD 5250, and USD 8750 respectively.
10. Is the market size provided in terms of value or volume?
The market size is provided in terms of value, measured in million.
11. Are there any specific market keywords associated with the report?
Yes, the market keyword associated with the report is "Hydrocolloid Industry," which aids in identifying and referencing the specific market segment covered.
12. How do I determine which pricing option suits my needs best?
The pricing options vary based on user requirements and access needs. Individual users may opt for single-user licenses, while businesses requiring broader access may choose multi-user or enterprise licenses for cost-effective access to the report.
13. Are there any additional resources or data provided in the Hydrocolloid Industry report?
While the report offers comprehensive insights, it's advisable to review the specific contents or supplementary materials provided to ascertain if additional resources or data are available.
14. How can I stay updated on further developments or reports in the Hydrocolloid Industry?
To stay informed about further developments, trends, and reports in the Hydrocolloid Industry, consider subscribing to industry newsletters, following relevant companies and organizations, or regularly checking reputable industry news sources and publications.
Methodology
Step 1 - Identification of Relevant Samples Size from Population Database


Step 2 - Approaches for Defining Global Market Size (Value, Volume* & Price*)

Note*: In applicable scenarios
Step 3 - Data Sources
Primary Research
- Web Analytics
- Survey Reports
- Research Institute
- Latest Research Reports
- Opinion Leaders
Secondary Research
- Annual Reports
- White Paper
- Latest Press Release
- Industry Association
- Paid Database
- Investor Presentations

Step 4 - Data Triangulation
Involves using different sources of information in order to increase the validity of a study
These sources are likely to be stakeholders in a program - participants, other researchers, program staff, other community members, and so on.
Then we put all data in single framework & apply various statistical tools to find out the dynamic on the market.
During the analysis stage, feedback from the stakeholder groups would be compared to determine areas of agreement as well as areas of divergence