

Key Insights
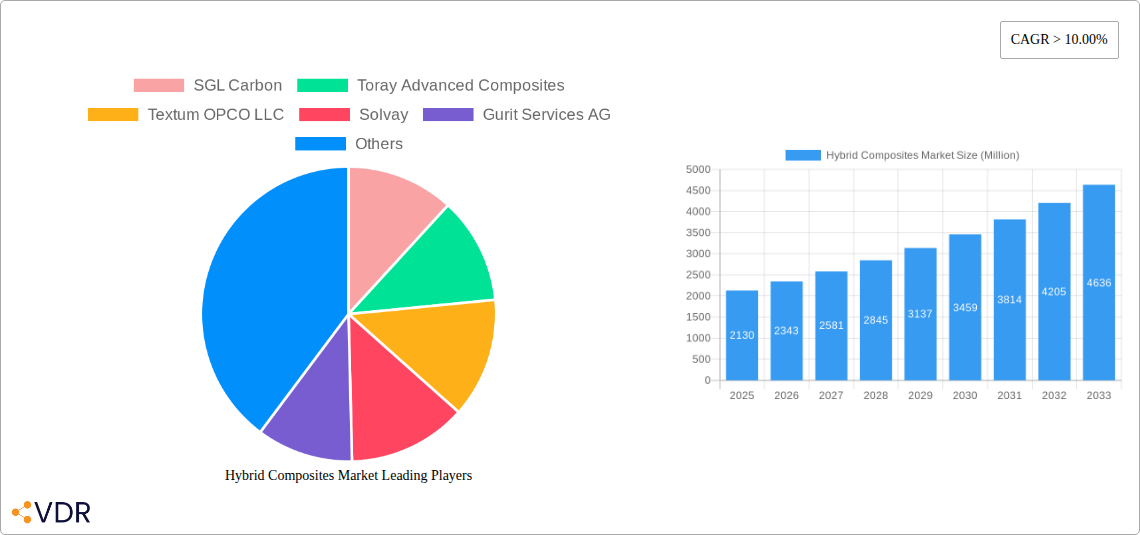
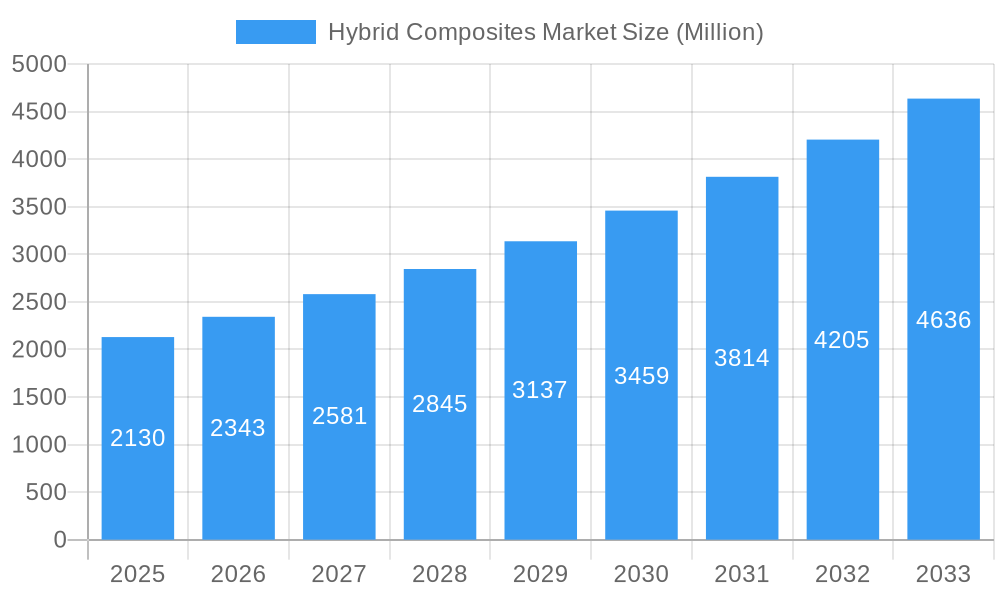
The global hybrid composites market, valued at $2.13 billion in 2025, is poised for robust growth, exhibiting a Compound Annual Growth Rate (CAGR) exceeding 10% from 2025 to 2033. This expansion is driven by several key factors. The increasing demand for lightweight yet high-strength materials across diverse industries, particularly automotive and aerospace, is a primary driver. Automotive manufacturers are increasingly adopting hybrid composites to improve fuel efficiency and reduce vehicle weight, aligning with global sustainability initiatives. Similarly, the aerospace sector leverages hybrid composites for their superior strength-to-weight ratio, enabling the creation of lighter and more fuel-efficient aircraft. Furthermore, the construction and infrastructure sectors are witnessing a rise in the adoption of hybrid composites for their durability and resistance to environmental factors, making them ideal for long-lasting structures. Technological advancements in resin formulations and fiber types, leading to improved performance characteristics like enhanced impact resistance and fatigue life, are further fueling market growth.
Hybrid Composites Market Market Size (In Billion)
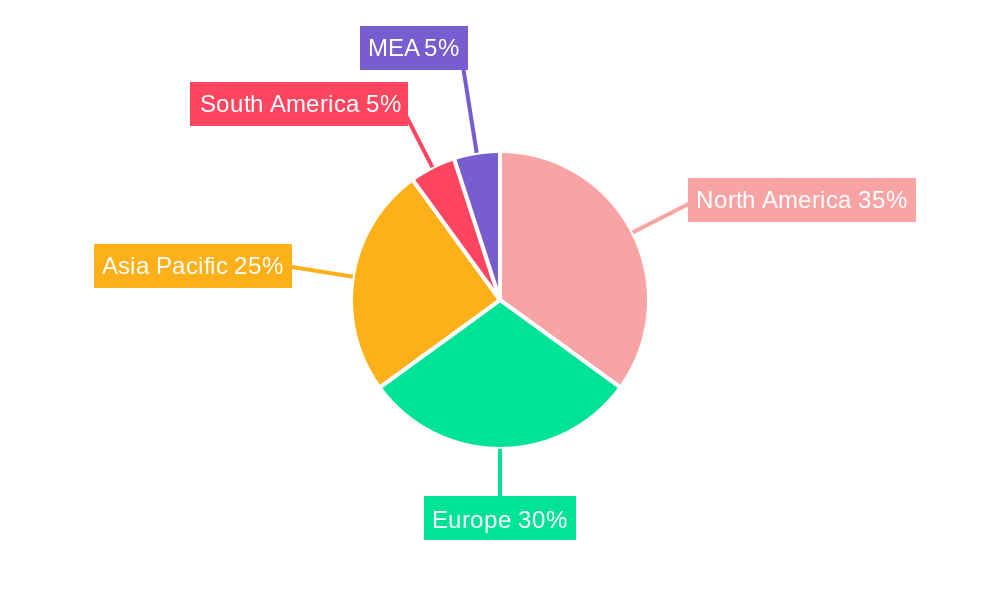
However, the market faces certain restraints. The relatively high cost of hybrid composites compared to traditional materials can limit adoption, especially in price-sensitive sectors. The complex manufacturing processes associated with hybrid composites also pose challenges, requiring specialized equipment and skilled labor. Nevertheless, ongoing research and development efforts aimed at reducing manufacturing costs and simplifying production techniques are expected to mitigate these limitations. The market segmentation reveals strong potential within the carbon/glass and carbon/aramid fiber types, driven by their favorable balance of properties and cost-effectiveness. Thermoset resins currently dominate the resin type segment, though thermoplastic resins are gaining traction due to their recyclability and potential for improved processing efficiency. Geographically, North America and Europe currently hold significant market shares, but the Asia-Pacific region is projected to experience the fastest growth, driven by burgeoning industrialization and increasing infrastructure development in countries like China and India.
Hybrid Composites Market Company Market Share
Hybrid Composites Market: A Comprehensive Market Report (2019-2033)
This in-depth report provides a comprehensive analysis of the Hybrid Composites market, encompassing market dynamics, growth trends, regional dominance, product landscape, key players, and future outlook. The report covers the period from 2019 to 2033, with a base year of 2025 and a forecast period from 2025 to 2033. The market is segmented by fiber type (Carbon/Glass, Carbon/Aramid, HMPP/Carbon, Wood/Plastic, Other Fiber Types), resin type (Thermoset Resins, Thermoplastic Resins, Other Resin Types), and end-user industry (Automotive and Transportation, Construction and Infrastructure, Aerospace and Defense, Marine, Other End-user Industries). This report is essential for industry professionals, investors, and anyone seeking a detailed understanding of this rapidly evolving market, valued at xx Million units in 2025 and projected to reach xx Million units by 2033.
Hybrid Composites Market Market Dynamics & Structure
The Hybrid Composites market is characterized by moderate concentration, with several key players holding significant market share. Technological innovation, particularly in fiber and resin technologies, is a major driver of growth. Stringent regulatory frameworks regarding material safety and environmental impact influence market dynamics. Competitive substitutes, such as traditional composites and alternative materials, pose challenges. End-user demographics, particularly in the automotive and construction sectors, significantly shape demand. M&A activity remains moderate, with xx deals recorded between 2019 and 2024, contributing to market consolidation.
- Market Concentration: Moderately concentrated, with top 5 players holding approximately xx% market share in 2025.
- Technological Innovation: Focus on lightweighting, improved strength-to-weight ratios, and enhanced durability.
- Regulatory Landscape: Stringent environmental regulations and safety standards influence material choices.
- Competitive Substitutes: Traditional composites and alternative materials pose competitive pressure.
- M&A Activity: xx deals recorded between 2019 and 2024, driven by market consolidation and technological acquisition.
- Innovation Barriers: High R&D costs and the complexity of material optimization hinder innovation.
Hybrid Composites Market Growth Trends & Insights
The Hybrid Composites market is experiencing significant growth, driven by increasing demand across various end-user industries. The market size expanded from xx Million units in 2019 to xx Million units in 2024, registering a CAGR of xx%. This growth is fueled by the rising adoption of hybrid composites in lightweighting applications within the automotive and aerospace sectors, infrastructure development, and the growing demand for high-performance materials in specialized industries. Technological advancements such as the development of novel fiber and resin systems, and improvements in manufacturing processes, are further contributing to market expansion. Consumer preference for sustainable and high-performance products is driving demand for environmentally friendly hybrid composites. The market penetration rate is expected to increase from xx% in 2025 to xx% by 2033, driven by increased awareness and adoption in niche applications.
Dominant Regions, Countries, or Segments in Hybrid Composites Market
North America and Europe currently dominate the Hybrid Composites market, driven by strong automotive and aerospace sectors. Within these regions, the US and Germany are key growth markets. However, the Asia-Pacific region is witnessing rapid growth due to expanding infrastructure projects and increasing industrialization. The Carbon/Glass fiber type holds the largest market share, followed by Carbon/Aramid. In terms of resin type, Thermoset Resins dominate the market. The Automotive and Transportation sector is the largest end-user industry, followed by the Construction and Infrastructure sector.
- North America: Strong automotive and aerospace industries drive market growth.
- Europe: High adoption rates in construction and infrastructure.
- Asia-Pacific: Rapid growth fueled by infrastructure development and industrialization.
- Fiber Type: Carbon/Glass holds the largest market share, exhibiting a xx% CAGR.
- Resin Type: Thermoset Resins dominate due to cost-effectiveness and established processing methods.
- End-user Industry: Automotive and Transportation sector leads with a market share of xx% in 2025.
Hybrid Composites Market Product Landscape
The Hybrid Composites market showcases a diverse range of products tailored to specific application needs. Innovations focus on improving material properties, such as enhanced strength, stiffness, and impact resistance, alongside efforts to reduce weight and cost. Key advancements include the development of high-performance fibers, tailored resin systems, and optimized manufacturing processes. These innovations contribute to improved performance metrics and expand the range of applications for hybrid composites. Unique selling propositions often center on superior mechanical properties, weight reduction, cost-effectiveness, and sustainability.
Key Drivers, Barriers & Challenges in Hybrid Composites Market
Key Drivers:
- Growing demand for lightweight materials in automotive and aerospace industries.
- Increasing investments in infrastructure development globally.
- Advancements in fiber and resin technologies enhancing material performance.
- Government support for sustainable and high-performance materials.
Challenges & Restraints:
- High initial cost of hybrid composites compared to traditional materials.
- Complex manufacturing processes and skilled labor requirements.
- Potential supply chain disruptions impacting material availability and cost.
- Strict environmental regulations impacting material choices and disposal.
Emerging Opportunities in Hybrid Composites Market
Emerging opportunities lie in expanding into new applications, such as renewable energy, medical devices, and sporting goods. Untapped markets in developing economies offer significant growth potential. Innovations in bio-based and recycled materials create opportunities for sustainable hybrid composites. Evolving consumer preferences for environmentally friendly products further drive demand for eco-friendly solutions.
Growth Accelerators in the Hybrid Composites Market Industry
Technological breakthroughs in fiber and resin technologies will continue to drive market growth. Strategic partnerships between material suppliers and end-users will facilitate innovation and market penetration. Market expansion strategies focusing on emerging economies will unlock new growth opportunities.
Key Players Shaping the Hybrid Composites Market Market
- SGL Carbon
- Toray Advanced Composites
- Textum OPCO LLC
- Solvay
- Gurit Services AG
- Avient Corporation
- LANXESS
- Owens Corning
- Huntsman International LLC
- SABIC
- DSM
- RTP Company
- Mitsubishi Chemical Carbon Fiber and Composites Inc
- Hexcel Corporation
- Simcas Composites
- TEIJIN LIMITED
- KINECO - KAMAN
Notable Milestones in Hybrid Composites Market Sector
- 2021: Introduction of a new bio-based resin by Company X.
- 2022: Acquisition of Company Y by Company Z, expanding market reach.
- 2023: Launch of a novel carbon/aramid hybrid composite by Company A.
- 2024: Significant investment in R&D for lightweight hybrid composites by Company B.
In-Depth Hybrid Composites Market Market Outlook
The Hybrid Composites market is poised for continued growth, driven by technological advancements, increasing demand from key end-user industries, and expansion into new applications. Strategic collaborations, investments in R&D, and focus on sustainable materials will shape the market landscape. The market offers substantial opportunities for players who can effectively address the challenges associated with material cost, processing complexity, and supply chain management. The forecast period (2025-2033) anticipates robust growth, presenting attractive investment opportunities and significant potential for market expansion.
Hybrid Composites Market Segmentation
-
1. Fiber Type
- 1.1. Carbon/Glass
- 1.2. Carbon/Aramid
- 1.3. HMPP/Carbon
- 1.4. Wood/Plastic
- 1.5. Other Fiber Type
-
2. Resin Type
- 2.1. Thermoset Resins
- 2.2. Thermoplastic Resins
- 2.3. Other Resin Type
-
3. End-user Industry
- 3.1. Automotive and Transportation
- 3.2. Construction and Infrastructure
- 3.3. Aerospace and Defense
- 3.4. Marine
- 3.5. Other End-user Industry
Hybrid Composites Market Segmentation By Geography
-
1. Asia Pacific
- 1.1. China
- 1.2. India
- 1.3. Japan
- 1.4. South Korea
- 1.5. Rest of Asia Pacific
-
2. North America
- 2.1. United States
- 2.2. Canada
- 2.3. Mexico
-
3. Europe
- 3.1. Germany
- 3.2. United Kingdom
- 3.3. France
- 3.4. Italy
- 3.5. Spain
- 3.6. Rest of Europe
-
4. South America
- 4.1. Brazil
- 4.2. Argentina
- 4.3. Rest of South America
- 5. Middle East
-
6. Saudi Arabia
- 6.1. South Africa
- 6.2. UAE
- 6.3. Rest of Middle East
Hybrid Composites Market Regional Market Share
Geographic Coverage of Hybrid Composites Market
Hybrid Composites Market REPORT HIGHLIGHTS
| Aspects | Details |
|---|---|
| Study Period | 2020-2034 |
| Base Year | 2025 |
| Estimated Year | 2026 |
| Forecast Period | 2026-2034 |
| Historical Period | 2020-2025 |
| Growth Rate | CAGR of > 10.00% from 2020-2034 |
| Segmentation |
|
Table of Contents
- 1. Introduction
- 1.1. Research Scope
- 1.2. Market Segmentation
- 1.3. Research Objective
- 1.4. Definitions and Assumptions
- 2. Executive Summary
- 2.1. Market Snapshot
- 3. Market Dynamics
- 3.1. Market Drivers
- 3.2. Market Restrains
- 3.3. Market Trends
- 3.4. Market Opportunities
- 4. Market Factor Analysis
- 4.1. Porters Five Forces
- 4.1.1. Bargaining Power of Suppliers
- 4.1.2. Bargaining Power of Buyers
- 4.1.3. Threat of New Entrants
- 4.1.4. Threat of Substitutes
- 4.1.5. Competitive Rivalry
- 4.2. PESTEL analysis
- 4.3. BCG Analysis
- 4.3.1. Stars (High Growth, High Market Share)
- 4.3.2. Cash Cows (Low Growth, High Market Share)
- 4.3.3. Question Mark (High Growth, Low Market Share)
- 4.3.4. Dogs (Low Growth, Low Market Share)
- 4.4. Ansoff Matrix Analysis
- 4.5. Supply Chain Analysis
- 4.6. Regulatory Landscape
- 4.7. Current Market Potential and Opportunity Assessment (TAM–SAM–SOM Framework)
- 4.8. VDR Analyst Note
- 4.1. Porters Five Forces
- 5. Market Analysis, Insights and Forecast 2021-2033
- 5.1. Market Analysis, Insights and Forecast - by Fiber Type
- 5.1.1. Carbon/Glass
- 5.1.2. Carbon/Aramid
- 5.1.3. HMPP/Carbon
- 5.1.4. Wood/Plastic
- 5.1.5. Other Fiber Type
- 5.2. Market Analysis, Insights and Forecast - by Resin Type
- 5.2.1. Thermoset Resins
- 5.2.2. Thermoplastic Resins
- 5.2.3. Other Resin Type
- 5.3. Market Analysis, Insights and Forecast - by End-user Industry
- 5.3.1. Automotive and Transportation
- 5.3.2. Construction and Infrastructure
- 5.3.3. Aerospace and Defense
- 5.3.4. Marine
- 5.3.5. Other End-user Industry
- 5.4. Market Analysis, Insights and Forecast - by Region
- 5.4.1. Asia Pacific
- 5.4.2. North America
- 5.4.3. Europe
- 5.4.4. South America
- 5.4.5. Middle East
- 5.4.6. Saudi Arabia
- 5.1. Market Analysis, Insights and Forecast - by Fiber Type
- 6. Global Hybrid Composites Market Analysis, Insights and Forecast, 2021-2033
- 6.1. Market Analysis, Insights and Forecast - by Fiber Type
- 6.1.1. Carbon/Glass
- 6.1.2. Carbon/Aramid
- 6.1.3. HMPP/Carbon
- 6.1.4. Wood/Plastic
- 6.1.5. Other Fiber Type
- 6.2. Market Analysis, Insights and Forecast - by Resin Type
- 6.2.1. Thermoset Resins
- 6.2.2. Thermoplastic Resins
- 6.2.3. Other Resin Type
- 6.3. Market Analysis, Insights and Forecast - by End-user Industry
- 6.3.1. Automotive and Transportation
- 6.3.2. Construction and Infrastructure
- 6.3.3. Aerospace and Defense
- 6.3.4. Marine
- 6.3.5. Other End-user Industry
- 6.1. Market Analysis, Insights and Forecast - by Fiber Type
- 7. Asia Pacific Hybrid Composites Market Analysis, Insights and Forecast, 2021-2033
- 7.1. Market Analysis, Insights and Forecast - by Fiber Type
- 7.1.1. Carbon/Glass
- 7.1.2. Carbon/Aramid
- 7.1.3. HMPP/Carbon
- 7.1.4. Wood/Plastic
- 7.1.5. Other Fiber Type
- 7.2. Market Analysis, Insights and Forecast - by Resin Type
- 7.2.1. Thermoset Resins
- 7.2.2. Thermoplastic Resins
- 7.2.3. Other Resin Type
- 7.3. Market Analysis, Insights and Forecast - by End-user Industry
- 7.3.1. Automotive and Transportation
- 7.3.2. Construction and Infrastructure
- 7.3.3. Aerospace and Defense
- 7.3.4. Marine
- 7.3.5. Other End-user Industry
- 7.1. Market Analysis, Insights and Forecast - by Fiber Type
- 8. North America Hybrid Composites Market Analysis, Insights and Forecast, 2021-2033
- 8.1. Market Analysis, Insights and Forecast - by Fiber Type
- 8.1.1. Carbon/Glass
- 8.1.2. Carbon/Aramid
- 8.1.3. HMPP/Carbon
- 8.1.4. Wood/Plastic
- 8.1.5. Other Fiber Type
- 8.2. Market Analysis, Insights and Forecast - by Resin Type
- 8.2.1. Thermoset Resins
- 8.2.2. Thermoplastic Resins
- 8.2.3. Other Resin Type
- 8.3. Market Analysis, Insights and Forecast - by End-user Industry
- 8.3.1. Automotive and Transportation
- 8.3.2. Construction and Infrastructure
- 8.3.3. Aerospace and Defense
- 8.3.4. Marine
- 8.3.5. Other End-user Industry
- 8.1. Market Analysis, Insights and Forecast - by Fiber Type
- 9. Europe Hybrid Composites Market Analysis, Insights and Forecast, 2021-2033
- 9.1. Market Analysis, Insights and Forecast - by Fiber Type
- 9.1.1. Carbon/Glass
- 9.1.2. Carbon/Aramid
- 9.1.3. HMPP/Carbon
- 9.1.4. Wood/Plastic
- 9.1.5. Other Fiber Type
- 9.2. Market Analysis, Insights and Forecast - by Resin Type
- 9.2.1. Thermoset Resins
- 9.2.2. Thermoplastic Resins
- 9.2.3. Other Resin Type
- 9.3. Market Analysis, Insights and Forecast - by End-user Industry
- 9.3.1. Automotive and Transportation
- 9.3.2. Construction and Infrastructure
- 9.3.3. Aerospace and Defense
- 9.3.4. Marine
- 9.3.5. Other End-user Industry
- 9.1. Market Analysis, Insights and Forecast - by Fiber Type
- 10. South America Hybrid Composites Market Analysis, Insights and Forecast, 2021-2033
- 10.1. Market Analysis, Insights and Forecast - by Fiber Type
- 10.1.1. Carbon/Glass
- 10.1.2. Carbon/Aramid
- 10.1.3. HMPP/Carbon
- 10.1.4. Wood/Plastic
- 10.1.5. Other Fiber Type
- 10.2. Market Analysis, Insights and Forecast - by Resin Type
- 10.2.1. Thermoset Resins
- 10.2.2. Thermoplastic Resins
- 10.2.3. Other Resin Type
- 10.3. Market Analysis, Insights and Forecast - by End-user Industry
- 10.3.1. Automotive and Transportation
- 10.3.2. Construction and Infrastructure
- 10.3.3. Aerospace and Defense
- 10.3.4. Marine
- 10.3.5. Other End-user Industry
- 10.1. Market Analysis, Insights and Forecast - by Fiber Type
- 11. Middle East Hybrid Composites Market Analysis, Insights and Forecast, 2021-2033
- 11.1. Market Analysis, Insights and Forecast - by Fiber Type
- 11.1.1. Carbon/Glass
- 11.1.2. Carbon/Aramid
- 11.1.3. HMPP/Carbon
- 11.1.4. Wood/Plastic
- 11.1.5. Other Fiber Type
- 11.2. Market Analysis, Insights and Forecast - by Resin Type
- 11.2.1. Thermoset Resins
- 11.2.2. Thermoplastic Resins
- 11.2.3. Other Resin Type
- 11.3. Market Analysis, Insights and Forecast - by End-user Industry
- 11.3.1. Automotive and Transportation
- 11.3.2. Construction and Infrastructure
- 11.3.3. Aerospace and Defense
- 11.3.4. Marine
- 11.3.5. Other End-user Industry
- 11.1. Market Analysis, Insights and Forecast - by Fiber Type
- 12. Saudi Arabia Hybrid Composites Market Analysis, Insights and Forecast, 2021-2033
- 12.1. Market Analysis, Insights and Forecast - by Fiber Type
- 12.1.1. Carbon/Glass
- 12.1.2. Carbon/Aramid
- 12.1.3. HMPP/Carbon
- 12.1.4. Wood/Plastic
- 12.1.5. Other Fiber Type
- 12.2. Market Analysis, Insights and Forecast - by Resin Type
- 12.2.1. Thermoset Resins
- 12.2.2. Thermoplastic Resins
- 12.2.3. Other Resin Type
- 12.3. Market Analysis, Insights and Forecast - by End-user Industry
- 12.3.1. Automotive and Transportation
- 12.3.2. Construction and Infrastructure
- 12.3.3. Aerospace and Defense
- 12.3.4. Marine
- 12.3.5. Other End-user Industry
- 12.1. Market Analysis, Insights and Forecast - by Fiber Type
- 13. Competitive Analysis
- 13.1. Company Profiles
- 13.1.1 SGL Carbon
- 13.1.1.1. Company Overview
- 13.1.1.2. Products
- 13.1.1.3. Company Financials
- 13.1.1.4. SWOT Analysis
- 13.1.2 Toray Advanced Composites
- 13.1.2.1. Company Overview
- 13.1.2.2. Products
- 13.1.2.3. Company Financials
- 13.1.2.4. SWOT Analysis
- 13.1.3 Textum OPCO LLC
- 13.1.3.1. Company Overview
- 13.1.3.2. Products
- 13.1.3.3. Company Financials
- 13.1.3.4. SWOT Analysis
- 13.1.4 Solvay
- 13.1.4.1. Company Overview
- 13.1.4.2. Products
- 13.1.4.3. Company Financials
- 13.1.4.4. SWOT Analysis
- 13.1.5 Gurit Services AG
- 13.1.5.1. Company Overview
- 13.1.5.2. Products
- 13.1.5.3. Company Financials
- 13.1.5.4. SWOT Analysis
- 13.1.6 Avient Corporation
- 13.1.6.1. Company Overview
- 13.1.6.2. Products
- 13.1.6.3. Company Financials
- 13.1.6.4. SWOT Analysis
- 13.1.7 LANXESS
- 13.1.7.1. Company Overview
- 13.1.7.2. Products
- 13.1.7.3. Company Financials
- 13.1.7.4. SWOT Analysis
- 13.1.8 Owens Corning
- 13.1.8.1. Company Overview
- 13.1.8.2. Products
- 13.1.8.3. Company Financials
- 13.1.8.4. SWOT Analysis
- 13.1.9 Huntsman International LLC
- 13.1.9.1. Company Overview
- 13.1.9.2. Products
- 13.1.9.3. Company Financials
- 13.1.9.4. SWOT Analysis
- 13.1.10 SABIC
- 13.1.10.1. Company Overview
- 13.1.10.2. Products
- 13.1.10.3. Company Financials
- 13.1.10.4. SWOT Analysis
- 13.1.11 DSM
- 13.1.11.1. Company Overview
- 13.1.11.2. Products
- 13.1.11.3. Company Financials
- 13.1.11.4. SWOT Analysis
- 13.1.12 RTP Company
- 13.1.12.1. Company Overview
- 13.1.12.2. Products
- 13.1.12.3. Company Financials
- 13.1.12.4. SWOT Analysis
- 13.1.13 Mitsubishi Chemical Carbon Fiber and Composites Inc
- 13.1.13.1. Company Overview
- 13.1.13.2. Products
- 13.1.13.3. Company Financials
- 13.1.13.4. SWOT Analysis
- 13.1.14 Hexcel Corporation
- 13.1.14.1. Company Overview
- 13.1.14.2. Products
- 13.1.14.3. Company Financials
- 13.1.14.4. SWOT Analysis
- 13.1.15 Simcas Composites
- 13.1.15.1. Company Overview
- 13.1.15.2. Products
- 13.1.15.3. Company Financials
- 13.1.15.4. SWOT Analysis
- 13.1.16 TEIJIN LIMITED
- 13.1.16.1. Company Overview
- 13.1.16.2. Products
- 13.1.16.3. Company Financials
- 13.1.16.4. SWOT Analysis
- 13.1.17 KINECO - KAMAN
- 13.1.17.1. Company Overview
- 13.1.17.2. Products
- 13.1.17.3. Company Financials
- 13.1.17.4. SWOT Analysis
- 13.1.1 SGL Carbon
- 13.2. Market Entropy
- 13.2.1 Company's Key Areas Served
- 13.2.2 Recent Developments
- 13.3. Company Market Share Analysis 2025
- 13.3.1 Top 5 Companies Market Share Analysis
- 13.3.2 Top 3 Companies Market Share Analysis
- 13.4. List of Potential Customers
- 14. Research Methodology
List of Figures
- Figure 1: Global Hybrid Composites Market Revenue Breakdown (Million, %) by Region 2025 & 2033
- Figure 2: Global Hybrid Composites Market Volume Breakdown (K Tons, %) by Region 2025 & 2033
- Figure 3: Asia Pacific Hybrid Composites Market Revenue (Million), by Fiber Type 2025 & 2033
- Figure 4: Asia Pacific Hybrid Composites Market Volume (K Tons), by Fiber Type 2025 & 2033
- Figure 5: Asia Pacific Hybrid Composites Market Revenue Share (%), by Fiber Type 2025 & 2033
- Figure 6: Asia Pacific Hybrid Composites Market Volume Share (%), by Fiber Type 2025 & 2033
- Figure 7: Asia Pacific Hybrid Composites Market Revenue (Million), by Resin Type 2025 & 2033
- Figure 8: Asia Pacific Hybrid Composites Market Volume (K Tons), by Resin Type 2025 & 2033
- Figure 9: Asia Pacific Hybrid Composites Market Revenue Share (%), by Resin Type 2025 & 2033
- Figure 10: Asia Pacific Hybrid Composites Market Volume Share (%), by Resin Type 2025 & 2033
- Figure 11: Asia Pacific Hybrid Composites Market Revenue (Million), by End-user Industry 2025 & 2033
- Figure 12: Asia Pacific Hybrid Composites Market Volume (K Tons), by End-user Industry 2025 & 2033
- Figure 13: Asia Pacific Hybrid Composites Market Revenue Share (%), by End-user Industry 2025 & 2033
- Figure 14: Asia Pacific Hybrid Composites Market Volume Share (%), by End-user Industry 2025 & 2033
- Figure 15: Asia Pacific Hybrid Composites Market Revenue (Million), by Country 2025 & 2033
- Figure 16: Asia Pacific Hybrid Composites Market Volume (K Tons), by Country 2025 & 2033
- Figure 17: Asia Pacific Hybrid Composites Market Revenue Share (%), by Country 2025 & 2033
- Figure 18: Asia Pacific Hybrid Composites Market Volume Share (%), by Country 2025 & 2033
- Figure 19: North America Hybrid Composites Market Revenue (Million), by Fiber Type 2025 & 2033
- Figure 20: North America Hybrid Composites Market Volume (K Tons), by Fiber Type 2025 & 2033
- Figure 21: North America Hybrid Composites Market Revenue Share (%), by Fiber Type 2025 & 2033
- Figure 22: North America Hybrid Composites Market Volume Share (%), by Fiber Type 2025 & 2033
- Figure 23: North America Hybrid Composites Market Revenue (Million), by Resin Type 2025 & 2033
- Figure 24: North America Hybrid Composites Market Volume (K Tons), by Resin Type 2025 & 2033
- Figure 25: North America Hybrid Composites Market Revenue Share (%), by Resin Type 2025 & 2033
- Figure 26: North America Hybrid Composites Market Volume Share (%), by Resin Type 2025 & 2033
- Figure 27: North America Hybrid Composites Market Revenue (Million), by End-user Industry 2025 & 2033
- Figure 28: North America Hybrid Composites Market Volume (K Tons), by End-user Industry 2025 & 2033
- Figure 29: North America Hybrid Composites Market Revenue Share (%), by End-user Industry 2025 & 2033
- Figure 30: North America Hybrid Composites Market Volume Share (%), by End-user Industry 2025 & 2033
- Figure 31: North America Hybrid Composites Market Revenue (Million), by Country 2025 & 2033
- Figure 32: North America Hybrid Composites Market Volume (K Tons), by Country 2025 & 2033
- Figure 33: North America Hybrid Composites Market Revenue Share (%), by Country 2025 & 2033
- Figure 34: North America Hybrid Composites Market Volume Share (%), by Country 2025 & 2033
- Figure 35: Europe Hybrid Composites Market Revenue (Million), by Fiber Type 2025 & 2033
- Figure 36: Europe Hybrid Composites Market Volume (K Tons), by Fiber Type 2025 & 2033
- Figure 37: Europe Hybrid Composites Market Revenue Share (%), by Fiber Type 2025 & 2033
- Figure 38: Europe Hybrid Composites Market Volume Share (%), by Fiber Type 2025 & 2033
- Figure 39: Europe Hybrid Composites Market Revenue (Million), by Resin Type 2025 & 2033
- Figure 40: Europe Hybrid Composites Market Volume (K Tons), by Resin Type 2025 & 2033
- Figure 41: Europe Hybrid Composites Market Revenue Share (%), by Resin Type 2025 & 2033
- Figure 42: Europe Hybrid Composites Market Volume Share (%), by Resin Type 2025 & 2033
- Figure 43: Europe Hybrid Composites Market Revenue (Million), by End-user Industry 2025 & 2033
- Figure 44: Europe Hybrid Composites Market Volume (K Tons), by End-user Industry 2025 & 2033
- Figure 45: Europe Hybrid Composites Market Revenue Share (%), by End-user Industry 2025 & 2033
- Figure 46: Europe Hybrid Composites Market Volume Share (%), by End-user Industry 2025 & 2033
- Figure 47: Europe Hybrid Composites Market Revenue (Million), by Country 2025 & 2033
- Figure 48: Europe Hybrid Composites Market Volume (K Tons), by Country 2025 & 2033
- Figure 49: Europe Hybrid Composites Market Revenue Share (%), by Country 2025 & 2033
- Figure 50: Europe Hybrid Composites Market Volume Share (%), by Country 2025 & 2033
- Figure 51: South America Hybrid Composites Market Revenue (Million), by Fiber Type 2025 & 2033
- Figure 52: South America Hybrid Composites Market Volume (K Tons), by Fiber Type 2025 & 2033
- Figure 53: South America Hybrid Composites Market Revenue Share (%), by Fiber Type 2025 & 2033
- Figure 54: South America Hybrid Composites Market Volume Share (%), by Fiber Type 2025 & 2033
- Figure 55: South America Hybrid Composites Market Revenue (Million), by Resin Type 2025 & 2033
- Figure 56: South America Hybrid Composites Market Volume (K Tons), by Resin Type 2025 & 2033
- Figure 57: South America Hybrid Composites Market Revenue Share (%), by Resin Type 2025 & 2033
- Figure 58: South America Hybrid Composites Market Volume Share (%), by Resin Type 2025 & 2033
- Figure 59: South America Hybrid Composites Market Revenue (Million), by End-user Industry 2025 & 2033
- Figure 60: South America Hybrid Composites Market Volume (K Tons), by End-user Industry 2025 & 2033
- Figure 61: South America Hybrid Composites Market Revenue Share (%), by End-user Industry 2025 & 2033
- Figure 62: South America Hybrid Composites Market Volume Share (%), by End-user Industry 2025 & 2033
- Figure 63: South America Hybrid Composites Market Revenue (Million), by Country 2025 & 2033
- Figure 64: South America Hybrid Composites Market Volume (K Tons), by Country 2025 & 2033
- Figure 65: South America Hybrid Composites Market Revenue Share (%), by Country 2025 & 2033
- Figure 66: South America Hybrid Composites Market Volume Share (%), by Country 2025 & 2033
- Figure 67: Middle East Hybrid Composites Market Revenue (Million), by Fiber Type 2025 & 2033
- Figure 68: Middle East Hybrid Composites Market Volume (K Tons), by Fiber Type 2025 & 2033
- Figure 69: Middle East Hybrid Composites Market Revenue Share (%), by Fiber Type 2025 & 2033
- Figure 70: Middle East Hybrid Composites Market Volume Share (%), by Fiber Type 2025 & 2033
- Figure 71: Middle East Hybrid Composites Market Revenue (Million), by Resin Type 2025 & 2033
- Figure 72: Middle East Hybrid Composites Market Volume (K Tons), by Resin Type 2025 & 2033
- Figure 73: Middle East Hybrid Composites Market Revenue Share (%), by Resin Type 2025 & 2033
- Figure 74: Middle East Hybrid Composites Market Volume Share (%), by Resin Type 2025 & 2033
- Figure 75: Middle East Hybrid Composites Market Revenue (Million), by End-user Industry 2025 & 2033
- Figure 76: Middle East Hybrid Composites Market Volume (K Tons), by End-user Industry 2025 & 2033
- Figure 77: Middle East Hybrid Composites Market Revenue Share (%), by End-user Industry 2025 & 2033
- Figure 78: Middle East Hybrid Composites Market Volume Share (%), by End-user Industry 2025 & 2033
- Figure 79: Middle East Hybrid Composites Market Revenue (Million), by Country 2025 & 2033
- Figure 80: Middle East Hybrid Composites Market Volume (K Tons), by Country 2025 & 2033
- Figure 81: Middle East Hybrid Composites Market Revenue Share (%), by Country 2025 & 2033
- Figure 82: Middle East Hybrid Composites Market Volume Share (%), by Country 2025 & 2033
- Figure 83: Saudi Arabia Hybrid Composites Market Revenue (Million), by Fiber Type 2025 & 2033
- Figure 84: Saudi Arabia Hybrid Composites Market Volume (K Tons), by Fiber Type 2025 & 2033
- Figure 85: Saudi Arabia Hybrid Composites Market Revenue Share (%), by Fiber Type 2025 & 2033
- Figure 86: Saudi Arabia Hybrid Composites Market Volume Share (%), by Fiber Type 2025 & 2033
- Figure 87: Saudi Arabia Hybrid Composites Market Revenue (Million), by Resin Type 2025 & 2033
- Figure 88: Saudi Arabia Hybrid Composites Market Volume (K Tons), by Resin Type 2025 & 2033
- Figure 89: Saudi Arabia Hybrid Composites Market Revenue Share (%), by Resin Type 2025 & 2033
- Figure 90: Saudi Arabia Hybrid Composites Market Volume Share (%), by Resin Type 2025 & 2033
- Figure 91: Saudi Arabia Hybrid Composites Market Revenue (Million), by End-user Industry 2025 & 2033
- Figure 92: Saudi Arabia Hybrid Composites Market Volume (K Tons), by End-user Industry 2025 & 2033
- Figure 93: Saudi Arabia Hybrid Composites Market Revenue Share (%), by End-user Industry 2025 & 2033
- Figure 94: Saudi Arabia Hybrid Composites Market Volume Share (%), by End-user Industry 2025 & 2033
- Figure 95: Saudi Arabia Hybrid Composites Market Revenue (Million), by Country 2025 & 2033
- Figure 96: Saudi Arabia Hybrid Composites Market Volume (K Tons), by Country 2025 & 2033
- Figure 97: Saudi Arabia Hybrid Composites Market Revenue Share (%), by Country 2025 & 2033
- Figure 98: Saudi Arabia Hybrid Composites Market Volume Share (%), by Country 2025 & 2033
List of Tables
- Table 1: Global Hybrid Composites Market Revenue Million Forecast, by Fiber Type 2020 & 2033
- Table 2: Global Hybrid Composites Market Volume K Tons Forecast, by Fiber Type 2020 & 2033
- Table 3: Global Hybrid Composites Market Revenue Million Forecast, by Resin Type 2020 & 2033
- Table 4: Global Hybrid Composites Market Volume K Tons Forecast, by Resin Type 2020 & 2033
- Table 5: Global Hybrid Composites Market Revenue Million Forecast, by End-user Industry 2020 & 2033
- Table 6: Global Hybrid Composites Market Volume K Tons Forecast, by End-user Industry 2020 & 2033
- Table 7: Global Hybrid Composites Market Revenue Million Forecast, by Region 2020 & 2033
- Table 8: Global Hybrid Composites Market Volume K Tons Forecast, by Region 2020 & 2033
- Table 9: Global Hybrid Composites Market Revenue Million Forecast, by Fiber Type 2020 & 2033
- Table 10: Global Hybrid Composites Market Volume K Tons Forecast, by Fiber Type 2020 & 2033
- Table 11: Global Hybrid Composites Market Revenue Million Forecast, by Resin Type 2020 & 2033
- Table 12: Global Hybrid Composites Market Volume K Tons Forecast, by Resin Type 2020 & 2033
- Table 13: Global Hybrid Composites Market Revenue Million Forecast, by End-user Industry 2020 & 2033
- Table 14: Global Hybrid Composites Market Volume K Tons Forecast, by End-user Industry 2020 & 2033
- Table 15: Global Hybrid Composites Market Revenue Million Forecast, by Country 2020 & 2033
- Table 16: Global Hybrid Composites Market Volume K Tons Forecast, by Country 2020 & 2033
- Table 17: China Hybrid Composites Market Revenue (Million) Forecast, by Application 2020 & 2033
- Table 18: China Hybrid Composites Market Volume (K Tons) Forecast, by Application 2020 & 2033
- Table 19: India Hybrid Composites Market Revenue (Million) Forecast, by Application 2020 & 2033
- Table 20: India Hybrid Composites Market Volume (K Tons) Forecast, by Application 2020 & 2033
- Table 21: Japan Hybrid Composites Market Revenue (Million) Forecast, by Application 2020 & 2033
- Table 22: Japan Hybrid Composites Market Volume (K Tons) Forecast, by Application 2020 & 2033
- Table 23: South Korea Hybrid Composites Market Revenue (Million) Forecast, by Application 2020 & 2033
- Table 24: South Korea Hybrid Composites Market Volume (K Tons) Forecast, by Application 2020 & 2033
- Table 25: Rest of Asia Pacific Hybrid Composites Market Revenue (Million) Forecast, by Application 2020 & 2033
- Table 26: Rest of Asia Pacific Hybrid Composites Market Volume (K Tons) Forecast, by Application 2020 & 2033
- Table 27: Global Hybrid Composites Market Revenue Million Forecast, by Fiber Type 2020 & 2033
- Table 28: Global Hybrid Composites Market Volume K Tons Forecast, by Fiber Type 2020 & 2033
- Table 29: Global Hybrid Composites Market Revenue Million Forecast, by Resin Type 2020 & 2033
- Table 30: Global Hybrid Composites Market Volume K Tons Forecast, by Resin Type 2020 & 2033
- Table 31: Global Hybrid Composites Market Revenue Million Forecast, by End-user Industry 2020 & 2033
- Table 32: Global Hybrid Composites Market Volume K Tons Forecast, by End-user Industry 2020 & 2033
- Table 33: Global Hybrid Composites Market Revenue Million Forecast, by Country 2020 & 2033
- Table 34: Global Hybrid Composites Market Volume K Tons Forecast, by Country 2020 & 2033
- Table 35: United States Hybrid Composites Market Revenue (Million) Forecast, by Application 2020 & 2033
- Table 36: United States Hybrid Composites Market Volume (K Tons) Forecast, by Application 2020 & 2033
- Table 37: Canada Hybrid Composites Market Revenue (Million) Forecast, by Application 2020 & 2033
- Table 38: Canada Hybrid Composites Market Volume (K Tons) Forecast, by Application 2020 & 2033
- Table 39: Mexico Hybrid Composites Market Revenue (Million) Forecast, by Application 2020 & 2033
- Table 40: Mexico Hybrid Composites Market Volume (K Tons) Forecast, by Application 2020 & 2033
- Table 41: Global Hybrid Composites Market Revenue Million Forecast, by Fiber Type 2020 & 2033
- Table 42: Global Hybrid Composites Market Volume K Tons Forecast, by Fiber Type 2020 & 2033
- Table 43: Global Hybrid Composites Market Revenue Million Forecast, by Resin Type 2020 & 2033
- Table 44: Global Hybrid Composites Market Volume K Tons Forecast, by Resin Type 2020 & 2033
- Table 45: Global Hybrid Composites Market Revenue Million Forecast, by End-user Industry 2020 & 2033
- Table 46: Global Hybrid Composites Market Volume K Tons Forecast, by End-user Industry 2020 & 2033
- Table 47: Global Hybrid Composites Market Revenue Million Forecast, by Country 2020 & 2033
- Table 48: Global Hybrid Composites Market Volume K Tons Forecast, by Country 2020 & 2033
- Table 49: Germany Hybrid Composites Market Revenue (Million) Forecast, by Application 2020 & 2033
- Table 50: Germany Hybrid Composites Market Volume (K Tons) Forecast, by Application 2020 & 2033
- Table 51: United Kingdom Hybrid Composites Market Revenue (Million) Forecast, by Application 2020 & 2033
- Table 52: United Kingdom Hybrid Composites Market Volume (K Tons) Forecast, by Application 2020 & 2033
- Table 53: France Hybrid Composites Market Revenue (Million) Forecast, by Application 2020 & 2033
- Table 54: France Hybrid Composites Market Volume (K Tons) Forecast, by Application 2020 & 2033
- Table 55: Italy Hybrid Composites Market Revenue (Million) Forecast, by Application 2020 & 2033
- Table 56: Italy Hybrid Composites Market Volume (K Tons) Forecast, by Application 2020 & 2033
- Table 57: Spain Hybrid Composites Market Revenue (Million) Forecast, by Application 2020 & 2033
- Table 58: Spain Hybrid Composites Market Volume (K Tons) Forecast, by Application 2020 & 2033
- Table 59: Rest of Europe Hybrid Composites Market Revenue (Million) Forecast, by Application 2020 & 2033
- Table 60: Rest of Europe Hybrid Composites Market Volume (K Tons) Forecast, by Application 2020 & 2033
- Table 61: Global Hybrid Composites Market Revenue Million Forecast, by Fiber Type 2020 & 2033
- Table 62: Global Hybrid Composites Market Volume K Tons Forecast, by Fiber Type 2020 & 2033
- Table 63: Global Hybrid Composites Market Revenue Million Forecast, by Resin Type 2020 & 2033
- Table 64: Global Hybrid Composites Market Volume K Tons Forecast, by Resin Type 2020 & 2033
- Table 65: Global Hybrid Composites Market Revenue Million Forecast, by End-user Industry 2020 & 2033
- Table 66: Global Hybrid Composites Market Volume K Tons Forecast, by End-user Industry 2020 & 2033
- Table 67: Global Hybrid Composites Market Revenue Million Forecast, by Country 2020 & 2033
- Table 68: Global Hybrid Composites Market Volume K Tons Forecast, by Country 2020 & 2033
- Table 69: Brazil Hybrid Composites Market Revenue (Million) Forecast, by Application 2020 & 2033
- Table 70: Brazil Hybrid Composites Market Volume (K Tons) Forecast, by Application 2020 & 2033
- Table 71: Argentina Hybrid Composites Market Revenue (Million) Forecast, by Application 2020 & 2033
- Table 72: Argentina Hybrid Composites Market Volume (K Tons) Forecast, by Application 2020 & 2033
- Table 73: Rest of South America Hybrid Composites Market Revenue (Million) Forecast, by Application 2020 & 2033
- Table 74: Rest of South America Hybrid Composites Market Volume (K Tons) Forecast, by Application 2020 & 2033
- Table 75: Global Hybrid Composites Market Revenue Million Forecast, by Fiber Type 2020 & 2033
- Table 76: Global Hybrid Composites Market Volume K Tons Forecast, by Fiber Type 2020 & 2033
- Table 77: Global Hybrid Composites Market Revenue Million Forecast, by Resin Type 2020 & 2033
- Table 78: Global Hybrid Composites Market Volume K Tons Forecast, by Resin Type 2020 & 2033
- Table 79: Global Hybrid Composites Market Revenue Million Forecast, by End-user Industry 2020 & 2033
- Table 80: Global Hybrid Composites Market Volume K Tons Forecast, by End-user Industry 2020 & 2033
- Table 81: Global Hybrid Composites Market Revenue Million Forecast, by Country 2020 & 2033
- Table 82: Global Hybrid Composites Market Volume K Tons Forecast, by Country 2020 & 2033
- Table 83: Global Hybrid Composites Market Revenue Million Forecast, by Fiber Type 2020 & 2033
- Table 84: Global Hybrid Composites Market Volume K Tons Forecast, by Fiber Type 2020 & 2033
- Table 85: Global Hybrid Composites Market Revenue Million Forecast, by Resin Type 2020 & 2033
- Table 86: Global Hybrid Composites Market Volume K Tons Forecast, by Resin Type 2020 & 2033
- Table 87: Global Hybrid Composites Market Revenue Million Forecast, by End-user Industry 2020 & 2033
- Table 88: Global Hybrid Composites Market Volume K Tons Forecast, by End-user Industry 2020 & 2033
- Table 89: Global Hybrid Composites Market Revenue Million Forecast, by Country 2020 & 2033
- Table 90: Global Hybrid Composites Market Volume K Tons Forecast, by Country 2020 & 2033
- Table 91: South Africa Hybrid Composites Market Revenue (Million) Forecast, by Application 2020 & 2033
- Table 92: South Africa Hybrid Composites Market Volume (K Tons) Forecast, by Application 2020 & 2033
- Table 93: UAE Hybrid Composites Market Revenue (Million) Forecast, by Application 2020 & 2033
- Table 94: UAE Hybrid Composites Market Volume (K Tons) Forecast, by Application 2020 & 2033
- Table 95: Rest of Middle East Hybrid Composites Market Revenue (Million) Forecast, by Application 2020 & 2033
- Table 96: Rest of Middle East Hybrid Composites Market Volume (K Tons) Forecast, by Application 2020 & 2033
Frequently Asked Questions
1. What is the projected Compound Annual Growth Rate (CAGR) of the Hybrid Composites Market?
The projected CAGR is approximately > 10.00%.
2. Which companies are prominent players in the Hybrid Composites Market?
Key companies in the market include SGL Carbon, Toray Advanced Composites, Textum OPCO LLC, Solvay, Gurit Services AG, Avient Corporation, LANXESS, Owens Corning, Huntsman International LLC, SABIC, DSM, RTP Company, Mitsubishi Chemical Carbon Fiber and Composites Inc, Hexcel Corporation, Simcas Composites, TEIJIN LIMITED, KINECO - KAMAN.
3. What are the main segments of the Hybrid Composites Market?
The market segments include Fiber Type, Resin Type, End-user Industry.
4. Can you provide details about the market size?
The market size is estimated to be USD 2.13 Million as of 2022.
5. What are some drivers contributing to market growth?
Increasing Use of Composite Material in Light Vehicle Segment; Specific Hybrids offer Multi-threat Protection; Other Drivers.
6. What are the notable trends driving market growth?
Carbon/Glass to Dominate the Market.
7. Are there any restraints impacting market growth?
High Processing and Manufacturing Costs; Concerns about Sustainability and Environmental Impact.
8. Can you provide examples of recent developments in the market?
N/A
9. What pricing options are available for accessing the report?
Pricing options include single-user, multi-user, and enterprise licenses priced at USD 4750, USD 5250, and USD 8750 respectively.
10. Is the market size provided in terms of value or volume?
The market size is provided in terms of value, measured in Million and volume, measured in K Tons.
11. Are there any specific market keywords associated with the report?
Yes, the market keyword associated with the report is "Hybrid Composites Market," which aids in identifying and referencing the specific market segment covered.
12. How do I determine which pricing option suits my needs best?
The pricing options vary based on user requirements and access needs. Individual users may opt for single-user licenses, while businesses requiring broader access may choose multi-user or enterprise licenses for cost-effective access to the report.
13. Are there any additional resources or data provided in the Hybrid Composites Market report?
While the report offers comprehensive insights, it's advisable to review the specific contents or supplementary materials provided to ascertain if additional resources or data are available.
14. How can I stay updated on further developments or reports in the Hybrid Composites Market?
To stay informed about further developments, trends, and reports in the Hybrid Composites Market, consider subscribing to industry newsletters, following relevant companies and organizations, or regularly checking reputable industry news sources and publications.
Methodology
Step 1 - Identification of Relevant Samples Size from Population Database


Step 2 - Approaches for Defining Global Market Size (Value, Volume* & Price*)

Note*: In applicable scenarios
Step 3 - Data Sources
Primary Research
- Web Analytics
- Survey Reports
- Research Institute
- Latest Research Reports
- Opinion Leaders
Secondary Research
- Annual Reports
- White Paper
- Latest Press Release
- Industry Association
- Paid Database
- Investor Presentations

Step 4 - Data Triangulation
Involves using different sources of information in order to increase the validity of a study
These sources are likely to be stakeholders in a program - participants, other researchers, program staff, other community members, and so on.
Then we put all data in single framework & apply various statistical tools to find out the dynamic on the market.
During the analysis stage, feedback from the stakeholder groups would be compared to determine areas of agreement as well as areas of divergence