

Key Insights
The global market for household HD ultra-short-throw (UST) projectors is experiencing robust growth, driven by increasing demand for large-screen home entertainment solutions and advancements in projector technology. The market, estimated at $1.5 billion in 2025, is projected to expand at a Compound Annual Growth Rate (CAGR) of 15% from 2025 to 2033, reaching an estimated $5 billion by 2033. Key drivers include the rising affordability of high-definition UST projectors, improved image quality with features like 4K resolution and HDR support, and the increasing popularity of smart home integration capabilities. Consumers are increasingly drawn to the convenience and space-saving design of UST projectors, eliminating the need for extensive setup and dedicated projector spaces. The market is segmented by resolution (1080p and 4K), technology (DLP and LCD), features (smart functionality, portability), and price range (budget, mid-range, and premium). Leading brands like Sony, Optoma, Dell, LG, VAVA, and BenQ are actively competing, driving innovation and expanding product offerings.
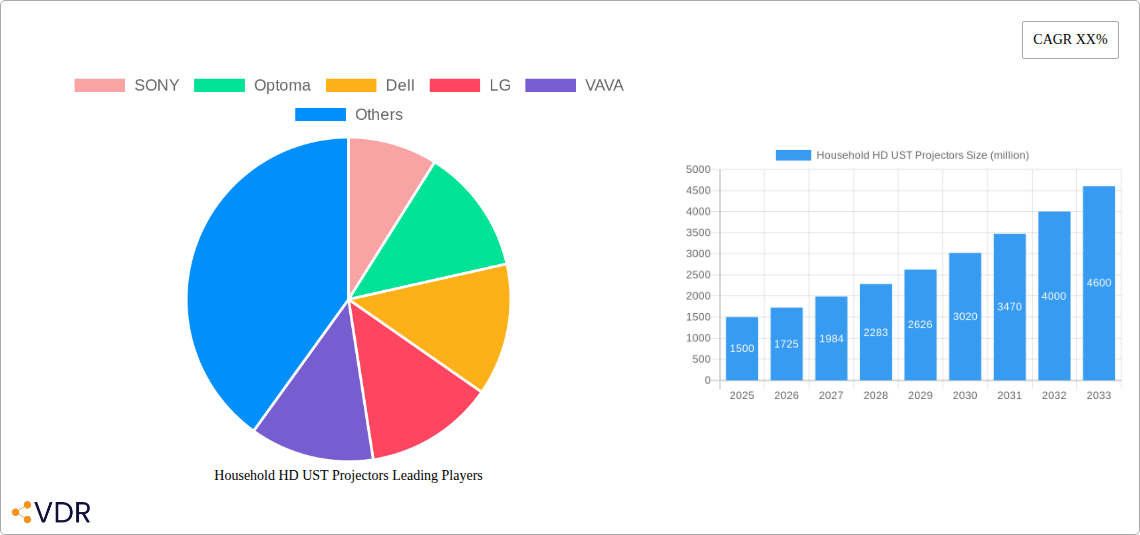
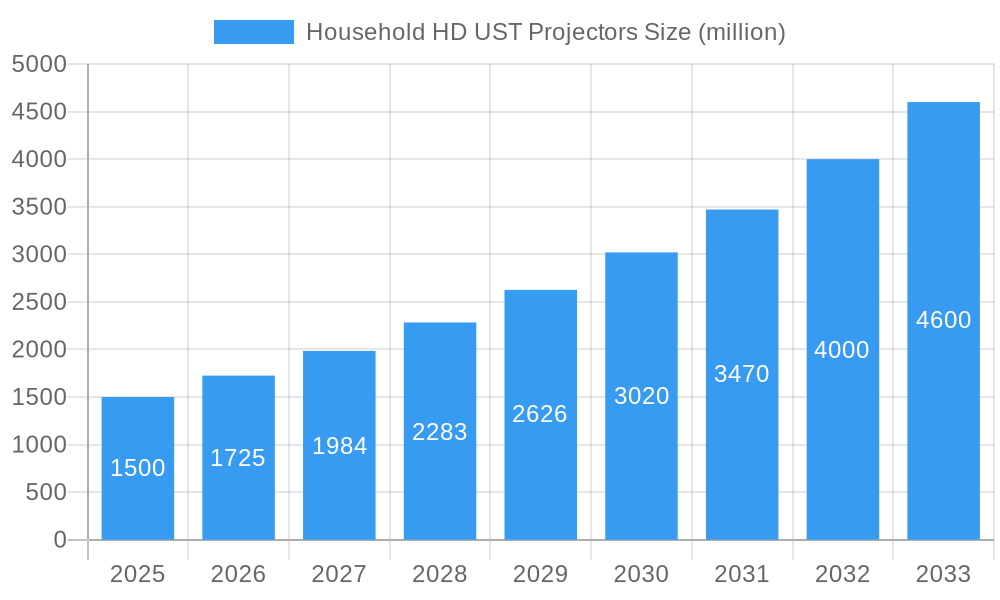
Household HD UST Projectors Market Size (In Billion)
While the market demonstrates significant potential, challenges remain. High initial investment costs, particularly for premium models with advanced features, can limit accessibility for budget-conscious consumers. Competition from alternative large-screen technologies, such as large-format televisions and laser TVs, also presents a challenge. However, ongoing technological advancements, decreasing manufacturing costs, and a growing consumer preference for immersive home entertainment experiences are expected to mitigate these restraints and fuel market growth in the forecast period. Regional variations in market penetration are expected, with North America and Asia-Pacific likely exhibiting the strongest growth due to high disposable incomes and growing adoption of smart home technologies.
Household HD UST Projectors Company Market Share
Household HD Ultra Short Throw (UST) Projectors Market Report: 2019-2033
This comprehensive report provides an in-depth analysis of the global Household HD Ultra Short Throw (UST) Projector market, offering invaluable insights for industry professionals, investors, and strategic decision-makers. The study covers the period 2019-2033, with a focus on the forecast period 2025-2033, utilizing 2025 as the base and estimated year. The report segments the market by key players (SONY, Optoma, Dell, LG, VAVA, BenQ), and geographical regions, delivering granular data to support informed business strategies. Expected market size in million units is presented throughout.
Household HD UST Projectors Market Dynamics & Structure
This section analyzes the competitive landscape of the household HD UST projector market, examining market concentration, technological innovation, regulatory influences, and market dynamics. We delve into the interplay of these factors to provide a comprehensive understanding of the market structure.
Market Concentration: The market is moderately concentrated, with a few major players holding significant market share in 2025 (estimated at xx million units). SONY, Optoma, and BenQ are expected to lead, holding approximately xx%, xx%, and xx% respectively. The remaining share is distributed among other players, including LG, VAVA, and Dell.
Technological Innovation: Key innovation drivers include improved image processing, enhanced brightness and contrast ratios, and the integration of smart features like voice control and streaming capabilities. However, barriers to innovation include high R&D costs and the complexity of miniaturizing high-performance components.
Regulatory Frameworks: Regulations related to energy efficiency and safety standards impact the market. Compliance costs and varying regulations across different regions present challenges for manufacturers.
Competitive Product Substitutes: Large-screen TVs and other display technologies pose the primary competitive threat. However, the unique benefits of UST projectors, such as portability and flexibility in placement, create differentiation.
End-User Demographics: The target demographic consists primarily of affluent households with a preference for large-screen entertainment, valuing convenience and immersive viewing experiences.
M&A Trends: The number of M&A deals in the sector during the historical period (2019-2024) was approximately xx. These deals primarily focused on expanding product portfolios and technological capabilities.
Household HD UST Projectors Growth Trends & Insights
The global household HD UST projector market experienced significant growth during the historical period (2019-2024), driven by rising disposable incomes, increasing demand for home entertainment, and technological advancements. The market size expanded from xx million units in 2019 to xx million units in 2024, exhibiting a CAGR of xx%. This growth trajectory is anticipated to continue through the forecast period (2025-2033), although at a slightly moderated pace, with a projected CAGR of xx%, reaching an estimated xx million units by 2033. Market penetration in key regions is expected to increase steadily as consumer awareness and product affordability improve. Technological disruptions, such as the introduction of 8K resolution projectors and improved laser-based light sources, will further fuel market growth. Consumer behavior shifts towards personalized entertainment experiences at home are supporting demand for higher quality home projection systems.
Dominant Regions, Countries, or Segments in Household HD UST Projectors
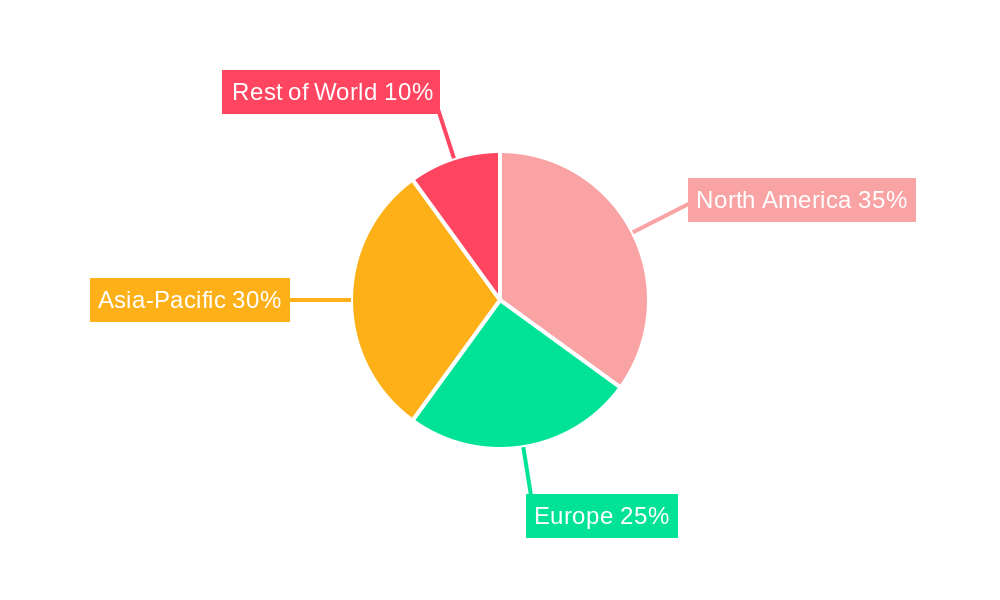
North America and Asia-Pacific are anticipated to be the dominant regions for household HD UST projectors, driving the majority of market growth.
North America: Strong demand is fueled by higher disposable incomes, early adoption of new technologies, and a preference for home entertainment. The market size in 2025 is estimated at xx million units.
Asia-Pacific: Rapid economic growth, increasing urbanization, and a growing middle class are major drivers. China, Japan, and South Korea are key growth markets in this region, with a combined market size projected to reach xx million units in 2025.
Europe: The market in Europe is expected to show steady growth, driven by increasing demand for high-quality home entertainment systems. However, the growth rate may be comparatively slower than in North America or Asia-Pacific.
Key drivers for the dominant regions include:
Favorable economic conditions: High disposable incomes and robust economic growth create a favorable environment for higher-priced consumer electronics like HD UST projectors.
Technological advancements: Continuous innovation in display technology makes UST projectors more efficient, affordable, and desirable.
Government support (in some regions): Government initiatives promoting digitalization and technological adoption can boost the market.
Household HD UST Projectors Product Landscape
The household HD UST projector market offers a range of products with varying features and specifications. Key innovations include increased brightness, improved color accuracy, enhanced portability, and built-in smart features like voice control and Wi-Fi connectivity. Higher resolution options, including 4K and even early adoption of 8K, are becoming more prevalent. These advancements provide users with a superior viewing experience, driving market growth. Unique selling propositions include compact design, ease of setup, and the ability to project large images from short distances.
Key Drivers, Barriers & Challenges in Household HD UST Projectors
Key Drivers:
- Increasing demand for large-screen home entertainment.
- Technological advancements resulting in improved image quality, brightness, and portability.
- Rising disposable incomes in emerging markets.
Key Challenges & Restraints:
- High initial cost compared to other display technologies.
- Competition from large-screen TVs and other display alternatives.
- Supply chain disruptions impacting component availability and manufacturing costs. The estimated impact on the market size in 2025 is approximately xx million units.
Emerging Opportunities in Household HD UST Projectors
Emerging opportunities lie in the expansion into untapped markets in developing regions, the integration of augmented reality (AR) and virtual reality (VR) features, and the development of niche applications, such as interactive education tools. The growing trend of smart home integration also presents an opportunity for enhanced functionalities and user experience.
Growth Accelerators in the Household HD UST Projectors Industry
Technological advancements, strategic partnerships to expand distribution networks, and the development of innovative applications will be key growth catalysts in the coming years. Focus on affordability and improving user experience will drive wider market adoption.
Notable Milestones in Household HD UST Projectors Sector
- 2020: Introduction of the first commercially viable 4K UST projector with laser light source.
- 2022: Several major players announced strategic partnerships to improve distribution networks and reach wider customer bases.
- 2023: Significant increase in the number of UST projectors featuring built-in smart features such as voice control and streaming applications.
In-Depth Household HD UST Projectors Market Outlook
The household HD UST projector market is poised for continued growth over the forecast period. Technological advancements, increasing demand for large-screen home entertainment, and strategic market expansion initiatives will contribute to this expansion. The focus on innovative features, improved affordability, and wider distribution channels will unlock significant future market potential.
Household HD UST Projectors Segmentation
-
1. Application
- 1.1. Living Room
- 1.2. Bedroom
-
2. Types
- 2.1. 1080P
- 2.2. 2K
- 2.3. 4K
- 2.4. Other
Household HD UST Projectors Segmentation By Geography
-
1. North America
- 1.1. United States
- 1.2. Canada
- 1.3. Mexico
-
2. South America
- 2.1. Brazil
- 2.2. Argentina
- 2.3. Rest of South America
-
3. Europe
- 3.1. United Kingdom
- 3.2. Germany
- 3.3. France
- 3.4. Italy
- 3.5. Spain
- 3.6. Russia
- 3.7. Benelux
- 3.8. Nordics
- 3.9. Rest of Europe
-
4. Middle East & Africa
- 4.1. Turkey
- 4.2. Israel
- 4.3. GCC
- 4.4. North Africa
- 4.5. South Africa
- 4.6. Rest of Middle East & Africa
-
5. Asia Pacific
- 5.1. China
- 5.2. India
- 5.3. Japan
- 5.4. South Korea
- 5.5. ASEAN
- 5.6. Oceania
- 5.7. Rest of Asia Pacific
Household HD UST Projectors Regional Market Share
Geographic Coverage of Household HD UST Projectors
Household HD UST Projectors REPORT HIGHLIGHTS
| Aspects | Details |
|---|---|
| Study Period | 2020-2034 |
| Base Year | 2025 |
| Estimated Year | 2026 |
| Forecast Period | 2026-2034 |
| Historical Period | 2020-2025 |
| Growth Rate | CAGR of XX% from 2020-2034 |
| Segmentation |
|
Table of Contents
- 1. Introduction
- 1.1. Research Scope
- 1.2. Market Segmentation
- 1.3. Research Objective
- 1.4. Definitions and Assumptions
- 2. Executive Summary
- 2.1. Market Snapshot
- 3. Market Dynamics
- 3.1. Market Drivers
- 3.2. Market Restrains
- 3.3. Market Trends
- 3.4. Market Opportunities
- 4. Market Factor Analysis
- 4.1. Porters Five Forces
- 4.1.1. Bargaining Power of Suppliers
- 4.1.2. Bargaining Power of Buyers
- 4.1.3. Threat of New Entrants
- 4.1.4. Threat of Substitutes
- 4.1.5. Competitive Rivalry
- 4.2. PESTEL analysis
- 4.3. BCG Analysis
- 4.3.1. Stars (High Growth, High Market Share)
- 4.3.2. Cash Cows (Low Growth, High Market Share)
- 4.3.3. Question Mark (High Growth, Low Market Share)
- 4.3.4. Dogs (Low Growth, Low Market Share)
- 4.4. Ansoff Matrix Analysis
- 4.5. Supply Chain Analysis
- 4.6. Regulatory Landscape
- 4.7. Current Market Potential and Opportunity Assessment (TAM–SAM–SOM Framework)
- 4.8. VDR Analyst Note
- 4.1. Porters Five Forces
- 5. Market Analysis, Insights and Forecast 2021-2033
- 5.1. Market Analysis, Insights and Forecast - by Application
- 5.1.1. Living Room
- 5.1.2. Bedroom
- 5.2. Market Analysis, Insights and Forecast - by Types
- 5.2.1. 1080P
- 5.2.2. 2K
- 5.2.3. 4K
- 5.2.4. Other
- 5.3. Market Analysis, Insights and Forecast - by Region
- 5.3.1. North America
- 5.3.2. South America
- 5.3.3. Europe
- 5.3.4. Middle East & Africa
- 5.3.5. Asia Pacific
- 5.1. Market Analysis, Insights and Forecast - by Application
- 6. Global Household HD UST Projectors Analysis, Insights and Forecast, 2021-2033
- 6.1. Market Analysis, Insights and Forecast - by Application
- 6.1.1. Living Room
- 6.1.2. Bedroom
- 6.2. Market Analysis, Insights and Forecast - by Types
- 6.2.1. 1080P
- 6.2.2. 2K
- 6.2.3. 4K
- 6.2.4. Other
- 6.1. Market Analysis, Insights and Forecast - by Application
- 7. North America Household HD UST Projectors Analysis, Insights and Forecast, 2021-2033
- 7.1. Market Analysis, Insights and Forecast - by Application
- 7.1.1. Living Room
- 7.1.2. Bedroom
- 7.2. Market Analysis, Insights and Forecast - by Types
- 7.2.1. 1080P
- 7.2.2. 2K
- 7.2.3. 4K
- 7.2.4. Other
- 7.1. Market Analysis, Insights and Forecast - by Application
- 8. South America Household HD UST Projectors Analysis, Insights and Forecast, 2021-2033
- 8.1. Market Analysis, Insights and Forecast - by Application
- 8.1.1. Living Room
- 8.1.2. Bedroom
- 8.2. Market Analysis, Insights and Forecast - by Types
- 8.2.1. 1080P
- 8.2.2. 2K
- 8.2.3. 4K
- 8.2.4. Other
- 8.1. Market Analysis, Insights and Forecast - by Application
- 9. Europe Household HD UST Projectors Analysis, Insights and Forecast, 2021-2033
- 9.1. Market Analysis, Insights and Forecast - by Application
- 9.1.1. Living Room
- 9.1.2. Bedroom
- 9.2. Market Analysis, Insights and Forecast - by Types
- 9.2.1. 1080P
- 9.2.2. 2K
- 9.2.3. 4K
- 9.2.4. Other
- 9.1. Market Analysis, Insights and Forecast - by Application
- 10. Middle East & Africa Household HD UST Projectors Analysis, Insights and Forecast, 2021-2033
- 10.1. Market Analysis, Insights and Forecast - by Application
- 10.1.1. Living Room
- 10.1.2. Bedroom
- 10.2. Market Analysis, Insights and Forecast - by Types
- 10.2.1. 1080P
- 10.2.2. 2K
- 10.2.3. 4K
- 10.2.4. Other
- 10.1. Market Analysis, Insights and Forecast - by Application
- 11. Asia Pacific Household HD UST Projectors Analysis, Insights and Forecast, 2021-2033
- 11.1. Market Analysis, Insights and Forecast - by Application
- 11.1.1. Living Room
- 11.1.2. Bedroom
- 11.2. Market Analysis, Insights and Forecast - by Types
- 11.2.1. 1080P
- 11.2.2. 2K
- 11.2.3. 4K
- 11.2.4. Other
- 11.1. Market Analysis, Insights and Forecast - by Application
- 12. Competitive Analysis
- 12.1. Company Profiles
- 12.1.1 SONY
- 12.1.1.1. Company Overview
- 12.1.1.2. Products
- 12.1.1.3. Company Financials
- 12.1.1.4. SWOT Analysis
- 12.1.2 Optoma
- 12.1.2.1. Company Overview
- 12.1.2.2. Products
- 12.1.2.3. Company Financials
- 12.1.2.4. SWOT Analysis
- 12.1.3 Dell
- 12.1.3.1. Company Overview
- 12.1.3.2. Products
- 12.1.3.3. Company Financials
- 12.1.3.4. SWOT Analysis
- 12.1.4 LG
- 12.1.4.1. Company Overview
- 12.1.4.2. Products
- 12.1.4.3. Company Financials
- 12.1.4.4. SWOT Analysis
- 12.1.5 VAVA
- 12.1.5.1. Company Overview
- 12.1.5.2. Products
- 12.1.5.3. Company Financials
- 12.1.5.4. SWOT Analysis
- 12.1.6 BenQ
- 12.1.6.1. Company Overview
- 12.1.6.2. Products
- 12.1.6.3. Company Financials
- 12.1.6.4. SWOT Analysis
- 12.1.1 SONY
- 12.2. Market Entropy
- 12.2.1 Company's Key Areas Served
- 12.2.2 Recent Developments
- 12.3. Company Market Share Analysis 2025
- 12.3.1 Top 5 Companies Market Share Analysis
- 12.3.2 Top 3 Companies Market Share Analysis
- 12.4. List of Potential Customers
- 13. Research Methodology
List of Figures
- Figure 1: Global Household HD UST Projectors Revenue Breakdown (million, %) by Region 2025 & 2033
- Figure 2: Global Household HD UST Projectors Volume Breakdown (K, %) by Region 2025 & 2033
- Figure 3: North America Household HD UST Projectors Revenue (million), by Application 2025 & 2033
- Figure 4: North America Household HD UST Projectors Volume (K), by Application 2025 & 2033
- Figure 5: North America Household HD UST Projectors Revenue Share (%), by Application 2025 & 2033
- Figure 6: North America Household HD UST Projectors Volume Share (%), by Application 2025 & 2033
- Figure 7: North America Household HD UST Projectors Revenue (million), by Types 2025 & 2033
- Figure 8: North America Household HD UST Projectors Volume (K), by Types 2025 & 2033
- Figure 9: North America Household HD UST Projectors Revenue Share (%), by Types 2025 & 2033
- Figure 10: North America Household HD UST Projectors Volume Share (%), by Types 2025 & 2033
- Figure 11: North America Household HD UST Projectors Revenue (million), by Country 2025 & 2033
- Figure 12: North America Household HD UST Projectors Volume (K), by Country 2025 & 2033
- Figure 13: North America Household HD UST Projectors Revenue Share (%), by Country 2025 & 2033
- Figure 14: North America Household HD UST Projectors Volume Share (%), by Country 2025 & 2033
- Figure 15: South America Household HD UST Projectors Revenue (million), by Application 2025 & 2033
- Figure 16: South America Household HD UST Projectors Volume (K), by Application 2025 & 2033
- Figure 17: South America Household HD UST Projectors Revenue Share (%), by Application 2025 & 2033
- Figure 18: South America Household HD UST Projectors Volume Share (%), by Application 2025 & 2033
- Figure 19: South America Household HD UST Projectors Revenue (million), by Types 2025 & 2033
- Figure 20: South America Household HD UST Projectors Volume (K), by Types 2025 & 2033
- Figure 21: South America Household HD UST Projectors Revenue Share (%), by Types 2025 & 2033
- Figure 22: South America Household HD UST Projectors Volume Share (%), by Types 2025 & 2033
- Figure 23: South America Household HD UST Projectors Revenue (million), by Country 2025 & 2033
- Figure 24: South America Household HD UST Projectors Volume (K), by Country 2025 & 2033
- Figure 25: South America Household HD UST Projectors Revenue Share (%), by Country 2025 & 2033
- Figure 26: South America Household HD UST Projectors Volume Share (%), by Country 2025 & 2033
- Figure 27: Europe Household HD UST Projectors Revenue (million), by Application 2025 & 2033
- Figure 28: Europe Household HD UST Projectors Volume (K), by Application 2025 & 2033
- Figure 29: Europe Household HD UST Projectors Revenue Share (%), by Application 2025 & 2033
- Figure 30: Europe Household HD UST Projectors Volume Share (%), by Application 2025 & 2033
- Figure 31: Europe Household HD UST Projectors Revenue (million), by Types 2025 & 2033
- Figure 32: Europe Household HD UST Projectors Volume (K), by Types 2025 & 2033
- Figure 33: Europe Household HD UST Projectors Revenue Share (%), by Types 2025 & 2033
- Figure 34: Europe Household HD UST Projectors Volume Share (%), by Types 2025 & 2033
- Figure 35: Europe Household HD UST Projectors Revenue (million), by Country 2025 & 2033
- Figure 36: Europe Household HD UST Projectors Volume (K), by Country 2025 & 2033
- Figure 37: Europe Household HD UST Projectors Revenue Share (%), by Country 2025 & 2033
- Figure 38: Europe Household HD UST Projectors Volume Share (%), by Country 2025 & 2033
- Figure 39: Middle East & Africa Household HD UST Projectors Revenue (million), by Application 2025 & 2033
- Figure 40: Middle East & Africa Household HD UST Projectors Volume (K), by Application 2025 & 2033
- Figure 41: Middle East & Africa Household HD UST Projectors Revenue Share (%), by Application 2025 & 2033
- Figure 42: Middle East & Africa Household HD UST Projectors Volume Share (%), by Application 2025 & 2033
- Figure 43: Middle East & Africa Household HD UST Projectors Revenue (million), by Types 2025 & 2033
- Figure 44: Middle East & Africa Household HD UST Projectors Volume (K), by Types 2025 & 2033
- Figure 45: Middle East & Africa Household HD UST Projectors Revenue Share (%), by Types 2025 & 2033
- Figure 46: Middle East & Africa Household HD UST Projectors Volume Share (%), by Types 2025 & 2033
- Figure 47: Middle East & Africa Household HD UST Projectors Revenue (million), by Country 2025 & 2033
- Figure 48: Middle East & Africa Household HD UST Projectors Volume (K), by Country 2025 & 2033
- Figure 49: Middle East & Africa Household HD UST Projectors Revenue Share (%), by Country 2025 & 2033
- Figure 50: Middle East & Africa Household HD UST Projectors Volume Share (%), by Country 2025 & 2033
- Figure 51: Asia Pacific Household HD UST Projectors Revenue (million), by Application 2025 & 2033
- Figure 52: Asia Pacific Household HD UST Projectors Volume (K), by Application 2025 & 2033
- Figure 53: Asia Pacific Household HD UST Projectors Revenue Share (%), by Application 2025 & 2033
- Figure 54: Asia Pacific Household HD UST Projectors Volume Share (%), by Application 2025 & 2033
- Figure 55: Asia Pacific Household HD UST Projectors Revenue (million), by Types 2025 & 2033
- Figure 56: Asia Pacific Household HD UST Projectors Volume (K), by Types 2025 & 2033
- Figure 57: Asia Pacific Household HD UST Projectors Revenue Share (%), by Types 2025 & 2033
- Figure 58: Asia Pacific Household HD UST Projectors Volume Share (%), by Types 2025 & 2033
- Figure 59: Asia Pacific Household HD UST Projectors Revenue (million), by Country 2025 & 2033
- Figure 60: Asia Pacific Household HD UST Projectors Volume (K), by Country 2025 & 2033
- Figure 61: Asia Pacific Household HD UST Projectors Revenue Share (%), by Country 2025 & 2033
- Figure 62: Asia Pacific Household HD UST Projectors Volume Share (%), by Country 2025 & 2033
List of Tables
- Table 1: Global Household HD UST Projectors Revenue million Forecast, by Application 2020 & 2033
- Table 2: Global Household HD UST Projectors Volume K Forecast, by Application 2020 & 2033
- Table 3: Global Household HD UST Projectors Revenue million Forecast, by Types 2020 & 2033
- Table 4: Global Household HD UST Projectors Volume K Forecast, by Types 2020 & 2033
- Table 5: Global Household HD UST Projectors Revenue million Forecast, by Region 2020 & 2033
- Table 6: Global Household HD UST Projectors Volume K Forecast, by Region 2020 & 2033
- Table 7: Global Household HD UST Projectors Revenue million Forecast, by Application 2020 & 2033
- Table 8: Global Household HD UST Projectors Volume K Forecast, by Application 2020 & 2033
- Table 9: Global Household HD UST Projectors Revenue million Forecast, by Types 2020 & 2033
- Table 10: Global Household HD UST Projectors Volume K Forecast, by Types 2020 & 2033
- Table 11: Global Household HD UST Projectors Revenue million Forecast, by Country 2020 & 2033
- Table 12: Global Household HD UST Projectors Volume K Forecast, by Country 2020 & 2033
- Table 13: United States Household HD UST Projectors Revenue (million) Forecast, by Application 2020 & 2033
- Table 14: United States Household HD UST Projectors Volume (K) Forecast, by Application 2020 & 2033
- Table 15: Canada Household HD UST Projectors Revenue (million) Forecast, by Application 2020 & 2033
- Table 16: Canada Household HD UST Projectors Volume (K) Forecast, by Application 2020 & 2033
- Table 17: Mexico Household HD UST Projectors Revenue (million) Forecast, by Application 2020 & 2033
- Table 18: Mexico Household HD UST Projectors Volume (K) Forecast, by Application 2020 & 2033
- Table 19: Global Household HD UST Projectors Revenue million Forecast, by Application 2020 & 2033
- Table 20: Global Household HD UST Projectors Volume K Forecast, by Application 2020 & 2033
- Table 21: Global Household HD UST Projectors Revenue million Forecast, by Types 2020 & 2033
- Table 22: Global Household HD UST Projectors Volume K Forecast, by Types 2020 & 2033
- Table 23: Global Household HD UST Projectors Revenue million Forecast, by Country 2020 & 2033
- Table 24: Global Household HD UST Projectors Volume K Forecast, by Country 2020 & 2033
- Table 25: Brazil Household HD UST Projectors Revenue (million) Forecast, by Application 2020 & 2033
- Table 26: Brazil Household HD UST Projectors Volume (K) Forecast, by Application 2020 & 2033
- Table 27: Argentina Household HD UST Projectors Revenue (million) Forecast, by Application 2020 & 2033
- Table 28: Argentina Household HD UST Projectors Volume (K) Forecast, by Application 2020 & 2033
- Table 29: Rest of South America Household HD UST Projectors Revenue (million) Forecast, by Application 2020 & 2033
- Table 30: Rest of South America Household HD UST Projectors Volume (K) Forecast, by Application 2020 & 2033
- Table 31: Global Household HD UST Projectors Revenue million Forecast, by Application 2020 & 2033
- Table 32: Global Household HD UST Projectors Volume K Forecast, by Application 2020 & 2033
- Table 33: Global Household HD UST Projectors Revenue million Forecast, by Types 2020 & 2033
- Table 34: Global Household HD UST Projectors Volume K Forecast, by Types 2020 & 2033
- Table 35: Global Household HD UST Projectors Revenue million Forecast, by Country 2020 & 2033
- Table 36: Global Household HD UST Projectors Volume K Forecast, by Country 2020 & 2033
- Table 37: United Kingdom Household HD UST Projectors Revenue (million) Forecast, by Application 2020 & 2033
- Table 38: United Kingdom Household HD UST Projectors Volume (K) Forecast, by Application 2020 & 2033
- Table 39: Germany Household HD UST Projectors Revenue (million) Forecast, by Application 2020 & 2033
- Table 40: Germany Household HD UST Projectors Volume (K) Forecast, by Application 2020 & 2033
- Table 41: France Household HD UST Projectors Revenue (million) Forecast, by Application 2020 & 2033
- Table 42: France Household HD UST Projectors Volume (K) Forecast, by Application 2020 & 2033
- Table 43: Italy Household HD UST Projectors Revenue (million) Forecast, by Application 2020 & 2033
- Table 44: Italy Household HD UST Projectors Volume (K) Forecast, by Application 2020 & 2033
- Table 45: Spain Household HD UST Projectors Revenue (million) Forecast, by Application 2020 & 2033
- Table 46: Spain Household HD UST Projectors Volume (K) Forecast, by Application 2020 & 2033
- Table 47: Russia Household HD UST Projectors Revenue (million) Forecast, by Application 2020 & 2033
- Table 48: Russia Household HD UST Projectors Volume (K) Forecast, by Application 2020 & 2033
- Table 49: Benelux Household HD UST Projectors Revenue (million) Forecast, by Application 2020 & 2033
- Table 50: Benelux Household HD UST Projectors Volume (K) Forecast, by Application 2020 & 2033
- Table 51: Nordics Household HD UST Projectors Revenue (million) Forecast, by Application 2020 & 2033
- Table 52: Nordics Household HD UST Projectors Volume (K) Forecast, by Application 2020 & 2033
- Table 53: Rest of Europe Household HD UST Projectors Revenue (million) Forecast, by Application 2020 & 2033
- Table 54: Rest of Europe Household HD UST Projectors Volume (K) Forecast, by Application 2020 & 2033
- Table 55: Global Household HD UST Projectors Revenue million Forecast, by Application 2020 & 2033
- Table 56: Global Household HD UST Projectors Volume K Forecast, by Application 2020 & 2033
- Table 57: Global Household HD UST Projectors Revenue million Forecast, by Types 2020 & 2033
- Table 58: Global Household HD UST Projectors Volume K Forecast, by Types 2020 & 2033
- Table 59: Global Household HD UST Projectors Revenue million Forecast, by Country 2020 & 2033
- Table 60: Global Household HD UST Projectors Volume K Forecast, by Country 2020 & 2033
- Table 61: Turkey Household HD UST Projectors Revenue (million) Forecast, by Application 2020 & 2033
- Table 62: Turkey Household HD UST Projectors Volume (K) Forecast, by Application 2020 & 2033
- Table 63: Israel Household HD UST Projectors Revenue (million) Forecast, by Application 2020 & 2033
- Table 64: Israel Household HD UST Projectors Volume (K) Forecast, by Application 2020 & 2033
- Table 65: GCC Household HD UST Projectors Revenue (million) Forecast, by Application 2020 & 2033
- Table 66: GCC Household HD UST Projectors Volume (K) Forecast, by Application 2020 & 2033
- Table 67: North Africa Household HD UST Projectors Revenue (million) Forecast, by Application 2020 & 2033
- Table 68: North Africa Household HD UST Projectors Volume (K) Forecast, by Application 2020 & 2033
- Table 69: South Africa Household HD UST Projectors Revenue (million) Forecast, by Application 2020 & 2033
- Table 70: South Africa Household HD UST Projectors Volume (K) Forecast, by Application 2020 & 2033
- Table 71: Rest of Middle East & Africa Household HD UST Projectors Revenue (million) Forecast, by Application 2020 & 2033
- Table 72: Rest of Middle East & Africa Household HD UST Projectors Volume (K) Forecast, by Application 2020 & 2033
- Table 73: Global Household HD UST Projectors Revenue million Forecast, by Application 2020 & 2033
- Table 74: Global Household HD UST Projectors Volume K Forecast, by Application 2020 & 2033
- Table 75: Global Household HD UST Projectors Revenue million Forecast, by Types 2020 & 2033
- Table 76: Global Household HD UST Projectors Volume K Forecast, by Types 2020 & 2033
- Table 77: Global Household HD UST Projectors Revenue million Forecast, by Country 2020 & 2033
- Table 78: Global Household HD UST Projectors Volume K Forecast, by Country 2020 & 2033
- Table 79: China Household HD UST Projectors Revenue (million) Forecast, by Application 2020 & 2033
- Table 80: China Household HD UST Projectors Volume (K) Forecast, by Application 2020 & 2033
- Table 81: India Household HD UST Projectors Revenue (million) Forecast, by Application 2020 & 2033
- Table 82: India Household HD UST Projectors Volume (K) Forecast, by Application 2020 & 2033
- Table 83: Japan Household HD UST Projectors Revenue (million) Forecast, by Application 2020 & 2033
- Table 84: Japan Household HD UST Projectors Volume (K) Forecast, by Application 2020 & 2033
- Table 85: South Korea Household HD UST Projectors Revenue (million) Forecast, by Application 2020 & 2033
- Table 86: South Korea Household HD UST Projectors Volume (K) Forecast, by Application 2020 & 2033
- Table 87: ASEAN Household HD UST Projectors Revenue (million) Forecast, by Application 2020 & 2033
- Table 88: ASEAN Household HD UST Projectors Volume (K) Forecast, by Application 2020 & 2033
- Table 89: Oceania Household HD UST Projectors Revenue (million) Forecast, by Application 2020 & 2033
- Table 90: Oceania Household HD UST Projectors Volume (K) Forecast, by Application 2020 & 2033
- Table 91: Rest of Asia Pacific Household HD UST Projectors Revenue (million) Forecast, by Application 2020 & 2033
- Table 92: Rest of Asia Pacific Household HD UST Projectors Volume (K) Forecast, by Application 2020 & 2033
Frequently Asked Questions
1. What is the projected Compound Annual Growth Rate (CAGR) of the Household HD UST Projectors?
The projected CAGR is approximately XX%.
2. Which companies are prominent players in the Household HD UST Projectors?
Key companies in the market include SONY, Optoma, Dell, LG, VAVA, BenQ.
3. What are the main segments of the Household HD UST Projectors?
The market segments include Application, Types.
4. Can you provide details about the market size?
The market size is estimated to be USD XXX million as of 2022.
5. What are some drivers contributing to market growth?
N/A
6. What are the notable trends driving market growth?
N/A
7. Are there any restraints impacting market growth?
N/A
8. Can you provide examples of recent developments in the market?
N/A
9. What pricing options are available for accessing the report?
Pricing options include single-user, multi-user, and enterprise licenses priced at USD 3350.00, USD 5025.00, and USD 6700.00 respectively.
10. Is the market size provided in terms of value or volume?
The market size is provided in terms of value, measured in million and volume, measured in K.
11. Are there any specific market keywords associated with the report?
Yes, the market keyword associated with the report is "Household HD UST Projectors," which aids in identifying and referencing the specific market segment covered.
12. How do I determine which pricing option suits my needs best?
The pricing options vary based on user requirements and access needs. Individual users may opt for single-user licenses, while businesses requiring broader access may choose multi-user or enterprise licenses for cost-effective access to the report.
13. Are there any additional resources or data provided in the Household HD UST Projectors report?
While the report offers comprehensive insights, it's advisable to review the specific contents or supplementary materials provided to ascertain if additional resources or data are available.
14. How can I stay updated on further developments or reports in the Household HD UST Projectors?
To stay informed about further developments, trends, and reports in the Household HD UST Projectors, consider subscribing to industry newsletters, following relevant companies and organizations, or regularly checking reputable industry news sources and publications.
Methodology
Step 1 - Identification of Relevant Samples Size from Population Database


Step 2 - Approaches for Defining Global Market Size (Value, Volume* & Price*)

Note*: In applicable scenarios
Step 3 - Data Sources
Primary Research
- Web Analytics
- Survey Reports
- Research Institute
- Latest Research Reports
- Opinion Leaders
Secondary Research
- Annual Reports
- White Paper
- Latest Press Release
- Industry Association
- Paid Database
- Investor Presentations

Step 4 - Data Triangulation
Involves using different sources of information in order to increase the validity of a study
These sources are likely to be stakeholders in a program - participants, other researchers, program staff, other community members, and so on.
Then we put all data in single framework & apply various statistical tools to find out the dynamic on the market.
During the analysis stage, feedback from the stakeholder groups would be compared to determine areas of agreement as well as areas of divergence