
Key Insights
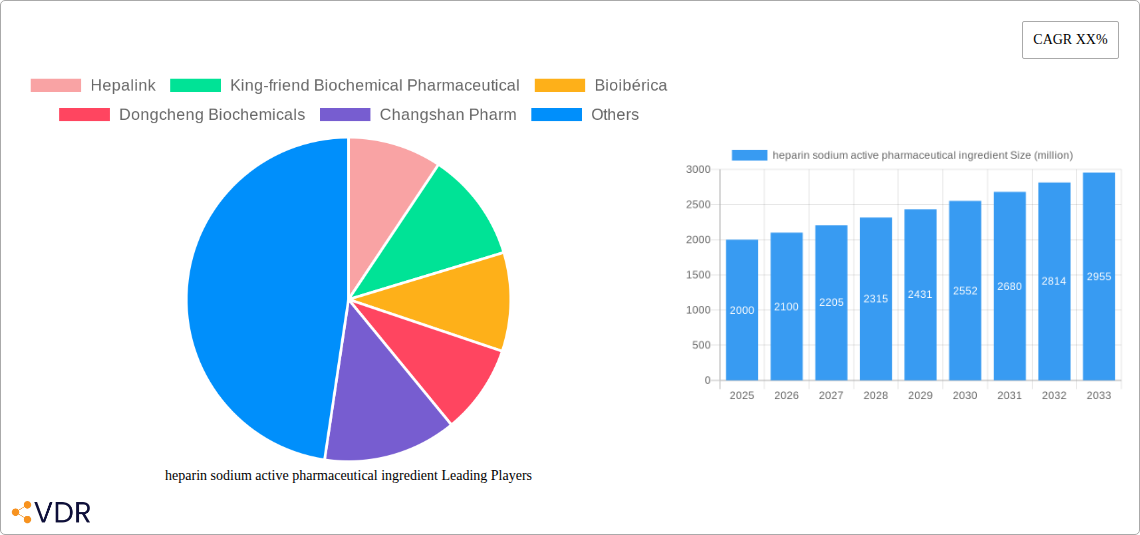
The heparin sodium active pharmaceutical ingredient (API) market is experiencing robust growth, driven by the increasing prevalence of cardiovascular diseases and the consequent rising demand for anticoagulant therapies. The market, estimated at $2 billion in 2025, is projected to exhibit a Compound Annual Growth Rate (CAGR) of approximately 5% from 2025 to 2033, reaching an estimated market value of $2.8 billion by 2033. This growth is fueled by several factors, including advancements in drug delivery systems leading to improved efficacy and reduced side effects, the expansion of the geriatric population (a high-risk group for thromboembolic events), and the growing adoption of minimally invasive surgical procedures. Furthermore, the increasing awareness of venous thromboembolism (VTE) and the subsequent increase in preventative measures contribute significantly to market expansion. Key players like Hepalink, Pfizer, and Bioibérica are actively engaged in research and development, striving to improve heparin production methods and introduce innovative formulations.
However, the market faces certain challenges. Stringent regulatory approvals and the complexities associated with ensuring consistent quality and purity of heparin sourced from porcine intestines pose significant restraints. The potential for contamination and the high cost of production also impact market growth. Nevertheless, the ongoing investments in research and development, particularly exploring alternative sources of heparin and synthetic production methods, are expected to mitigate some of these constraints. The market is segmented based on various factors such as drug formulation (e.g., unfractionated heparin, low molecular weight heparin), application (e.g., prophylactic and therapeutic use), and end-user (hospitals, clinics, and home healthcare settings). Regional variations exist due to varying healthcare infrastructure and disease prevalence rates.
Heparin Sodium Active Pharmaceutical Ingredient Market Report: 2019-2033
This comprehensive report provides a detailed analysis of the Heparin Sodium Active Pharmaceutical Ingredient (API) market, encompassing market dynamics, growth trends, regional dominance, product landscape, key players, and future outlook. The study period covers 2019-2033, with a base year of 2025 and a forecast period of 2025-2033. This report is crucial for industry professionals, investors, and researchers seeking in-depth insights into this vital segment of the pharmaceutical industry. The parent market is the anticoagulant market and the child market is the API market for heparin-based drugs. Market values are presented in million units.
Heparin Sodium Active Pharmaceutical Ingredient Market Dynamics & Structure
The Heparin Sodium API market is characterized by moderate concentration, with a few major players holding significant market share. Technological innovation, primarily focused on improving purity and reducing the risk of contamination (e.g., porcine-derived vs. other sources), is a key driver. Stringent regulatory frameworks, particularly concerning manufacturing processes and quality control, heavily influence market dynamics. Competitive substitutes, such as direct thrombin inhibitors and factor Xa inhibitors, exert pressure, though heparin sodium retains its importance in specific therapeutic areas. End-user demographics, largely focused on hospitals and pharmaceutical manufacturers, significantly impact demand. M&A activity within the sector is moderate, with approximately xx deals recorded between 2019 and 2024, resulting in a xx% market share shift among the top 5 players.
- Market Concentration: Moderately concentrated, with top 5 players holding xx% market share in 2024.
- Technological Innovation: Focus on improved purity, reduced contamination risk, and efficient manufacturing processes.
- Regulatory Framework: Stringent regulations impacting manufacturing and quality control.
- Competitive Substitutes: Direct thrombin and factor Xa inhibitors pose some competitive pressure.
- M&A Activity: Approx. xx deals between 2019-2024, leading to xx% market share shift among top 5 players.
- Innovation Barriers: High regulatory hurdles and significant investment required for process optimization.
Heparin Sodium Active Pharmaceutical Ingredient Growth Trends & Insights
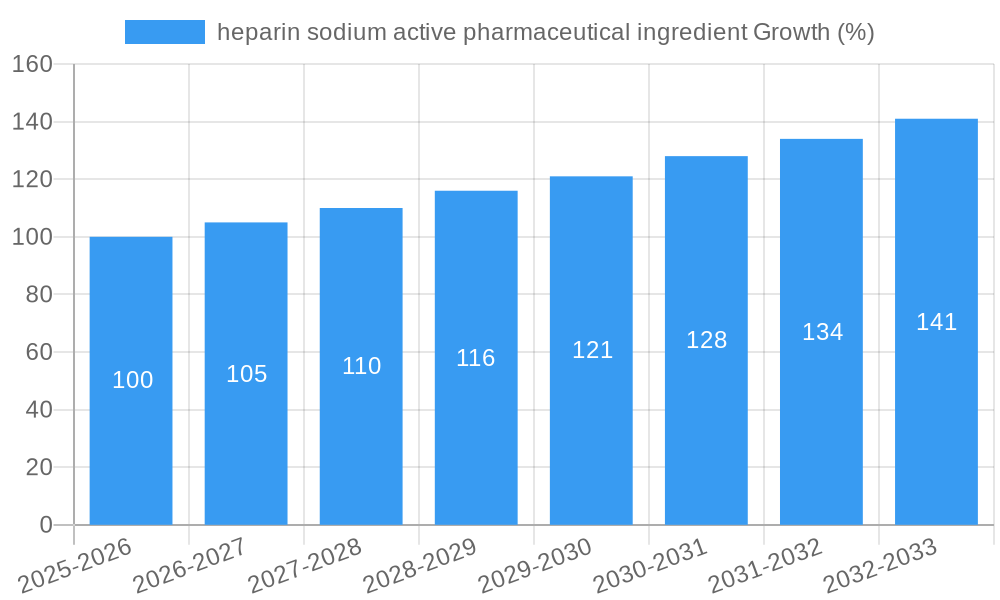
The Heparin Sodium API market witnessed a CAGR of xx% during the historical period (2019-2024), driven by the increasing prevalence of thromboembolic disorders and the continued use of heparin in various medical applications. The market size reached xx million units in 2024, and is projected to reach xx million units by 2033, exhibiting a forecast CAGR of xx%. Adoption rates remain high due to the established efficacy and relatively low cost of heparin. However, technological disruptions in manufacturing techniques are influencing market dynamics. Consumer behavior shifts, particularly regarding demand for higher-purity products and increased transparency regarding sourcing, are shaping market trends. Future growth will be influenced by technological advancements, increasing global demand, and managing risks associated with sourcing and quality control.
Dominant Regions, Countries, or Segments in Heparin Sodium Active Pharmaceutical Ingredient
The Asia-Pacific region, specifically China and India, currently dominate the Heparin Sodium API market, driven by factors including increasing healthcare spending, a large aging population requiring anticoagulant therapy, and cost-effective manufacturing. North America and Europe also hold significant market share but with slower growth rates compared to the APAC region.
- Key Drivers in Asia-Pacific:
- Rapidly growing healthcare infrastructure and increasing healthcare expenditure.
- Large population base with high prevalence of cardiovascular diseases.
- Favorable government policies supporting domestic pharmaceutical industry growth.
- Dominance Factors: Cost-effective manufacturing in Asia-Pacific and established production capacities.
- Growth Potential: Significant growth opportunities remain in emerging economies, as well as in developed markets focused on biosimilar and generic heparin production.
Heparin Sodium Active Pharmaceutical Ingredient Product Landscape
The Heparin Sodium API market offers various grades and purities of the product, catering to different applications. Innovations focus on improving manufacturing processes to enhance purity, reduce impurities, and minimize the risk of contamination. This includes the development of advanced purification techniques and stringent quality control measures. Key performance metrics include purity levels, molecular weight distribution, and the absence of contaminants. A key selling proposition is consistently high-quality product with minimal risk of adverse effects.
Key Drivers, Barriers & Challenges in Heparin Sodium Active Pharmaceutical Ingredient
Key Drivers:
- Rising prevalence of thromboembolic disorders globally.
- Increased demand for anticoagulant therapies in cardiovascular and surgical procedures.
- Technological advancements in manufacturing processes leading to enhanced purity and safety.
Key Challenges:
- Strict regulatory requirements leading to high production costs.
- Potential supply chain disruptions due to reliance on specific raw materials (e.g., porcine intestinal mucosa).
- Competition from alternative anticoagulants. This has caused a xx% decrease in market share for some producers between 2020 and 2024.
Emerging Opportunities in Heparin Sodium Active Pharmaceutical Ingredient
- Development of biosimilars to reduce costs and improve accessibility.
- Expansion into emerging markets with growing healthcare sectors.
- Innovation in drug delivery systems for improved patient compliance.
Growth Accelerators in the Heparin Sodium Active Pharmaceutical Ingredient Industry
Technological advancements in manufacturing, especially in the areas of purification and quality control, are major growth accelerators. Strategic partnerships between API manufacturers and pharmaceutical companies to ensure stable supply chains are crucial. Furthermore, market expansion into underserved regions with rising healthcare demands will accelerate growth.
Key Players Shaping the Heparin Sodium Active Pharmaceutical Ingredient Market
- Hepalink
- King-friend Biochemical Pharmaceutical
- Bioibérica
- Dongcheng Biochemicals
- Changshan Pharm
- Pfizer
- Jiulong Biochemicals
- Qianhong Bio-pharma
- Tiandong
- Opocrin
- Yino Pharma Limited
- Xinbai
- Deebio
Notable Milestones in Heparin Sodium Active Pharmaceutical Ingredient Sector
- 2020: Introduction of a new purification technology by Hepalink, resulting in a higher purity product.
- 2022: A major merger between two leading manufacturers, leading to increased market share consolidation.
- 2023: New regulatory guidelines implemented impacting manufacturing processes and quality control.
In-Depth Heparin Sodium Active Pharmaceutical Ingredient Market Outlook
The Heparin Sodium API market is poised for sustained growth over the forecast period, driven by technological advancements, expanding global demand, and increased focus on improving product quality and safety. Strategic partnerships and investment in research and development will be essential for maintaining a competitive edge in this dynamic market. Opportunities exist in biosimilar development, specialized formulations, and expansion into emerging economies.
heparin sodium active pharmaceutical ingredient Segmentation
-
1. Application
- 1.1. UFH
- 1.2. LMWH
-
2. Types
- 2.1. Heparin Sodium
- 2.2. Heparin Calcium
heparin sodium active pharmaceutical ingredient Segmentation By Geography
-
1. North America
- 1.1. United States
- 1.2. Canada
- 1.3. Mexico
-
2. South America
- 2.1. Brazil
- 2.2. Argentina
- 2.3. Rest of South America
-
3. Europe
- 3.1. United Kingdom
- 3.2. Germany
- 3.3. France
- 3.4. Italy
- 3.5. Spain
- 3.6. Russia
- 3.7. Benelux
- 3.8. Nordics
- 3.9. Rest of Europe
-
4. Middle East & Africa
- 4.1. Turkey
- 4.2. Israel
- 4.3. GCC
- 4.4. North Africa
- 4.5. South Africa
- 4.6. Rest of Middle East & Africa
-
5. Asia Pacific
- 5.1. China
- 5.2. India
- 5.3. Japan
- 5.4. South Korea
- 5.5. ASEAN
- 5.6. Oceania
- 5.7. Rest of Asia Pacific

heparin sodium active pharmaceutical ingredient REPORT HIGHLIGHTS
| Aspects | Details |
|---|---|
| Study Period | 2019-2033 |
| Base Year | 2024 |
| Estimated Year | 2025 |
| Forecast Period | 2025-2033 |
| Historical Period | 2019-2024 |
| Growth Rate | CAGR of XX% from 2019-2033 |
| Segmentation |
|
Table of Contents
- 1. Introduction
- 1.1. Research Scope
- 1.2. Market Segmentation
- 1.3. Research Methodology
- 1.4. Definitions and Assumptions
- 2. Executive Summary
- 2.1. Introduction
- 3. Market Dynamics
- 3.1. Introduction
- 3.2. Market Drivers
- 3.3. Market Restrains
- 3.4. Market Trends
- 4. Market Factor Analysis
- 4.1. Porters Five Forces
- 4.2. Supply/Value Chain
- 4.3. PESTEL analysis
- 4.4. Market Entropy
- 4.5. Patent/Trademark Analysis
- 5. Global heparin sodium active pharmaceutical ingredient Analysis, Insights and Forecast, 2019-2031
- 5.1. Market Analysis, Insights and Forecast - by Application
- 5.1.1. UFH
- 5.1.2. LMWH
- 5.2. Market Analysis, Insights and Forecast - by Types
- 5.2.1. Heparin Sodium
- 5.2.2. Heparin Calcium
- 5.3. Market Analysis, Insights and Forecast - by Region
- 5.3.1. North America
- 5.3.2. South America
- 5.3.3. Europe
- 5.3.4. Middle East & Africa
- 5.3.5. Asia Pacific
- 5.1. Market Analysis, Insights and Forecast - by Application
- 6. North America heparin sodium active pharmaceutical ingredient Analysis, Insights and Forecast, 2019-2031
- 6.1. Market Analysis, Insights and Forecast - by Application
- 6.1.1. UFH
- 6.1.2. LMWH
- 6.2. Market Analysis, Insights and Forecast - by Types
- 6.2.1. Heparin Sodium
- 6.2.2. Heparin Calcium
- 6.1. Market Analysis, Insights and Forecast - by Application
- 7. South America heparin sodium active pharmaceutical ingredient Analysis, Insights and Forecast, 2019-2031
- 7.1. Market Analysis, Insights and Forecast - by Application
- 7.1.1. UFH
- 7.1.2. LMWH
- 7.2. Market Analysis, Insights and Forecast - by Types
- 7.2.1. Heparin Sodium
- 7.2.2. Heparin Calcium
- 7.1. Market Analysis, Insights and Forecast - by Application
- 8. Europe heparin sodium active pharmaceutical ingredient Analysis, Insights and Forecast, 2019-2031
- 8.1. Market Analysis, Insights and Forecast - by Application
- 8.1.1. UFH
- 8.1.2. LMWH
- 8.2. Market Analysis, Insights and Forecast - by Types
- 8.2.1. Heparin Sodium
- 8.2.2. Heparin Calcium
- 8.1. Market Analysis, Insights and Forecast - by Application
- 9. Middle East & Africa heparin sodium active pharmaceutical ingredient Analysis, Insights and Forecast, 2019-2031
- 9.1. Market Analysis, Insights and Forecast - by Application
- 9.1.1. UFH
- 9.1.2. LMWH
- 9.2. Market Analysis, Insights and Forecast - by Types
- 9.2.1. Heparin Sodium
- 9.2.2. Heparin Calcium
- 9.1. Market Analysis, Insights and Forecast - by Application
- 10. Asia Pacific heparin sodium active pharmaceutical ingredient Analysis, Insights and Forecast, 2019-2031
- 10.1. Market Analysis, Insights and Forecast - by Application
- 10.1.1. UFH
- 10.1.2. LMWH
- 10.2. Market Analysis, Insights and Forecast - by Types
- 10.2.1. Heparin Sodium
- 10.2.2. Heparin Calcium
- 10.1. Market Analysis, Insights and Forecast - by Application
- 11. Competitive Analysis
- 11.1. Global Market Share Analysis 2024
- 11.2. Company Profiles
- 11.2.1 Hepalink
- 11.2.1.1. Overview
- 11.2.1.2. Products
- 11.2.1.3. SWOT Analysis
- 11.2.1.4. Recent Developments
- 11.2.1.5. Financials (Based on Availability)
- 11.2.2 King-friend Biochemical Pharmaceutical
- 11.2.2.1. Overview
- 11.2.2.2. Products
- 11.2.2.3. SWOT Analysis
- 11.2.2.4. Recent Developments
- 11.2.2.5. Financials (Based on Availability)
- 11.2.3 Bioibérica
- 11.2.3.1. Overview
- 11.2.3.2. Products
- 11.2.3.3. SWOT Analysis
- 11.2.3.4. Recent Developments
- 11.2.3.5. Financials (Based on Availability)
- 11.2.4 Dongcheng Biochemicals
- 11.2.4.1. Overview
- 11.2.4.2. Products
- 11.2.4.3. SWOT Analysis
- 11.2.4.4. Recent Developments
- 11.2.4.5. Financials (Based on Availability)
- 11.2.5 Changshan Pharm
- 11.2.5.1. Overview
- 11.2.5.2. Products
- 11.2.5.3. SWOT Analysis
- 11.2.5.4. Recent Developments
- 11.2.5.5. Financials (Based on Availability)
- 11.2.6 Pfizer
- 11.2.6.1. Overview
- 11.2.6.2. Products
- 11.2.6.3. SWOT Analysis
- 11.2.6.4. Recent Developments
- 11.2.6.5. Financials (Based on Availability)
- 11.2.7 Jiulong Biochemicals
- 11.2.7.1. Overview
- 11.2.7.2. Products
- 11.2.7.3. SWOT Analysis
- 11.2.7.4. Recent Developments
- 11.2.7.5. Financials (Based on Availability)
- 11.2.8 Qianhong Bio-pharma
- 11.2.8.1. Overview
- 11.2.8.2. Products
- 11.2.8.3. SWOT Analysis
- 11.2.8.4. Recent Developments
- 11.2.8.5. Financials (Based on Availability)
- 11.2.9 Tiandong
- 11.2.9.1. Overview
- 11.2.9.2. Products
- 11.2.9.3. SWOT Analysis
- 11.2.9.4. Recent Developments
- 11.2.9.5. Financials (Based on Availability)
- 11.2.10 Opocrin
- 11.2.10.1. Overview
- 11.2.10.2. Products
- 11.2.10.3. SWOT Analysis
- 11.2.10.4. Recent Developments
- 11.2.10.5. Financials (Based on Availability)
- 11.2.11 Yino Pharma Limited
- 11.2.11.1. Overview
- 11.2.11.2. Products
- 11.2.11.3. SWOT Analysis
- 11.2.11.4. Recent Developments
- 11.2.11.5. Financials (Based on Availability)
- 11.2.12 Xinbai
- 11.2.12.1. Overview
- 11.2.12.2. Products
- 11.2.12.3. SWOT Analysis
- 11.2.12.4. Recent Developments
- 11.2.12.5. Financials (Based on Availability)
- 11.2.13 Deebio
- 11.2.13.1. Overview
- 11.2.13.2. Products
- 11.2.13.3. SWOT Analysis
- 11.2.13.4. Recent Developments
- 11.2.13.5. Financials (Based on Availability)
- 11.2.1 Hepalink
List of Figures
- Figure 1: Global heparin sodium active pharmaceutical ingredient Revenue Breakdown (million, %) by Region 2024 & 2032
- Figure 2: Global heparin sodium active pharmaceutical ingredient Volume Breakdown (K, %) by Region 2024 & 2032
- Figure 3: North America heparin sodium active pharmaceutical ingredient Revenue (million), by Application 2024 & 2032
- Figure 4: North America heparin sodium active pharmaceutical ingredient Volume (K), by Application 2024 & 2032
- Figure 5: North America heparin sodium active pharmaceutical ingredient Revenue Share (%), by Application 2024 & 2032
- Figure 6: North America heparin sodium active pharmaceutical ingredient Volume Share (%), by Application 2024 & 2032
- Figure 7: North America heparin sodium active pharmaceutical ingredient Revenue (million), by Types 2024 & 2032
- Figure 8: North America heparin sodium active pharmaceutical ingredient Volume (K), by Types 2024 & 2032
- Figure 9: North America heparin sodium active pharmaceutical ingredient Revenue Share (%), by Types 2024 & 2032
- Figure 10: North America heparin sodium active pharmaceutical ingredient Volume Share (%), by Types 2024 & 2032
- Figure 11: North America heparin sodium active pharmaceutical ingredient Revenue (million), by Country 2024 & 2032
- Figure 12: North America heparin sodium active pharmaceutical ingredient Volume (K), by Country 2024 & 2032
- Figure 13: North America heparin sodium active pharmaceutical ingredient Revenue Share (%), by Country 2024 & 2032
- Figure 14: North America heparin sodium active pharmaceutical ingredient Volume Share (%), by Country 2024 & 2032
- Figure 15: South America heparin sodium active pharmaceutical ingredient Revenue (million), by Application 2024 & 2032
- Figure 16: South America heparin sodium active pharmaceutical ingredient Volume (K), by Application 2024 & 2032
- Figure 17: South America heparin sodium active pharmaceutical ingredient Revenue Share (%), by Application 2024 & 2032
- Figure 18: South America heparin sodium active pharmaceutical ingredient Volume Share (%), by Application 2024 & 2032
- Figure 19: South America heparin sodium active pharmaceutical ingredient Revenue (million), by Types 2024 & 2032
- Figure 20: South America heparin sodium active pharmaceutical ingredient Volume (K), by Types 2024 & 2032
- Figure 21: South America heparin sodium active pharmaceutical ingredient Revenue Share (%), by Types 2024 & 2032
- Figure 22: South America heparin sodium active pharmaceutical ingredient Volume Share (%), by Types 2024 & 2032
- Figure 23: South America heparin sodium active pharmaceutical ingredient Revenue (million), by Country 2024 & 2032
- Figure 24: South America heparin sodium active pharmaceutical ingredient Volume (K), by Country 2024 & 2032
- Figure 25: South America heparin sodium active pharmaceutical ingredient Revenue Share (%), by Country 2024 & 2032
- Figure 26: South America heparin sodium active pharmaceutical ingredient Volume Share (%), by Country 2024 & 2032
- Figure 27: Europe heparin sodium active pharmaceutical ingredient Revenue (million), by Application 2024 & 2032
- Figure 28: Europe heparin sodium active pharmaceutical ingredient Volume (K), by Application 2024 & 2032
- Figure 29: Europe heparin sodium active pharmaceutical ingredient Revenue Share (%), by Application 2024 & 2032
- Figure 30: Europe heparin sodium active pharmaceutical ingredient Volume Share (%), by Application 2024 & 2032
- Figure 31: Europe heparin sodium active pharmaceutical ingredient Revenue (million), by Types 2024 & 2032
- Figure 32: Europe heparin sodium active pharmaceutical ingredient Volume (K), by Types 2024 & 2032
- Figure 33: Europe heparin sodium active pharmaceutical ingredient Revenue Share (%), by Types 2024 & 2032
- Figure 34: Europe heparin sodium active pharmaceutical ingredient Volume Share (%), by Types 2024 & 2032
- Figure 35: Europe heparin sodium active pharmaceutical ingredient Revenue (million), by Country 2024 & 2032
- Figure 36: Europe heparin sodium active pharmaceutical ingredient Volume (K), by Country 2024 & 2032
- Figure 37: Europe heparin sodium active pharmaceutical ingredient Revenue Share (%), by Country 2024 & 2032
- Figure 38: Europe heparin sodium active pharmaceutical ingredient Volume Share (%), by Country 2024 & 2032
- Figure 39: Middle East & Africa heparin sodium active pharmaceutical ingredient Revenue (million), by Application 2024 & 2032
- Figure 40: Middle East & Africa heparin sodium active pharmaceutical ingredient Volume (K), by Application 2024 & 2032
- Figure 41: Middle East & Africa heparin sodium active pharmaceutical ingredient Revenue Share (%), by Application 2024 & 2032
- Figure 42: Middle East & Africa heparin sodium active pharmaceutical ingredient Volume Share (%), by Application 2024 & 2032
- Figure 43: Middle East & Africa heparin sodium active pharmaceutical ingredient Revenue (million), by Types 2024 & 2032
- Figure 44: Middle East & Africa heparin sodium active pharmaceutical ingredient Volume (K), by Types 2024 & 2032
- Figure 45: Middle East & Africa heparin sodium active pharmaceutical ingredient Revenue Share (%), by Types 2024 & 2032
- Figure 46: Middle East & Africa heparin sodium active pharmaceutical ingredient Volume Share (%), by Types 2024 & 2032
- Figure 47: Middle East & Africa heparin sodium active pharmaceutical ingredient Revenue (million), by Country 2024 & 2032
- Figure 48: Middle East & Africa heparin sodium active pharmaceutical ingredient Volume (K), by Country 2024 & 2032
- Figure 49: Middle East & Africa heparin sodium active pharmaceutical ingredient Revenue Share (%), by Country 2024 & 2032
- Figure 50: Middle East & Africa heparin sodium active pharmaceutical ingredient Volume Share (%), by Country 2024 & 2032
- Figure 51: Asia Pacific heparin sodium active pharmaceutical ingredient Revenue (million), by Application 2024 & 2032
- Figure 52: Asia Pacific heparin sodium active pharmaceutical ingredient Volume (K), by Application 2024 & 2032
- Figure 53: Asia Pacific heparin sodium active pharmaceutical ingredient Revenue Share (%), by Application 2024 & 2032
- Figure 54: Asia Pacific heparin sodium active pharmaceutical ingredient Volume Share (%), by Application 2024 & 2032
- Figure 55: Asia Pacific heparin sodium active pharmaceutical ingredient Revenue (million), by Types 2024 & 2032
- Figure 56: Asia Pacific heparin sodium active pharmaceutical ingredient Volume (K), by Types 2024 & 2032
- Figure 57: Asia Pacific heparin sodium active pharmaceutical ingredient Revenue Share (%), by Types 2024 & 2032
- Figure 58: Asia Pacific heparin sodium active pharmaceutical ingredient Volume Share (%), by Types 2024 & 2032
- Figure 59: Asia Pacific heparin sodium active pharmaceutical ingredient Revenue (million), by Country 2024 & 2032
- Figure 60: Asia Pacific heparin sodium active pharmaceutical ingredient Volume (K), by Country 2024 & 2032
- Figure 61: Asia Pacific heparin sodium active pharmaceutical ingredient Revenue Share (%), by Country 2024 & 2032
- Figure 62: Asia Pacific heparin sodium active pharmaceutical ingredient Volume Share (%), by Country 2024 & 2032
List of Tables
- Table 1: Global heparin sodium active pharmaceutical ingredient Revenue million Forecast, by Region 2019 & 2032
- Table 2: Global heparin sodium active pharmaceutical ingredient Volume K Forecast, by Region 2019 & 2032
- Table 3: Global heparin sodium active pharmaceutical ingredient Revenue million Forecast, by Application 2019 & 2032
- Table 4: Global heparin sodium active pharmaceutical ingredient Volume K Forecast, by Application 2019 & 2032
- Table 5: Global heparin sodium active pharmaceutical ingredient Revenue million Forecast, by Types 2019 & 2032
- Table 6: Global heparin sodium active pharmaceutical ingredient Volume K Forecast, by Types 2019 & 2032
- Table 7: Global heparin sodium active pharmaceutical ingredient Revenue million Forecast, by Region 2019 & 2032
- Table 8: Global heparin sodium active pharmaceutical ingredient Volume K Forecast, by Region 2019 & 2032
- Table 9: Global heparin sodium active pharmaceutical ingredient Revenue million Forecast, by Application 2019 & 2032
- Table 10: Global heparin sodium active pharmaceutical ingredient Volume K Forecast, by Application 2019 & 2032
- Table 11: Global heparin sodium active pharmaceutical ingredient Revenue million Forecast, by Types 2019 & 2032
- Table 12: Global heparin sodium active pharmaceutical ingredient Volume K Forecast, by Types 2019 & 2032
- Table 13: Global heparin sodium active pharmaceutical ingredient Revenue million Forecast, by Country 2019 & 2032
- Table 14: Global heparin sodium active pharmaceutical ingredient Volume K Forecast, by Country 2019 & 2032
- Table 15: United States heparin sodium active pharmaceutical ingredient Revenue (million) Forecast, by Application 2019 & 2032
- Table 16: United States heparin sodium active pharmaceutical ingredient Volume (K) Forecast, by Application 2019 & 2032
- Table 17: Canada heparin sodium active pharmaceutical ingredient Revenue (million) Forecast, by Application 2019 & 2032
- Table 18: Canada heparin sodium active pharmaceutical ingredient Volume (K) Forecast, by Application 2019 & 2032
- Table 19: Mexico heparin sodium active pharmaceutical ingredient Revenue (million) Forecast, by Application 2019 & 2032
- Table 20: Mexico heparin sodium active pharmaceutical ingredient Volume (K) Forecast, by Application 2019 & 2032
- Table 21: Global heparin sodium active pharmaceutical ingredient Revenue million Forecast, by Application 2019 & 2032
- Table 22: Global heparin sodium active pharmaceutical ingredient Volume K Forecast, by Application 2019 & 2032
- Table 23: Global heparin sodium active pharmaceutical ingredient Revenue million Forecast, by Types 2019 & 2032
- Table 24: Global heparin sodium active pharmaceutical ingredient Volume K Forecast, by Types 2019 & 2032
- Table 25: Global heparin sodium active pharmaceutical ingredient Revenue million Forecast, by Country 2019 & 2032
- Table 26: Global heparin sodium active pharmaceutical ingredient Volume K Forecast, by Country 2019 & 2032
- Table 27: Brazil heparin sodium active pharmaceutical ingredient Revenue (million) Forecast, by Application 2019 & 2032
- Table 28: Brazil heparin sodium active pharmaceutical ingredient Volume (K) Forecast, by Application 2019 & 2032
- Table 29: Argentina heparin sodium active pharmaceutical ingredient Revenue (million) Forecast, by Application 2019 & 2032
- Table 30: Argentina heparin sodium active pharmaceutical ingredient Volume (K) Forecast, by Application 2019 & 2032
- Table 31: Rest of South America heparin sodium active pharmaceutical ingredient Revenue (million) Forecast, by Application 2019 & 2032
- Table 32: Rest of South America heparin sodium active pharmaceutical ingredient Volume (K) Forecast, by Application 2019 & 2032
- Table 33: Global heparin sodium active pharmaceutical ingredient Revenue million Forecast, by Application 2019 & 2032
- Table 34: Global heparin sodium active pharmaceutical ingredient Volume K Forecast, by Application 2019 & 2032
- Table 35: Global heparin sodium active pharmaceutical ingredient Revenue million Forecast, by Types 2019 & 2032
- Table 36: Global heparin sodium active pharmaceutical ingredient Volume K Forecast, by Types 2019 & 2032
- Table 37: Global heparin sodium active pharmaceutical ingredient Revenue million Forecast, by Country 2019 & 2032
- Table 38: Global heparin sodium active pharmaceutical ingredient Volume K Forecast, by Country 2019 & 2032
- Table 39: United Kingdom heparin sodium active pharmaceutical ingredient Revenue (million) Forecast, by Application 2019 & 2032
- Table 40: United Kingdom heparin sodium active pharmaceutical ingredient Volume (K) Forecast, by Application 2019 & 2032
- Table 41: Germany heparin sodium active pharmaceutical ingredient Revenue (million) Forecast, by Application 2019 & 2032
- Table 42: Germany heparin sodium active pharmaceutical ingredient Volume (K) Forecast, by Application 2019 & 2032
- Table 43: France heparin sodium active pharmaceutical ingredient Revenue (million) Forecast, by Application 2019 & 2032
- Table 44: France heparin sodium active pharmaceutical ingredient Volume (K) Forecast, by Application 2019 & 2032
- Table 45: Italy heparin sodium active pharmaceutical ingredient Revenue (million) Forecast, by Application 2019 & 2032
- Table 46: Italy heparin sodium active pharmaceutical ingredient Volume (K) Forecast, by Application 2019 & 2032
- Table 47: Spain heparin sodium active pharmaceutical ingredient Revenue (million) Forecast, by Application 2019 & 2032
- Table 48: Spain heparin sodium active pharmaceutical ingredient Volume (K) Forecast, by Application 2019 & 2032
- Table 49: Russia heparin sodium active pharmaceutical ingredient Revenue (million) Forecast, by Application 2019 & 2032
- Table 50: Russia heparin sodium active pharmaceutical ingredient Volume (K) Forecast, by Application 2019 & 2032
- Table 51: Benelux heparin sodium active pharmaceutical ingredient Revenue (million) Forecast, by Application 2019 & 2032
- Table 52: Benelux heparin sodium active pharmaceutical ingredient Volume (K) Forecast, by Application 2019 & 2032
- Table 53: Nordics heparin sodium active pharmaceutical ingredient Revenue (million) Forecast, by Application 2019 & 2032
- Table 54: Nordics heparin sodium active pharmaceutical ingredient Volume (K) Forecast, by Application 2019 & 2032
- Table 55: Rest of Europe heparin sodium active pharmaceutical ingredient Revenue (million) Forecast, by Application 2019 & 2032
- Table 56: Rest of Europe heparin sodium active pharmaceutical ingredient Volume (K) Forecast, by Application 2019 & 2032
- Table 57: Global heparin sodium active pharmaceutical ingredient Revenue million Forecast, by Application 2019 & 2032
- Table 58: Global heparin sodium active pharmaceutical ingredient Volume K Forecast, by Application 2019 & 2032
- Table 59: Global heparin sodium active pharmaceutical ingredient Revenue million Forecast, by Types 2019 & 2032
- Table 60: Global heparin sodium active pharmaceutical ingredient Volume K Forecast, by Types 2019 & 2032
- Table 61: Global heparin sodium active pharmaceutical ingredient Revenue million Forecast, by Country 2019 & 2032
- Table 62: Global heparin sodium active pharmaceutical ingredient Volume K Forecast, by Country 2019 & 2032
- Table 63: Turkey heparin sodium active pharmaceutical ingredient Revenue (million) Forecast, by Application 2019 & 2032
- Table 64: Turkey heparin sodium active pharmaceutical ingredient Volume (K) Forecast, by Application 2019 & 2032
- Table 65: Israel heparin sodium active pharmaceutical ingredient Revenue (million) Forecast, by Application 2019 & 2032
- Table 66: Israel heparin sodium active pharmaceutical ingredient Volume (K) Forecast, by Application 2019 & 2032
- Table 67: GCC heparin sodium active pharmaceutical ingredient Revenue (million) Forecast, by Application 2019 & 2032
- Table 68: GCC heparin sodium active pharmaceutical ingredient Volume (K) Forecast, by Application 2019 & 2032
- Table 69: North Africa heparin sodium active pharmaceutical ingredient Revenue (million) Forecast, by Application 2019 & 2032
- Table 70: North Africa heparin sodium active pharmaceutical ingredient Volume (K) Forecast, by Application 2019 & 2032
- Table 71: South Africa heparin sodium active pharmaceutical ingredient Revenue (million) Forecast, by Application 2019 & 2032
- Table 72: South Africa heparin sodium active pharmaceutical ingredient Volume (K) Forecast, by Application 2019 & 2032
- Table 73: Rest of Middle East & Africa heparin sodium active pharmaceutical ingredient Revenue (million) Forecast, by Application 2019 & 2032
- Table 74: Rest of Middle East & Africa heparin sodium active pharmaceutical ingredient Volume (K) Forecast, by Application 2019 & 2032
- Table 75: Global heparin sodium active pharmaceutical ingredient Revenue million Forecast, by Application 2019 & 2032
- Table 76: Global heparin sodium active pharmaceutical ingredient Volume K Forecast, by Application 2019 & 2032
- Table 77: Global heparin sodium active pharmaceutical ingredient Revenue million Forecast, by Types 2019 & 2032
- Table 78: Global heparin sodium active pharmaceutical ingredient Volume K Forecast, by Types 2019 & 2032
- Table 79: Global heparin sodium active pharmaceutical ingredient Revenue million Forecast, by Country 2019 & 2032
- Table 80: Global heparin sodium active pharmaceutical ingredient Volume K Forecast, by Country 2019 & 2032
- Table 81: China heparin sodium active pharmaceutical ingredient Revenue (million) Forecast, by Application 2019 & 2032
- Table 82: China heparin sodium active pharmaceutical ingredient Volume (K) Forecast, by Application 2019 & 2032
- Table 83: India heparin sodium active pharmaceutical ingredient Revenue (million) Forecast, by Application 2019 & 2032
- Table 84: India heparin sodium active pharmaceutical ingredient Volume (K) Forecast, by Application 2019 & 2032
- Table 85: Japan heparin sodium active pharmaceutical ingredient Revenue (million) Forecast, by Application 2019 & 2032
- Table 86: Japan heparin sodium active pharmaceutical ingredient Volume (K) Forecast, by Application 2019 & 2032
- Table 87: South Korea heparin sodium active pharmaceutical ingredient Revenue (million) Forecast, by Application 2019 & 2032
- Table 88: South Korea heparin sodium active pharmaceutical ingredient Volume (K) Forecast, by Application 2019 & 2032
- Table 89: ASEAN heparin sodium active pharmaceutical ingredient Revenue (million) Forecast, by Application 2019 & 2032
- Table 90: ASEAN heparin sodium active pharmaceutical ingredient Volume (K) Forecast, by Application 2019 & 2032
- Table 91: Oceania heparin sodium active pharmaceutical ingredient Revenue (million) Forecast, by Application 2019 & 2032
- Table 92: Oceania heparin sodium active pharmaceutical ingredient Volume (K) Forecast, by Application 2019 & 2032
- Table 93: Rest of Asia Pacific heparin sodium active pharmaceutical ingredient Revenue (million) Forecast, by Application 2019 & 2032
- Table 94: Rest of Asia Pacific heparin sodium active pharmaceutical ingredient Volume (K) Forecast, by Application 2019 & 2032
Frequently Asked Questions
1. What is the projected Compound Annual Growth Rate (CAGR) of the heparin sodium active pharmaceutical ingredient?
The projected CAGR is approximately XX%.
2. Which companies are prominent players in the heparin sodium active pharmaceutical ingredient?
Key companies in the market include Hepalink, King-friend Biochemical Pharmaceutical, Bioibérica, Dongcheng Biochemicals, Changshan Pharm, Pfizer, Jiulong Biochemicals, Qianhong Bio-pharma, Tiandong, Opocrin, Yino Pharma Limited, Xinbai, Deebio.
3. What are the main segments of the heparin sodium active pharmaceutical ingredient?
The market segments include Application, Types.
4. Can you provide details about the market size?
The market size is estimated to be USD XXX million as of 2022.
5. What are some drivers contributing to market growth?
N/A
6. What are the notable trends driving market growth?
N/A
7. Are there any restraints impacting market growth?
N/A
8. Can you provide examples of recent developments in the market?
N/A
9. What pricing options are available for accessing the report?
Pricing options include single-user, multi-user, and enterprise licenses priced at USD 4350.00, USD 6525.00, and USD 8700.00 respectively.
10. Is the market size provided in terms of value or volume?
The market size is provided in terms of value, measured in million and volume, measured in K.
11. Are there any specific market keywords associated with the report?
Yes, the market keyword associated with the report is "heparin sodium active pharmaceutical ingredient," which aids in identifying and referencing the specific market segment covered.
12. How do I determine which pricing option suits my needs best?
The pricing options vary based on user requirements and access needs. Individual users may opt for single-user licenses, while businesses requiring broader access may choose multi-user or enterprise licenses for cost-effective access to the report.
13. Are there any additional resources or data provided in the heparin sodium active pharmaceutical ingredient report?
While the report offers comprehensive insights, it's advisable to review the specific contents or supplementary materials provided to ascertain if additional resources or data are available.
14. How can I stay updated on further developments or reports in the heparin sodium active pharmaceutical ingredient?
To stay informed about further developments, trends, and reports in the heparin sodium active pharmaceutical ingredient, consider subscribing to industry newsletters, following relevant companies and organizations, or regularly checking reputable industry news sources and publications.
Methodology
Step 1 - Identification of Relevant Samples Size from Population Database


Step 2 - Approaches for Defining Global Market Size (Value, Volume* & Price*)

Note*: In applicable scenarios
Step 3 - Data Sources
Primary Research
- Web Analytics
- Survey Reports
- Research Institute
- Latest Research Reports
- Opinion Leaders
Secondary Research
- Annual Reports
- White Paper
- Latest Press Release
- Industry Association
- Paid Database
- Investor Presentations

Step 4 - Data Triangulation
Involves using different sources of information in order to increase the validity of a study
These sources are likely to be stakeholders in a program - participants, other researchers, program staff, other community members, and so on.
Then we put all data in single framework & apply various statistical tools to find out the dynamic on the market.
During the analysis stage, feedback from the stakeholder groups would be compared to determine areas of agreement as well as areas of divergence


