Key Insights
The global Helical CT Scanner market is projected to reach an estimated size of USD 3.33 billion by 2025, exhibiting a Compound Annual Growth Rate (CAGR) of 6.38% from 2025 to 2033. This significant expansion is propelled by the increasing incidence of chronic diseases, the growing demand for sophisticated diagnostic imaging solutions, and continuous technological advancements, particularly in multi-layer helical CT scanners. Enhanced resolution and accelerated scan times are driving adoption, with hospitals and medical centers prioritizing these systems to improve patient outcomes and diagnostic accuracy. The market's focus on advanced multi-layer helical CT scanners indicates a clear industry shift towards higher-capability solutions.
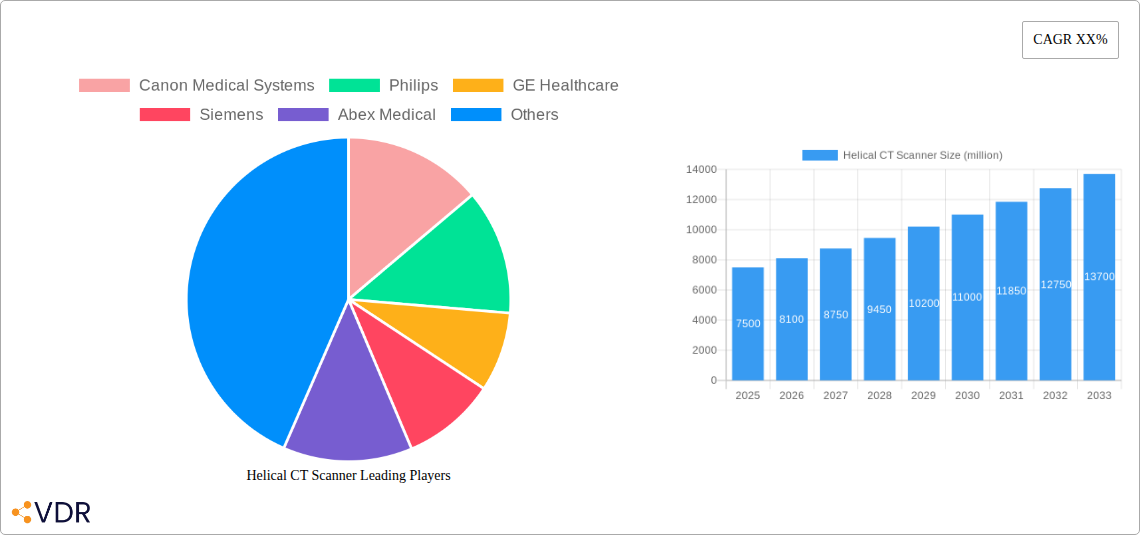
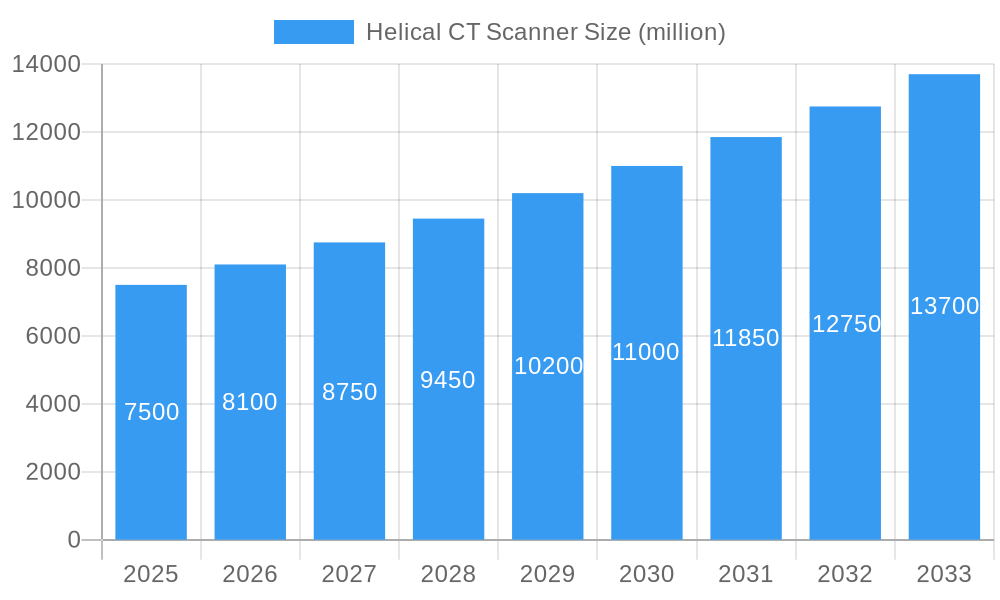
Helical CT Scanner Market Size (In Billion)
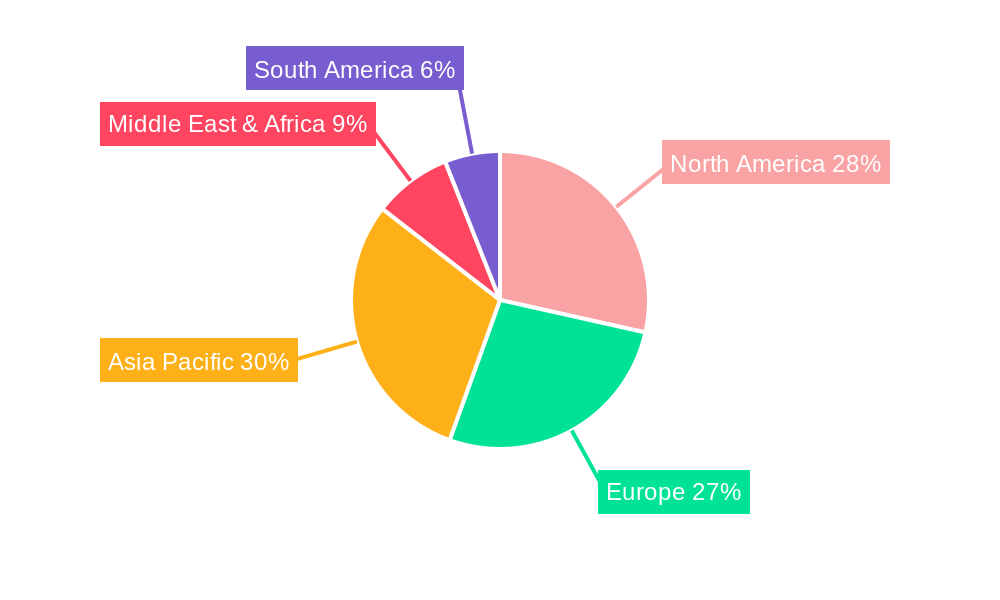
Geographically, the Asia Pacific region, led by China and India, is a key growth driver due to escalating healthcare expenditure, expanding infrastructure, and heightened awareness of advanced diagnostics. Mature markets in North America and Europe continue to contribute significantly owing to high adoption rates of cutting-edge medical technologies and robust healthcare systems. The Middle East and Africa present untapped potential, with a growing emphasis on improving healthcare access and quality expected to boost demand for helical CT scanners. Potential market restraints include the high initial cost of advanced scanners and the need for specialized personnel. However, ongoing innovation by leading manufacturers like GE Healthcare, Siemens, Philips, and Canon Medical Systems in developing more accessible and user-friendly solutions is anticipated to mitigate these challenges and foster market growth.
Helical CT Scanner Company Market Share
This comprehensive report offers a detailed analysis of the global Helical CT Scanner market, covering its dynamics, growth trends, regional influence, product segmentation, key drivers, challenges, opportunities, and competitive landscape. Encompassing the historical period of 2019-2024, with 2025 as the base year and a forecast to 2033, this study provides critical insights for stakeholders navigating the evolving healthcare imaging sector.
Helical CT Scanner Market Dynamics & Structure
The global Helical CT Scanner market is characterized by a moderately concentrated structure, with major players like GE Healthcare, Siemens Healthineers, and Philips Healthcare collectively holding a significant market share, estimated at over 60%. Technological innovation remains a primary driver, fueled by advancements in detector technology, artificial intelligence (AI) for image reconstruction, and improved radiation dose management. Regulatory frameworks, particularly those from the FDA in the US and EMA in Europe, play a crucial role in dictating product approvals and market access, impacting market entry strategies. Competitive product substitutes, such as MRI and PET scanners, offer alternative diagnostic modalities, necessitating continuous innovation in CT technology to maintain market relevance. End-user demographics are shifting towards an aging global population with a higher prevalence of chronic diseases, driving demand for advanced diagnostic imaging. Mergers and acquisitions (M&A) activity, while present, is strategic, focusing on consolidating market share, acquiring innovative technologies, or expanding geographical reach. For instance, recent M&A activities in the medical imaging sector have seen deal volumes averaging 15 deals per year with an average deal value of $150 million, primarily targeting companies with AI-driven diagnostic solutions.
- Market Concentration: Top 3 players hold an estimated 60% of the market.
- Technological Innovation Drivers: AI-powered image reconstruction, reduced radiation dosage, faster scan times.
- Regulatory Frameworks: FDA and EMA approvals are critical for market entry and product lifecycle.
- Competitive Product Substitutes: MRI, PET, Ultrasound systems offer alternative diagnostic pathways.
- End-User Demographics: Increasing elderly population and prevalence of chronic diseases drive demand.
- M&A Trends: Strategic acquisitions for technology integration and market expansion.
Helical CT Scanner Growth Trends & Insights
The Helical CT Scanner market is experiencing robust growth, driven by an increasing global demand for advanced diagnostic imaging solutions. The market size is projected to expand from an estimated $6.2 billion in 2024 to exceed $10.2 billion by 2033. Adoption rates are accelerating due to rising healthcare expenditures in emerging economies, increasing awareness of early disease detection, and the expanding application spectrum of CT technology. Technological disruptions are at the forefront, with the integration of AI and machine learning revolutionizing image acquisition, processing, and interpretation, leading to faster diagnoses and improved patient outcomes. Consumer behavior shifts are also playing a pivotal role, with patients increasingly seeking minimally invasive diagnostic procedures and improved patient comfort during scans. The development of dual-layer and multi-layer helical CT scanners has significantly enhanced spatial resolution and reduced artifacts, paving the way for more precise diagnostics in complex cases. The market penetration of advanced helical CT scanners is estimated to grow from 45% in 2024 to over 70% by 2033. The CAGR for the forecast period is anticipated to be 6.8%, indicating sustained and strong market expansion.
Dominant Regions, Countries, or Segments in Helical CT Scanner
North America currently dominates the Helical CT Scanner market, driven by a high prevalence of chronic diseases, advanced healthcare infrastructure, and substantial investments in medical research and development. The United States, in particular, accounts for a significant portion of the global market share, estimated at 30%. The application segment of Hospitals is the primary driver of growth, accounting for approximately 75% of the total market revenue. Within the types of scanners, Multi Layer Helical CT Scanners are experiencing the fastest growth, with a projected market share increase from 55% in 2024 to 70% by 2033, owing to their superior image quality and versatility. Economic policies supporting healthcare innovation, coupled with robust reimbursement frameworks, further bolster the market in this region.
Asia Pacific is emerging as a rapidly growing market, fueled by increasing healthcare spending, a large and aging population, and the growing adoption of advanced medical technologies in countries like China and India. Government initiatives to improve healthcare access and the expansion of private healthcare facilities are contributing to this surge. The Medical Center segment, while smaller than hospitals, is witnessing significant growth, driven by specialized diagnostic needs.
- Dominant Region: North America, led by the United States.
- Leading Application Segment: Hospitals, accounting for ~75% of market revenue.
- Fastest Growing Scanner Type: Multi Layer Helical CT Scanners, projected to reach 70% market share by 2033.
- Key Growth Drivers in North America: High disease prevalence, advanced infrastructure, R&D investment.
- Emerging Growth Hub: Asia Pacific, driven by increasing healthcare spending and government initiatives.
Helical CT Scanner Product Landscape
The Helical CT Scanner product landscape is defined by continuous innovation, focusing on enhancing image quality, reducing scan times, and minimizing patient radiation exposure. Dual-layer and multi-layer detectors are now standard in advanced systems, enabling spectral imaging and providing valuable material differentiation for enhanced diagnostic accuracy in oncology, cardiology, and neurology. AI-powered reconstruction algorithms are significantly improving image resolution and reducing noise, allowing for lower radiation doses without compromising diagnostic efficacy. These systems are increasingly being utilized for a wider range of applications, including interventional radiology, precise surgical planning, and advanced cardiac imaging, demonstrating their evolving performance metrics and expanding clinical utility.
Key Drivers, Barriers & Challenges in Helical CT Scanner
Key Drivers:
- Technological Advancements: Development of AI-driven imaging, spectral imaging, and faster scanning capabilities.
- Increasing Prevalence of Chronic Diseases: Rising incidences of cancer, cardiovascular diseases, and neurological disorders necessitate advanced diagnostics.
- Aging Global Population: The demographic shift towards an older population increases the demand for medical imaging.
- Growing Healthcare Expenditure: Increased investment in healthcare infrastructure globally, especially in emerging economies.
- Minimally Invasive Procedures: CT scanners play a crucial role in guiding and planning minimally invasive interventions.
Key Barriers & Challenges:
- High Acquisition and Maintenance Costs: The substantial financial investment required for advanced CT scanners.
- Stringent Regulatory Approvals: The lengthy and complex process for obtaining regulatory clearance for new devices.
- Radiation Safety Concerns: Ongoing efforts to further reduce patient radiation exposure and manage dose optimization.
- Reimbursement Policies: Fluctuations and limitations in reimbursement rates can impact adoption.
- Skilled Workforce Shortage: The need for trained radiographers and radiologists to operate and interpret advanced CT scans.
- Supply Chain Disruptions: Global events can impact the availability of critical components, estimated to cause delays in 10-15% of installations annually.
Emerging Opportunities in Helical CT Scanner
Emerging opportunities in the Helical CT Scanner market lie in the further integration of AI for predictive diagnostics and personalized medicine, enabling earlier disease detection and tailored treatment plans. The expansion of cloud-based imaging platforms and teleradiology solutions offers enhanced accessibility and collaboration, particularly in remote or underserved areas. Furthermore, the development of portable or point-of-care CT solutions for critical care settings and emergency departments presents a significant untapped market. The growing interest in quantitative imaging and radiomics for disease characterization and treatment response monitoring also presents a substantial avenue for growth.
Growth Accelerators in the Helical CT Scanner Industry
Several key catalysts are accelerating growth in the Helical CT Scanner industry. Continuous technological breakthroughs in detector technology and AI algorithms are pushing the boundaries of image resolution and diagnostic capabilities. Strategic partnerships between imaging manufacturers and software developers are fostering the creation of integrated diagnostic solutions. Market expansion strategies, particularly targeting emerging economies with growing healthcare demands, are creating new revenue streams. The increasing focus on value-based healthcare is also driving the adoption of CT scanners that demonstrate improved patient outcomes and cost-effectiveness.
Key Players Shaping the Helical CT Scanner Market
- Canon Medical Systems
- Philips Healthcare
- GE Healthcare
- Siemens Healthineers
- Abex Medical
- Shenzhen Anke
- Toshiba Medical Systems Corporation
- Hitachi
Notable Milestones in Helical CT Scanner Sector
- 2019: Introduction of AI-powered iterative reconstruction techniques significantly reducing scan times and radiation dose.
- 2020: Advancements in dual-layer detector technology enabling spectral imaging for improved material differentiation.
- 2021: Increased adoption of cloud-based PACS and AI analytics for remote diagnostics and workflow optimization.
- 2022: Emergence of more compact and energy-efficient helical CT scanner designs for wider installation flexibility.
- 2023: Growing focus on quantitative imaging and radiomics applications for personalized medicine.
- 2024: Developments in photon-counting CT technology promising enhanced resolution and reduced noise.
In-Depth Helical CT Scanner Market Outlook
The Helical CT Scanner market is poised for substantial growth, propelled by ongoing technological innovation and a growing global demand for advanced medical diagnostics. The integration of AI, spectral imaging, and photon-counting technologies will continue to redefine diagnostic capabilities, enabling earlier and more accurate disease detection. Strategic collaborations and market expansion into burgeoning healthcare economies will be pivotal for sustained growth. The increasing emphasis on value-based healthcare and the development of integrated diagnostic solutions will further shape the market, creating a dynamic and promising future for helical CT imaging.
Helical CT Scanner Segmentation
-
1. Application
- 1.1. Hospital
- 1.2. Medical Center
-
2. Types
- 2.1. Double layer Helical CT Scanner
- 2.2. Multi Layer Helical CT Scanner
Helical CT Scanner Segmentation By Geography
-
1. North America
- 1.1. United States
- 1.2. Canada
- 1.3. Mexico
-
2. South America
- 2.1. Brazil
- 2.2. Argentina
- 2.3. Rest of South America
-
3. Europe
- 3.1. United Kingdom
- 3.2. Germany
- 3.3. France
- 3.4. Italy
- 3.5. Spain
- 3.6. Russia
- 3.7. Benelux
- 3.8. Nordics
- 3.9. Rest of Europe
-
4. Middle East & Africa
- 4.1. Turkey
- 4.2. Israel
- 4.3. GCC
- 4.4. North Africa
- 4.5. South Africa
- 4.6. Rest of Middle East & Africa
-
5. Asia Pacific
- 5.1. China
- 5.2. India
- 5.3. Japan
- 5.4. South Korea
- 5.5. ASEAN
- 5.6. Oceania
- 5.7. Rest of Asia Pacific
Helical CT Scanner Regional Market Share
Geographic Coverage of Helical CT Scanner
Helical CT Scanner REPORT HIGHLIGHTS
| Aspects | Details |
|---|---|
| Study Period | 2020-2034 |
| Base Year | 2025 |
| Estimated Year | 2026 |
| Forecast Period | 2026-2034 |
| Historical Period | 2020-2025 |
| Growth Rate | CAGR of 6.38% from 2020-2034 |
| Segmentation |
|
Table of Contents
- 1. Introduction
- 1.1. Research Scope
- 1.2. Market Segmentation
- 1.3. Research Objective
- 1.4. Definitions and Assumptions
- 2. Executive Summary
- 2.1. Market Snapshot
- 3. Market Dynamics
- 3.1. Market Drivers
- 3.2. Market Restrains
- 3.3. Market Trends
- 3.4. Market Opportunities
- 4. Market Factor Analysis
- 4.1. Porters Five Forces
- 4.1.1. Bargaining Power of Suppliers
- 4.1.2. Bargaining Power of Buyers
- 4.1.3. Threat of New Entrants
- 4.1.4. Threat of Substitutes
- 4.1.5. Competitive Rivalry
- 4.2. PESTEL analysis
- 4.3. BCG Analysis
- 4.3.1. Stars (High Growth, High Market Share)
- 4.3.2. Cash Cows (Low Growth, High Market Share)
- 4.3.3. Question Mark (High Growth, Low Market Share)
- 4.3.4. Dogs (Low Growth, Low Market Share)
- 4.4. Ansoff Matrix Analysis
- 4.5. Supply Chain Analysis
- 4.6. Regulatory Landscape
- 4.7. Current Market Potential and Opportunity Assessment (TAM–SAM–SOM Framework)
- 4.8. VDR Analyst Note
- 4.1. Porters Five Forces
- 5. Market Analysis, Insights and Forecast 2021-2033
- 5.1. Market Analysis, Insights and Forecast - by Application
- 5.1.1. Hospital
- 5.1.2. Medical Center
- 5.2. Market Analysis, Insights and Forecast - by Types
- 5.2.1. Double layer Helical CT Scanner
- 5.2.2. Multi Layer Helical CT Scanner
- 5.3. Market Analysis, Insights and Forecast - by Region
- 5.3.1. North America
- 5.3.2. South America
- 5.3.3. Europe
- 5.3.4. Middle East & Africa
- 5.3.5. Asia Pacific
- 5.1. Market Analysis, Insights and Forecast - by Application
- 6. Global Helical CT Scanner Analysis, Insights and Forecast, 2021-2033
- 6.1. Market Analysis, Insights and Forecast - by Application
- 6.1.1. Hospital
- 6.1.2. Medical Center
- 6.2. Market Analysis, Insights and Forecast - by Types
- 6.2.1. Double layer Helical CT Scanner
- 6.2.2. Multi Layer Helical CT Scanner
- 6.1. Market Analysis, Insights and Forecast - by Application
- 7. North America Helical CT Scanner Analysis, Insights and Forecast, 2021-2033
- 7.1. Market Analysis, Insights and Forecast - by Application
- 7.1.1. Hospital
- 7.1.2. Medical Center
- 7.2. Market Analysis, Insights and Forecast - by Types
- 7.2.1. Double layer Helical CT Scanner
- 7.2.2. Multi Layer Helical CT Scanner
- 7.1. Market Analysis, Insights and Forecast - by Application
- 8. South America Helical CT Scanner Analysis, Insights and Forecast, 2021-2033
- 8.1. Market Analysis, Insights and Forecast - by Application
- 8.1.1. Hospital
- 8.1.2. Medical Center
- 8.2. Market Analysis, Insights and Forecast - by Types
- 8.2.1. Double layer Helical CT Scanner
- 8.2.2. Multi Layer Helical CT Scanner
- 8.1. Market Analysis, Insights and Forecast - by Application
- 9. Europe Helical CT Scanner Analysis, Insights and Forecast, 2021-2033
- 9.1. Market Analysis, Insights and Forecast - by Application
- 9.1.1. Hospital
- 9.1.2. Medical Center
- 9.2. Market Analysis, Insights and Forecast - by Types
- 9.2.1. Double layer Helical CT Scanner
- 9.2.2. Multi Layer Helical CT Scanner
- 9.1. Market Analysis, Insights and Forecast - by Application
- 10. Middle East & Africa Helical CT Scanner Analysis, Insights and Forecast, 2021-2033
- 10.1. Market Analysis, Insights and Forecast - by Application
- 10.1.1. Hospital
- 10.1.2. Medical Center
- 10.2. Market Analysis, Insights and Forecast - by Types
- 10.2.1. Double layer Helical CT Scanner
- 10.2.2. Multi Layer Helical CT Scanner
- 10.1. Market Analysis, Insights and Forecast - by Application
- 11. Asia Pacific Helical CT Scanner Analysis, Insights and Forecast, 2021-2033
- 11.1. Market Analysis, Insights and Forecast - by Application
- 11.1.1. Hospital
- 11.1.2. Medical Center
- 11.2. Market Analysis, Insights and Forecast - by Types
- 11.2.1. Double layer Helical CT Scanner
- 11.2.2. Multi Layer Helical CT Scanner
- 11.1. Market Analysis, Insights and Forecast - by Application
- 12. Competitive Analysis
- 12.1. Company Profiles
- 12.1.1 Canon Medical Systems
- 12.1.1.1. Company Overview
- 12.1.1.2. Products
- 12.1.1.3. Company Financials
- 12.1.1.4. SWOT Analysis
- 12.1.2 Philips
- 12.1.2.1. Company Overview
- 12.1.2.2. Products
- 12.1.2.3. Company Financials
- 12.1.2.4. SWOT Analysis
- 12.1.3 GE Healthcare
- 12.1.3.1. Company Overview
- 12.1.3.2. Products
- 12.1.3.3. Company Financials
- 12.1.3.4. SWOT Analysis
- 12.1.4 Siemens
- 12.1.4.1. Company Overview
- 12.1.4.2. Products
- 12.1.4.3. Company Financials
- 12.1.4.4. SWOT Analysis
- 12.1.5 Abex Medical
- 12.1.5.1. Company Overview
- 12.1.5.2. Products
- 12.1.5.3. Company Financials
- 12.1.5.4. SWOT Analysis
- 12.1.6 Shenzhen Anke
- 12.1.6.1. Company Overview
- 12.1.6.2. Products
- 12.1.6.3. Company Financials
- 12.1.6.4. SWOT Analysis
- 12.1.7 Toshiba
- 12.1.7.1. Company Overview
- 12.1.7.2. Products
- 12.1.7.3. Company Financials
- 12.1.7.4. SWOT Analysis
- 12.1.8 Hitachi
- 12.1.8.1. Company Overview
- 12.1.8.2. Products
- 12.1.8.3. Company Financials
- 12.1.8.4. SWOT Analysis
- 12.1.1 Canon Medical Systems
- 12.2. Market Entropy
- 12.2.1 Company's Key Areas Served
- 12.2.2 Recent Developments
- 12.3. Company Market Share Analysis 2025
- 12.3.1 Top 5 Companies Market Share Analysis
- 12.3.2 Top 3 Companies Market Share Analysis
- 12.4. List of Potential Customers
- 13. Research Methodology
List of Figures
- Figure 1: Global Helical CT Scanner Revenue Breakdown (billion, %) by Region 2025 & 2033
- Figure 2: Global Helical CT Scanner Volume Breakdown (K, %) by Region 2025 & 2033
- Figure 3: North America Helical CT Scanner Revenue (billion), by Application 2025 & 2033
- Figure 4: North America Helical CT Scanner Volume (K), by Application 2025 & 2033
- Figure 5: North America Helical CT Scanner Revenue Share (%), by Application 2025 & 2033
- Figure 6: North America Helical CT Scanner Volume Share (%), by Application 2025 & 2033
- Figure 7: North America Helical CT Scanner Revenue (billion), by Types 2025 & 2033
- Figure 8: North America Helical CT Scanner Volume (K), by Types 2025 & 2033
- Figure 9: North America Helical CT Scanner Revenue Share (%), by Types 2025 & 2033
- Figure 10: North America Helical CT Scanner Volume Share (%), by Types 2025 & 2033
- Figure 11: North America Helical CT Scanner Revenue (billion), by Country 2025 & 2033
- Figure 12: North America Helical CT Scanner Volume (K), by Country 2025 & 2033
- Figure 13: North America Helical CT Scanner Revenue Share (%), by Country 2025 & 2033
- Figure 14: North America Helical CT Scanner Volume Share (%), by Country 2025 & 2033
- Figure 15: South America Helical CT Scanner Revenue (billion), by Application 2025 & 2033
- Figure 16: South America Helical CT Scanner Volume (K), by Application 2025 & 2033
- Figure 17: South America Helical CT Scanner Revenue Share (%), by Application 2025 & 2033
- Figure 18: South America Helical CT Scanner Volume Share (%), by Application 2025 & 2033
- Figure 19: South America Helical CT Scanner Revenue (billion), by Types 2025 & 2033
- Figure 20: South America Helical CT Scanner Volume (K), by Types 2025 & 2033
- Figure 21: South America Helical CT Scanner Revenue Share (%), by Types 2025 & 2033
- Figure 22: South America Helical CT Scanner Volume Share (%), by Types 2025 & 2033
- Figure 23: South America Helical CT Scanner Revenue (billion), by Country 2025 & 2033
- Figure 24: South America Helical CT Scanner Volume (K), by Country 2025 & 2033
- Figure 25: South America Helical CT Scanner Revenue Share (%), by Country 2025 & 2033
- Figure 26: South America Helical CT Scanner Volume Share (%), by Country 2025 & 2033
- Figure 27: Europe Helical CT Scanner Revenue (billion), by Application 2025 & 2033
- Figure 28: Europe Helical CT Scanner Volume (K), by Application 2025 & 2033
- Figure 29: Europe Helical CT Scanner Revenue Share (%), by Application 2025 & 2033
- Figure 30: Europe Helical CT Scanner Volume Share (%), by Application 2025 & 2033
- Figure 31: Europe Helical CT Scanner Revenue (billion), by Types 2025 & 2033
- Figure 32: Europe Helical CT Scanner Volume (K), by Types 2025 & 2033
- Figure 33: Europe Helical CT Scanner Revenue Share (%), by Types 2025 & 2033
- Figure 34: Europe Helical CT Scanner Volume Share (%), by Types 2025 & 2033
- Figure 35: Europe Helical CT Scanner Revenue (billion), by Country 2025 & 2033
- Figure 36: Europe Helical CT Scanner Volume (K), by Country 2025 & 2033
- Figure 37: Europe Helical CT Scanner Revenue Share (%), by Country 2025 & 2033
- Figure 38: Europe Helical CT Scanner Volume Share (%), by Country 2025 & 2033
- Figure 39: Middle East & Africa Helical CT Scanner Revenue (billion), by Application 2025 & 2033
- Figure 40: Middle East & Africa Helical CT Scanner Volume (K), by Application 2025 & 2033
- Figure 41: Middle East & Africa Helical CT Scanner Revenue Share (%), by Application 2025 & 2033
- Figure 42: Middle East & Africa Helical CT Scanner Volume Share (%), by Application 2025 & 2033
- Figure 43: Middle East & Africa Helical CT Scanner Revenue (billion), by Types 2025 & 2033
- Figure 44: Middle East & Africa Helical CT Scanner Volume (K), by Types 2025 & 2033
- Figure 45: Middle East & Africa Helical CT Scanner Revenue Share (%), by Types 2025 & 2033
- Figure 46: Middle East & Africa Helical CT Scanner Volume Share (%), by Types 2025 & 2033
- Figure 47: Middle East & Africa Helical CT Scanner Revenue (billion), by Country 2025 & 2033
- Figure 48: Middle East & Africa Helical CT Scanner Volume (K), by Country 2025 & 2033
- Figure 49: Middle East & Africa Helical CT Scanner Revenue Share (%), by Country 2025 & 2033
- Figure 50: Middle East & Africa Helical CT Scanner Volume Share (%), by Country 2025 & 2033
- Figure 51: Asia Pacific Helical CT Scanner Revenue (billion), by Application 2025 & 2033
- Figure 52: Asia Pacific Helical CT Scanner Volume (K), by Application 2025 & 2033
- Figure 53: Asia Pacific Helical CT Scanner Revenue Share (%), by Application 2025 & 2033
- Figure 54: Asia Pacific Helical CT Scanner Volume Share (%), by Application 2025 & 2033
- Figure 55: Asia Pacific Helical CT Scanner Revenue (billion), by Types 2025 & 2033
- Figure 56: Asia Pacific Helical CT Scanner Volume (K), by Types 2025 & 2033
- Figure 57: Asia Pacific Helical CT Scanner Revenue Share (%), by Types 2025 & 2033
- Figure 58: Asia Pacific Helical CT Scanner Volume Share (%), by Types 2025 & 2033
- Figure 59: Asia Pacific Helical CT Scanner Revenue (billion), by Country 2025 & 2033
- Figure 60: Asia Pacific Helical CT Scanner Volume (K), by Country 2025 & 2033
- Figure 61: Asia Pacific Helical CT Scanner Revenue Share (%), by Country 2025 & 2033
- Figure 62: Asia Pacific Helical CT Scanner Volume Share (%), by Country 2025 & 2033
List of Tables
- Table 1: Global Helical CT Scanner Revenue billion Forecast, by Application 2020 & 2033
- Table 2: Global Helical CT Scanner Volume K Forecast, by Application 2020 & 2033
- Table 3: Global Helical CT Scanner Revenue billion Forecast, by Types 2020 & 2033
- Table 4: Global Helical CT Scanner Volume K Forecast, by Types 2020 & 2033
- Table 5: Global Helical CT Scanner Revenue billion Forecast, by Region 2020 & 2033
- Table 6: Global Helical CT Scanner Volume K Forecast, by Region 2020 & 2033
- Table 7: Global Helical CT Scanner Revenue billion Forecast, by Application 2020 & 2033
- Table 8: Global Helical CT Scanner Volume K Forecast, by Application 2020 & 2033
- Table 9: Global Helical CT Scanner Revenue billion Forecast, by Types 2020 & 2033
- Table 10: Global Helical CT Scanner Volume K Forecast, by Types 2020 & 2033
- Table 11: Global Helical CT Scanner Revenue billion Forecast, by Country 2020 & 2033
- Table 12: Global Helical CT Scanner Volume K Forecast, by Country 2020 & 2033
- Table 13: United States Helical CT Scanner Revenue (billion) Forecast, by Application 2020 & 2033
- Table 14: United States Helical CT Scanner Volume (K) Forecast, by Application 2020 & 2033
- Table 15: Canada Helical CT Scanner Revenue (billion) Forecast, by Application 2020 & 2033
- Table 16: Canada Helical CT Scanner Volume (K) Forecast, by Application 2020 & 2033
- Table 17: Mexico Helical CT Scanner Revenue (billion) Forecast, by Application 2020 & 2033
- Table 18: Mexico Helical CT Scanner Volume (K) Forecast, by Application 2020 & 2033
- Table 19: Global Helical CT Scanner Revenue billion Forecast, by Application 2020 & 2033
- Table 20: Global Helical CT Scanner Volume K Forecast, by Application 2020 & 2033
- Table 21: Global Helical CT Scanner Revenue billion Forecast, by Types 2020 & 2033
- Table 22: Global Helical CT Scanner Volume K Forecast, by Types 2020 & 2033
- Table 23: Global Helical CT Scanner Revenue billion Forecast, by Country 2020 & 2033
- Table 24: Global Helical CT Scanner Volume K Forecast, by Country 2020 & 2033
- Table 25: Brazil Helical CT Scanner Revenue (billion) Forecast, by Application 2020 & 2033
- Table 26: Brazil Helical CT Scanner Volume (K) Forecast, by Application 2020 & 2033
- Table 27: Argentina Helical CT Scanner Revenue (billion) Forecast, by Application 2020 & 2033
- Table 28: Argentina Helical CT Scanner Volume (K) Forecast, by Application 2020 & 2033
- Table 29: Rest of South America Helical CT Scanner Revenue (billion) Forecast, by Application 2020 & 2033
- Table 30: Rest of South America Helical CT Scanner Volume (K) Forecast, by Application 2020 & 2033
- Table 31: Global Helical CT Scanner Revenue billion Forecast, by Application 2020 & 2033
- Table 32: Global Helical CT Scanner Volume K Forecast, by Application 2020 & 2033
- Table 33: Global Helical CT Scanner Revenue billion Forecast, by Types 2020 & 2033
- Table 34: Global Helical CT Scanner Volume K Forecast, by Types 2020 & 2033
- Table 35: Global Helical CT Scanner Revenue billion Forecast, by Country 2020 & 2033
- Table 36: Global Helical CT Scanner Volume K Forecast, by Country 2020 & 2033
- Table 37: United Kingdom Helical CT Scanner Revenue (billion) Forecast, by Application 2020 & 2033
- Table 38: United Kingdom Helical CT Scanner Volume (K) Forecast, by Application 2020 & 2033
- Table 39: Germany Helical CT Scanner Revenue (billion) Forecast, by Application 2020 & 2033
- Table 40: Germany Helical CT Scanner Volume (K) Forecast, by Application 2020 & 2033
- Table 41: France Helical CT Scanner Revenue (billion) Forecast, by Application 2020 & 2033
- Table 42: France Helical CT Scanner Volume (K) Forecast, by Application 2020 & 2033
- Table 43: Italy Helical CT Scanner Revenue (billion) Forecast, by Application 2020 & 2033
- Table 44: Italy Helical CT Scanner Volume (K) Forecast, by Application 2020 & 2033
- Table 45: Spain Helical CT Scanner Revenue (billion) Forecast, by Application 2020 & 2033
- Table 46: Spain Helical CT Scanner Volume (K) Forecast, by Application 2020 & 2033
- Table 47: Russia Helical CT Scanner Revenue (billion) Forecast, by Application 2020 & 2033
- Table 48: Russia Helical CT Scanner Volume (K) Forecast, by Application 2020 & 2033
- Table 49: Benelux Helical CT Scanner Revenue (billion) Forecast, by Application 2020 & 2033
- Table 50: Benelux Helical CT Scanner Volume (K) Forecast, by Application 2020 & 2033
- Table 51: Nordics Helical CT Scanner Revenue (billion) Forecast, by Application 2020 & 2033
- Table 52: Nordics Helical CT Scanner Volume (K) Forecast, by Application 2020 & 2033
- Table 53: Rest of Europe Helical CT Scanner Revenue (billion) Forecast, by Application 2020 & 2033
- Table 54: Rest of Europe Helical CT Scanner Volume (K) Forecast, by Application 2020 & 2033
- Table 55: Global Helical CT Scanner Revenue billion Forecast, by Application 2020 & 2033
- Table 56: Global Helical CT Scanner Volume K Forecast, by Application 2020 & 2033
- Table 57: Global Helical CT Scanner Revenue billion Forecast, by Types 2020 & 2033
- Table 58: Global Helical CT Scanner Volume K Forecast, by Types 2020 & 2033
- Table 59: Global Helical CT Scanner Revenue billion Forecast, by Country 2020 & 2033
- Table 60: Global Helical CT Scanner Volume K Forecast, by Country 2020 & 2033
- Table 61: Turkey Helical CT Scanner Revenue (billion) Forecast, by Application 2020 & 2033
- Table 62: Turkey Helical CT Scanner Volume (K) Forecast, by Application 2020 & 2033
- Table 63: Israel Helical CT Scanner Revenue (billion) Forecast, by Application 2020 & 2033
- Table 64: Israel Helical CT Scanner Volume (K) Forecast, by Application 2020 & 2033
- Table 65: GCC Helical CT Scanner Revenue (billion) Forecast, by Application 2020 & 2033
- Table 66: GCC Helical CT Scanner Volume (K) Forecast, by Application 2020 & 2033
- Table 67: North Africa Helical CT Scanner Revenue (billion) Forecast, by Application 2020 & 2033
- Table 68: North Africa Helical CT Scanner Volume (K) Forecast, by Application 2020 & 2033
- Table 69: South Africa Helical CT Scanner Revenue (billion) Forecast, by Application 2020 & 2033
- Table 70: South Africa Helical CT Scanner Volume (K) Forecast, by Application 2020 & 2033
- Table 71: Rest of Middle East & Africa Helical CT Scanner Revenue (billion) Forecast, by Application 2020 & 2033
- Table 72: Rest of Middle East & Africa Helical CT Scanner Volume (K) Forecast, by Application 2020 & 2033
- Table 73: Global Helical CT Scanner Revenue billion Forecast, by Application 2020 & 2033
- Table 74: Global Helical CT Scanner Volume K Forecast, by Application 2020 & 2033
- Table 75: Global Helical CT Scanner Revenue billion Forecast, by Types 2020 & 2033
- Table 76: Global Helical CT Scanner Volume K Forecast, by Types 2020 & 2033
- Table 77: Global Helical CT Scanner Revenue billion Forecast, by Country 2020 & 2033
- Table 78: Global Helical CT Scanner Volume K Forecast, by Country 2020 & 2033
- Table 79: China Helical CT Scanner Revenue (billion) Forecast, by Application 2020 & 2033
- Table 80: China Helical CT Scanner Volume (K) Forecast, by Application 2020 & 2033
- Table 81: India Helical CT Scanner Revenue (billion) Forecast, by Application 2020 & 2033
- Table 82: India Helical CT Scanner Volume (K) Forecast, by Application 2020 & 2033
- Table 83: Japan Helical CT Scanner Revenue (billion) Forecast, by Application 2020 & 2033
- Table 84: Japan Helical CT Scanner Volume (K) Forecast, by Application 2020 & 2033
- Table 85: South Korea Helical CT Scanner Revenue (billion) Forecast, by Application 2020 & 2033
- Table 86: South Korea Helical CT Scanner Volume (K) Forecast, by Application 2020 & 2033
- Table 87: ASEAN Helical CT Scanner Revenue (billion) Forecast, by Application 2020 & 2033
- Table 88: ASEAN Helical CT Scanner Volume (K) Forecast, by Application 2020 & 2033
- Table 89: Oceania Helical CT Scanner Revenue (billion) Forecast, by Application 2020 & 2033
- Table 90: Oceania Helical CT Scanner Volume (K) Forecast, by Application 2020 & 2033
- Table 91: Rest of Asia Pacific Helical CT Scanner Revenue (billion) Forecast, by Application 2020 & 2033
- Table 92: Rest of Asia Pacific Helical CT Scanner Volume (K) Forecast, by Application 2020 & 2033
Frequently Asked Questions
1. What is the projected Compound Annual Growth Rate (CAGR) of the Helical CT Scanner?
The projected CAGR is approximately 6.38%.
2. Which companies are prominent players in the Helical CT Scanner?
Key companies in the market include Canon Medical Systems, Philips, GE Healthcare, Siemens, Abex Medical, Shenzhen Anke, Toshiba, Hitachi.
3. What are the main segments of the Helical CT Scanner?
The market segments include Application, Types.
4. Can you provide details about the market size?
The market size is estimated to be USD 3.33 billion as of 2022.
5. What are some drivers contributing to market growth?
N/A
6. What are the notable trends driving market growth?
N/A
7. Are there any restraints impacting market growth?
N/A
8. Can you provide examples of recent developments in the market?
N/A
9. What pricing options are available for accessing the report?
Pricing options include single-user, multi-user, and enterprise licenses priced at USD 3350.00, USD 5025.00, and USD 6700.00 respectively.
10. Is the market size provided in terms of value or volume?
The market size is provided in terms of value, measured in billion and volume, measured in K.
11. Are there any specific market keywords associated with the report?
Yes, the market keyword associated with the report is "Helical CT Scanner," which aids in identifying and referencing the specific market segment covered.
12. How do I determine which pricing option suits my needs best?
The pricing options vary based on user requirements and access needs. Individual users may opt for single-user licenses, while businesses requiring broader access may choose multi-user or enterprise licenses for cost-effective access to the report.
13. Are there any additional resources or data provided in the Helical CT Scanner report?
While the report offers comprehensive insights, it's advisable to review the specific contents or supplementary materials provided to ascertain if additional resources or data are available.
14. How can I stay updated on further developments or reports in the Helical CT Scanner?
To stay informed about further developments, trends, and reports in the Helical CT Scanner, consider subscribing to industry newsletters, following relevant companies and organizations, or regularly checking reputable industry news sources and publications.
Methodology
Step 1 - Identification of Relevant Samples Size from Population Database


Step 2 - Approaches for Defining Global Market Size (Value, Volume* & Price*)

Note*: In applicable scenarios
Step 3 - Data Sources
Primary Research
- Web Analytics
- Survey Reports
- Research Institute
- Latest Research Reports
- Opinion Leaders
Secondary Research
- Annual Reports
- White Paper
- Latest Press Release
- Industry Association
- Paid Database
- Investor Presentations

Step 4 - Data Triangulation
Involves using different sources of information in order to increase the validity of a study
These sources are likely to be stakeholders in a program - participants, other researchers, program staff, other community members, and so on.
Then we put all data in single framework & apply various statistical tools to find out the dynamic on the market.
During the analysis stage, feedback from the stakeholder groups would be compared to determine areas of agreement as well as areas of divergence

