

Key Insights
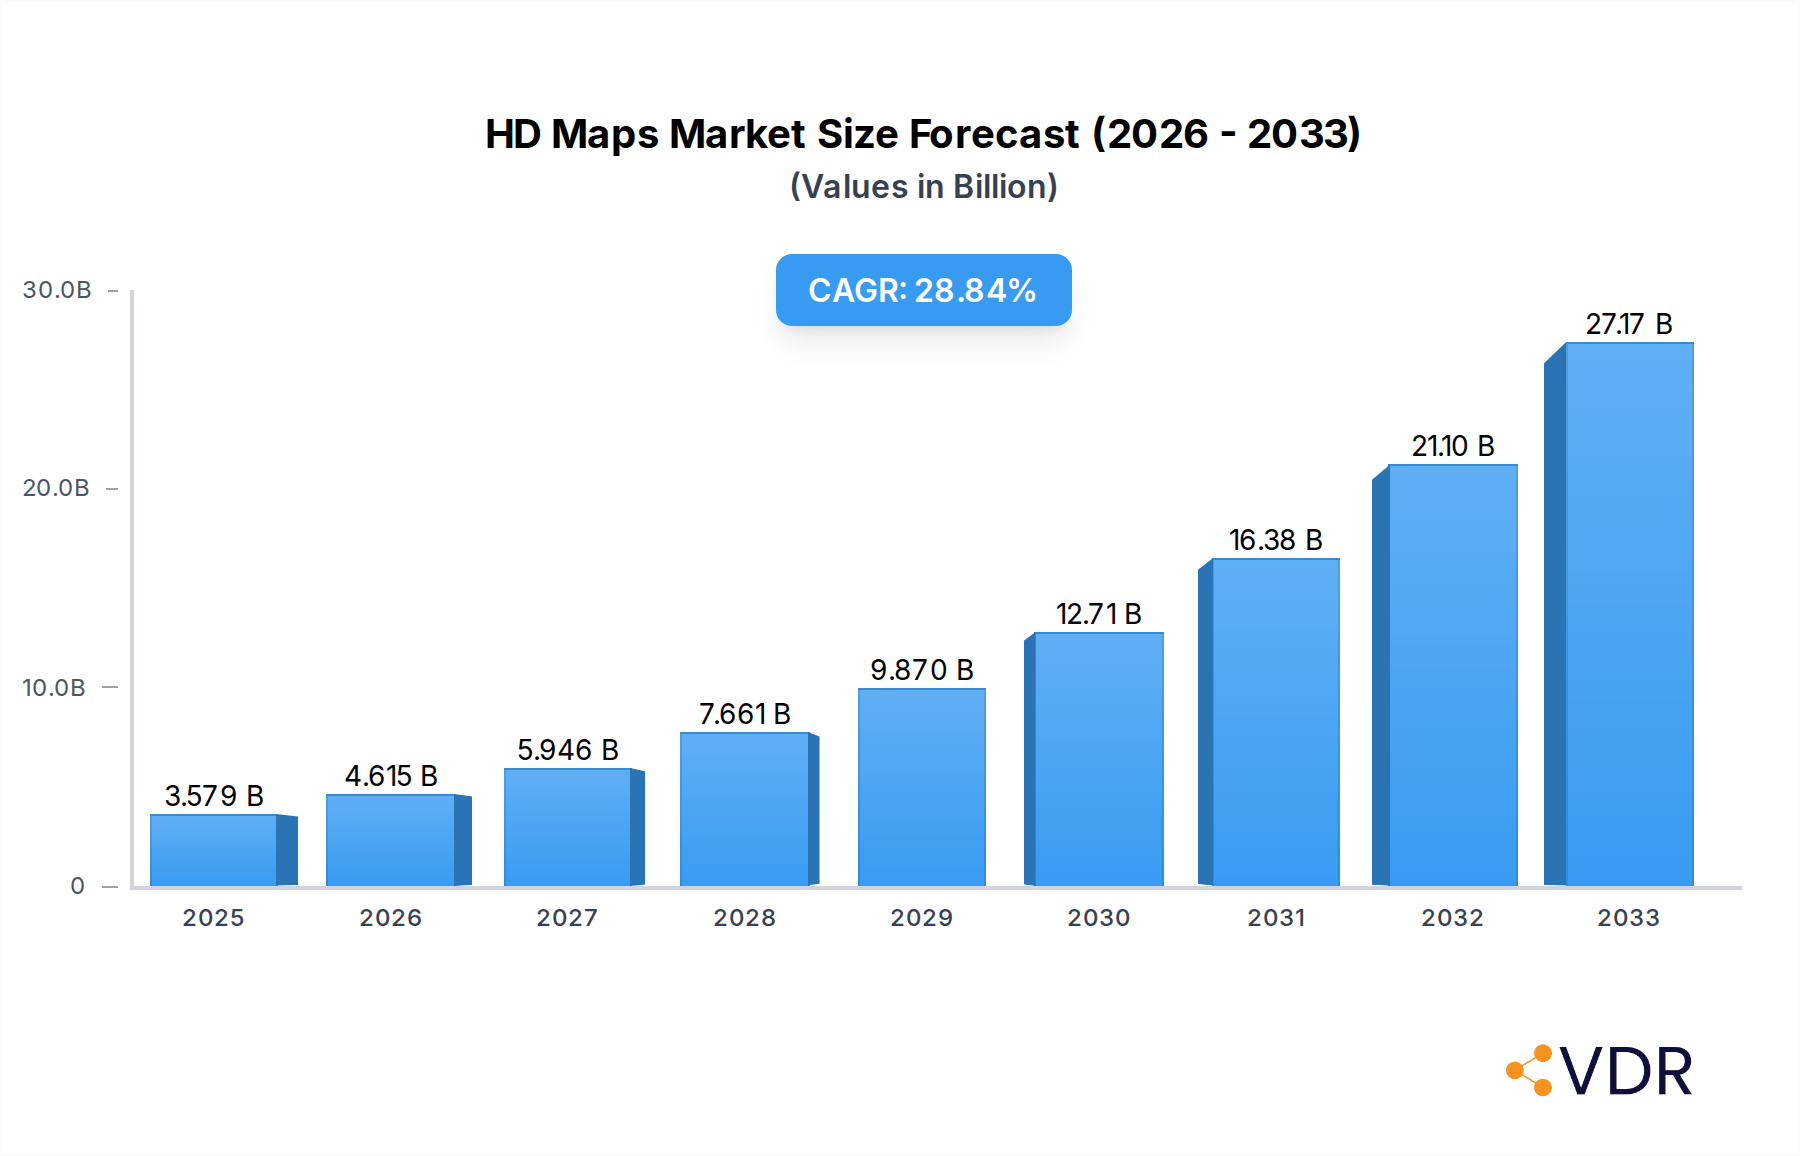
The High-Definition (HD) Maps market is poised for explosive growth, projected to reach an estimated $3579.5 million by 2025, driven by an impressive Compound Annual Growth Rate (CAGR) of 28.9% throughout the forecast period of 2025-2033. This significant expansion is primarily fueled by the accelerating adoption of Advanced Driver-Assistance Systems (ADAS) and the relentless pursuit of fully autonomous vehicles. The intricate, centimeter-level accuracy offered by HD maps is no longer a luxury but a fundamental requirement for safe and reliable navigation in complex driving environments, enabling features like precise lane keeping, adaptive cruise control, and ultimately, self-driving capabilities. The burgeoning automotive industry's investment in connected car technologies and the increasing demand for sophisticated in-car navigation and infotainment experiences further bolster this upward trajectory. Moreover, the ongoing development and deployment of smart city initiatives and the need for hyper-accurate location-based services across various industries are also contributing to the robust market demand for HD map solutions.

HD Maps Market Size (In Billion)
While the market is exceptionally promising, certain factors warrant attention. The substantial investment required for the creation and continuous updating of high-fidelity HD map data, encompassing surveying, processing, and validation, presents a notable restraint. The competitive landscape is characterized by a mix of established players and emerging innovators, with companies like TomTom, Google (Waymo), Alibaba (AutoNavi), NavInfo, and Baidu actively shaping the market. The prevailing trend leans towards both crowdsourcing models, leveraging real-time data from vehicles, and centralized modes, ensuring comprehensive and quality-controlled map coverage. Geographically, Asia Pacific, particularly China, is expected to lead in terms of market size and growth due to its massive automotive market and aggressive push towards autonomous driving technologies. North America and Europe are also significant contributors, driven by advanced automotive ecosystems and stringent safety regulations mandating sophisticated navigation solutions. The development of sophisticated algorithms for real-time map updates and integration with vehicle sensors will be crucial for sustained market leadership.
HD Maps Company Market Share
HD Maps Market: Comprehensive Analysis and Future Outlook (2019-2033)
This in-depth report offers a definitive analysis of the global HD Maps market, providing critical insights for stakeholders across the automotive, technology, and mapping industries. Covering a comprehensive study period from 2019 to 2033, with a detailed focus on the base and estimated year of 2025, and an extended forecast period, this report delivers actionable intelligence on market dynamics, growth trends, dominant segments, product landscape, and key players. We provide an exclusive view of the parent and child market structures, quantifying market size and evolution in millions of units and identifying key drivers, barriers, opportunities, and accelerators for sustained growth.
HD Maps Market Dynamics & Structure
The global HD Maps market exhibits a moderately concentrated structure, with a few dominant players holding significant market share, particularly in the highly competitive autonomous vehicle (AV) and advanced driver-assistance systems (ADAS) segments. Technological innovation is the primary engine driving market evolution, fueled by the relentless pursuit of centimeter-level accuracy and real-time updates. Key innovation drivers include advancements in sensor fusion, artificial intelligence (AI) for map data processing, and edge computing capabilities for efficient data management. Regulatory frameworks, while still evolving, are increasingly shaping market entry and data privacy standards, particularly concerning autonomous driving functionalities.
- Market Concentration: The top 5 players are estimated to command over 60% of the global market share by 2025, with significant contributions from entities like Google and Alibaba (AutoNavi) in the consumer and automotive sectors, and Navinfo and TomTom leading in specialized automotive mapping.
- Technological Innovation Drivers:
- Demand for enhanced ADAS features (e.g., lane keeping assist, adaptive cruise control).
- Critical need for precise localization and path planning for autonomous vehicles.
- Development of 5G networks for faster data transmission and real-time map updates.
- Integration of lidar, radar, and camera data for richer map layers.
- Regulatory Frameworks: Emerging standards for functional safety (ISO 26262) and data security are influencing development cycles and adoption rates.
- Competitive Product Substitutes: While direct substitutes for highly accurate HD maps are limited, advancements in sensor-based perception systems that can operate with less reliance on pre-mapped data present a potential competitive pressure in niche applications.
- End-User Demographics: The primary end-users are automotive OEMs, Tier-1 suppliers, and technology companies developing autonomous driving solutions. A growing secondary market includes ride-sharing services and logistics companies seeking optimized routing and fleet management.
- M&A Trends: The market has witnessed strategic acquisitions and partnerships to consolidate market position and acquire critical technologies. For instance, acquisitions of smaller mapping or data processing firms by larger players aim to bolster their HD map offerings. Deal volumes are projected to remain steady, driven by the need for comprehensive data sets and advanced algorithms.
HD Maps Growth Trends & Insights
The global HD Maps market is poised for substantial and sustained growth throughout the study period, driven by an escalating demand for enhanced safety, efficiency, and automation in the automotive sector. The market size is projected to expand from approximately $6,500 million in 2019 to an impressive $28,500 million by 2033, reflecting a robust compound annual growth rate (CAGR) of approximately 13% during the forecast period. This growth is underpinned by a significant increase in the adoption rates of vehicles equipped with advanced driver-assistance systems (ADAS) and the accelerating development and deployment of autonomous vehicles (AVs).
The market penetration of HD Maps is intrinsically linked to the vehicle's level of automation. As higher levels of autonomy become more prevalent, the reliance on detailed, accurate, and up-to-date HD maps becomes paramount. The centralized mode of HD map creation and maintenance is currently dominant, leveraging large-scale data collection and processing infrastructure. However, the crowdsourcing model, where data is collected from vehicles in operation, is gaining traction, offering scalability and real-time updates at potentially lower costs. This shift is particularly evident in urban environments where traffic density facilitates rapid data acquisition.
Technological disruptions are continuously reshaping the HD Maps landscape. Advancements in AI and machine learning are enabling more efficient map generation, validation, and update processes. Furthermore, the integration of various sensor modalities – including lidar, radar, and cameras – within vehicles allows for more granular and accurate map data to be collected and fused, creating richer digital twins of the environment. Consumer behavior is also playing a crucial role. As consumers become more accustomed to and demanding of sophisticated in-car technologies, the perceived value of features enabled by HD Maps, such as enhanced navigation accuracy and predictive safety warnings, is increasing.
The evolution from basic navigation maps to highly precise HD maps is a critical trend. This transition is driven by the need for functions that require centimeter-level accuracy, such as precise lane positioning, safe maneuvering in complex scenarios, and predictive capabilities for autonomous driving. The forecast period (2025-2033) is expected to witness a significant acceleration in the adoption of Level 3 and Level 4 autonomous driving systems, directly boosting the demand for comprehensive HD map solutions. The ability of HD Maps to provide rich contextual information – including road geometry, lane markings, traffic signs, and even temporary roadworks – is becoming indispensable for the safe and efficient operation of these advanced vehicle systems. The increasing connectivity of vehicles, facilitated by 5G technology, further enhances the potential for real-time map updates and data exchange, thereby improving the overall utility and performance of HD Map services. The global market size for HD maps is expected to reach approximately $15,200 million by 2025, growing from an estimated $10,100 million in 2023, indicating a strong upward trajectory.
Dominant Regions, Countries, or Segments in HD Maps
The Autonomous Vehicles application segment is unequivocally the primary growth engine and dominant force within the global HD Maps market, projecting significant market share and robust expansion potential through 2033. This dominance stems from the fundamental requirement for highly accurate, detailed, and real-time spatial information for the safe and efficient operation of self-driving vehicles across all levels of autonomy. The demand for HD Maps in this segment is directly correlated with the pace of AV development, testing, and eventual widespread deployment.
- Dominant Segment: Autonomous Vehicles (Application)
- Market Share: Projected to account for over 55% of the total HD Maps market by 2033, demonstrating substantial leadership.
- Growth Potential: Expected to exhibit a CAGR of approximately 15% during the forecast period, outpacing other segments significantly.
- Key Drivers for Dominance:
- Safety Imperative: Autonomous systems necessitate centimeter-level accuracy for localization, path planning, and obstacle avoidance, which only HD Maps can reliably provide.
- Regulatory Push: As governments worldwide begin to define frameworks for autonomous vehicle deployment, the need for standardized and robust HD mapping solutions becomes critical.
- Technological Advancements: Continuous innovation in AI, sensor fusion, and lidar technology directly benefits AV development, creating a symbiotic relationship with HD Map providers.
- OEM Investment: Major automotive manufacturers are heavily investing in AV technology, driving substantial demand for the underlying HD Map infrastructure.
- Fleet Operations: The commercial viability of ride-hailing and logistics services relying on autonomous fleets is a major catalyst for HD Map adoption.
- Dominant Regions & Countries:
- North America (USA): Leads due to significant R&D investment, regulatory sandboxes for AV testing, and the presence of major tech companies and automotive OEMs. The market size is estimated to reach $5,800 million by 2025.
- Europe (Germany, UK): Strong automotive manufacturing base, proactive regulatory approaches, and a focus on safety are driving demand. The European market is projected to reach $4,200 million by 2025.
- Asia-Pacific (China): Rapid technological adoption, substantial government support for smart mobility, and the presence of major players like Alibaba (AutoNavi) and Baidu position China as a rapidly growing and influential market. The APAC market is expected to reach $4,500 million by 2025.
- Type Dominance: While the Centralized Mode is currently the more established method for large-scale map creation, the Crowdsourcing Model is rapidly gaining momentum. By 2033, a hybrid approach, leveraging the strengths of both, is anticipated to be prevalent, with crowdsourced data augmenting centralized map production, particularly for real-time updates and anomaly detection. The crowdsourcing model is projected to see a CAGR of over 18% during the forecast period.
- Parent Market Considerations: The HD Maps market is a critical component of the broader "Smart Mobility" or "Connected and Autonomous Vehicles" parent market. Its growth is intrinsically tied to the overall success and adoption rates of these overarching technologies. The parent market is projected to reach over $300,000 million by 2033, with HD Maps representing a substantial and growing sub-segment.
- Child Market Insights: Within the HD Maps market, ADAS applications represent a significant child market, driven by the increasing prevalence of semi-autonomous features in mass-market vehicles. This segment, while less demanding in terms of absolute accuracy compared to full autonomy, still requires significantly more detailed maps than traditional navigation systems, contributing approximately 30% to the overall market by 2025, with a projected market size of $4,560 million. The "Others (Positioning)" segment, encompassing applications beyond automotive such as robotics and surveying, is a smaller but growing child market, projected to reach $1,000 million by 2025.
HD Maps Product Landscape
The HD Maps product landscape is characterized by continuous innovation, focusing on delivering hyper-accurate, richly detailed, and dynamic representations of the driving environment. Products range from comprehensive digital maps designed for Level 4/5 autonomous vehicles, incorporating detailed lane geometries, road furniture, and environmental features, to specialized map layers for ADAS functionalities that enhance safety and driver assistance. Performance metrics emphasize sub-decimeter accuracy, real-time update capabilities, and robust data integrity. Unique selling propositions include extensive global coverage, customizable data layers tailored to specific OEM needs, and advanced AI-driven validation processes ensuring the highest levels of reliability. Technological advancements are increasingly incorporating semantic information, such as speed limits, traffic light locations, and temporary construction zones, providing crucial context for advanced driving systems.
Key Drivers, Barriers & Challenges in HD Maps
Key Drivers: The HD Maps market is propelled by the escalating demand for enhanced automotive safety, the rapid advancement of autonomous driving technology, and the increasing adoption of sophisticated ADAS features. The development of 5G infrastructure for real-time data transmission and the growing investment by automotive OEMs and technology giants are also significant accelerators.
- Technological: Pursuit of higher levels of vehicle autonomy, sensor fusion capabilities, and AI for data processing.
- Economic: Growth in the automotive industry, particularly in segments focused on advanced features and electrification.
- Policy-Driven: Government initiatives and regulations supporting the development and deployment of autonomous vehicles and smart city infrastructure.
Barriers & Challenges: Significant challenges include the substantial cost and complexity associated with creating and maintaining highly accurate HD maps, particularly in dynamic urban environments. Data privacy concerns, regulatory inconsistencies across different regions, and the need for robust cybersecurity measures are also critical hurdles. Furthermore, the interoperability of different mapping systems and the potential for obsolescence due to rapid infrastructure changes present ongoing challenges.
- Supply Chain Issues: Ensuring a consistent supply of high-quality sensor data and processing power.
- Regulatory Hurdles: Navigating varying data standards, safety certifications, and legal frameworks globally.
- Competitive Pressures: Intense competition among established players and emerging startups for market share and technological leadership.
- Data Scalability & Maintenance: The sheer volume of data required and the need for continuous updates in real-time are significant operational challenges.
- Cybersecurity Threats: Protecting sensitive map data from unauthorized access and manipulation.
Emerging Opportunities in HD Maps
Emerging opportunities in the HD Maps sector lie in the expansion of applications beyond traditional automotive use, the development of more efficient and cost-effective data collection and processing methods, and the integration of advanced AI for predictive mapping. The growing demand for hyper-localized mapping services for smart cities, urban air mobility (UAM), and advanced logistics presents significant untapped potential. Furthermore, the creation of dynamic, real-time maps that incorporate not only static road features but also transient information like traffic flow, weather conditions, and pedestrian movement will unlock new levels of intelligent transportation systems. The rise of digital twins for urban planning and infrastructure management also presents a compelling opportunity for HD map providers.
Growth Accelerators in the HD Maps Industry
Long-term growth in the HD Maps industry will be catalyzed by significant technological breakthroughs, strategic partnerships between mapping companies and automotive OEMs, and the proactive expansion of market reach into new geographical territories and application domains. The continued maturation of AI and machine learning algorithms for map generation and validation will be crucial, enabling faster production cycles and enhanced data quality. Furthermore, the standardization of HD map data formats and the development of open-source platforms can foster greater collaboration and accelerate adoption. Strategic alliances that integrate HD map capabilities directly into vehicle software stacks and cloud platforms will also be key growth accelerators, ensuring seamless integration and user experience.
Key Players Shaping the HD Maps Market
- TomTom
- Alibaba (AutoNavi)
- Navinfo
- Mobileye
- Sanborn
- Baidu
Notable Milestones in HD Maps Sector
- 2019: Release of significant advancements in lidar-based map creation by several key players, enhancing accuracy for autonomous vehicles.
- 2020: Increased investment in crowdsourcing initiatives for real-time map data collection by major mapping providers.
- 2021: Launch of new HD map platforms specifically designed for Level 3 and Level 4 autonomous driving systems by leading automotive suppliers.
- 2022: Expansion of HD map coverage in emerging markets, particularly in Asia-Pacific, driven by the growth of connected car technologies.
- 2023: Strategic partnerships formed between HD map providers and semiconductor companies to optimize processing power for in-vehicle map data.
- Early 2024: Introduction of AI-powered predictive mapping capabilities, enabling maps to forecast potential road hazards and traffic patterns.
In-Depth HD Maps Market Outlook
The future outlook for the HD Maps market is exceptionally bright, driven by the inexorable march towards autonomous mobility and the increasing sophistication of intelligent vehicle systems. Growth accelerators such as advanced AI for map generation, strategic collaborations with automotive giants, and global market expansion will solidify the indispensable role of HD Maps. The market is set to transform not just how we navigate, but how vehicles perceive and interact with their environment, promising enhanced safety, efficiency, and entirely new mobility paradigms. The projected market size of over $28,500 million by 2033 underscores its critical importance and substantial growth potential within the broader technology and automotive ecosystems.
HD Maps Segmentation
-
1. Application
- 1.1. ADAS
- 1.2. Autonomous Vehicles
- 1.3. Others (Positioning)
-
2. Types
- 2.1. Crowdsourcing Model
- 2.2. Centralized Mode
HD Maps Segmentation By Geography
-
1. North America
- 1.1. United States
- 1.2. Canada
- 1.3. Mexico
-
2. South America
- 2.1. Brazil
- 2.2. Argentina
- 2.3. Rest of South America
-
3. Europe
- 3.1. United Kingdom
- 3.2. Germany
- 3.3. France
- 3.4. Italy
- 3.5. Spain
- 3.6. Russia
- 3.7. Benelux
- 3.8. Nordics
- 3.9. Rest of Europe
-
4. Middle East & Africa
- 4.1. Turkey
- 4.2. Israel
- 4.3. GCC
- 4.4. North Africa
- 4.5. South Africa
- 4.6. Rest of Middle East & Africa
-
5. Asia Pacific
- 5.1. China
- 5.2. India
- 5.3. Japan
- 5.4. South Korea
- 5.5. ASEAN
- 5.6. Oceania
- 5.7. Rest of Asia Pacific
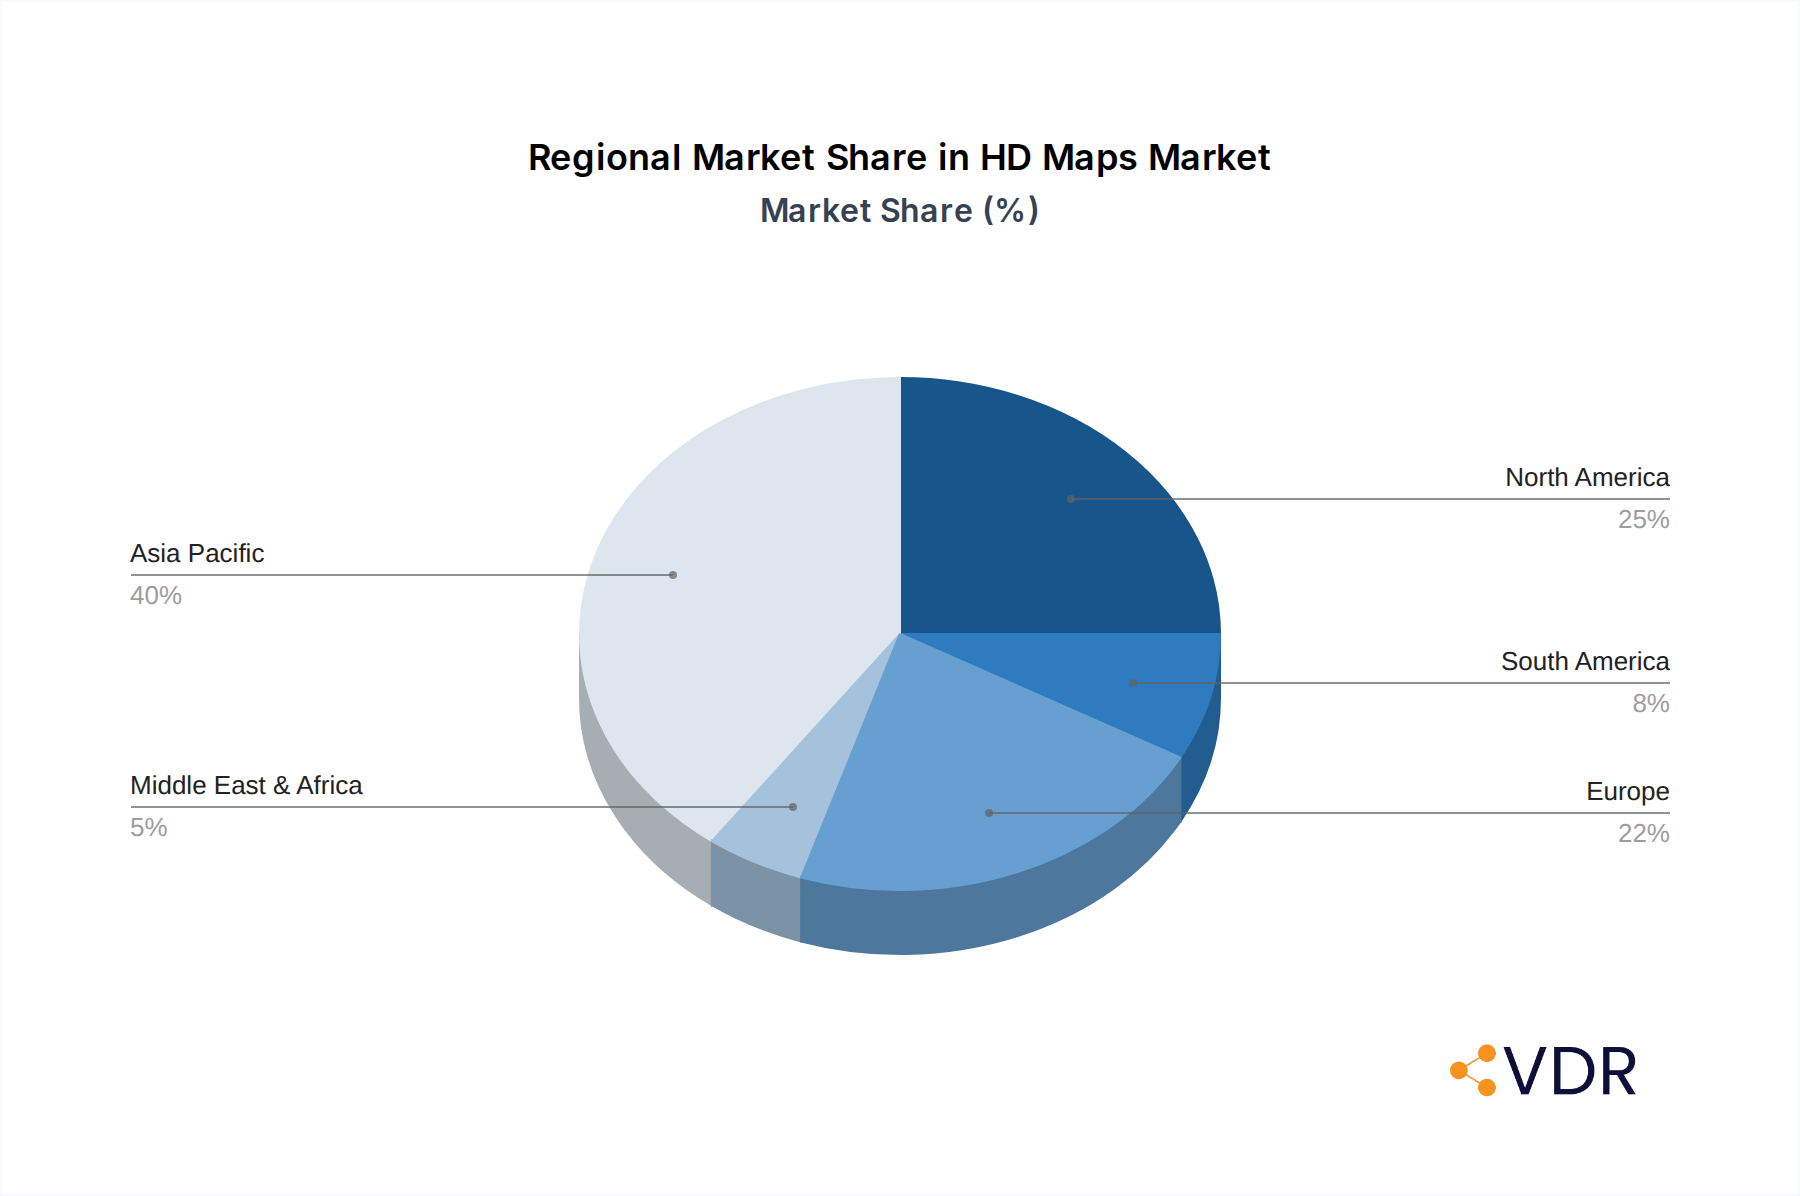
HD Maps Regional Market Share
Geographic Coverage of HD Maps
HD Maps REPORT HIGHLIGHTS
| Aspects | Details |
|---|---|
| Study Period | 2020-2034 |
| Base Year | 2025 |
| Estimated Year | 2026 |
| Forecast Period | 2026-2034 |
| Historical Period | 2020-2025 |
| Growth Rate | CAGR of 28.9% from 2020-2034 |
| Segmentation |
|
Table of Contents
- 1. Introduction
- 1.1. Research Scope
- 1.2. Market Segmentation
- 1.3. Research Methodology
- 1.4. Definitions and Assumptions
- 2. Executive Summary
- 2.1. Introduction
- 3. Market Dynamics
- 3.1. Introduction
- 3.2. Market Drivers
- 3.3. Market Restrains
- 3.4. Market Trends
- 4. Market Factor Analysis
- 4.1. Porters Five Forces
- 4.2. Supply/Value Chain
- 4.3. PESTEL analysis
- 4.4. Market Entropy
- 4.5. Patent/Trademark Analysis
- 5. Global HD Maps Analysis, Insights and Forecast, 2020-2032
- 5.1. Market Analysis, Insights and Forecast - by Application
- 5.1.1. ADAS
- 5.1.2. Autonomous Vehicles
- 5.1.3. Others (Positioning)
- 5.2. Market Analysis, Insights and Forecast - by Types
- 5.2.1. Crowdsourcing Model
- 5.2.2. Centralized Mode
- 5.3. Market Analysis, Insights and Forecast - by Region
- 5.3.1. North America
- 5.3.2. South America
- 5.3.3. Europe
- 5.3.4. Middle East & Africa
- 5.3.5. Asia Pacific
- 5.1. Market Analysis, Insights and Forecast - by Application
- 6. North America HD Maps Analysis, Insights and Forecast, 2020-2032
- 6.1. Market Analysis, Insights and Forecast - by Application
- 6.1.1. ADAS
- 6.1.2. Autonomous Vehicles
- 6.1.3. Others (Positioning)
- 6.2. Market Analysis, Insights and Forecast - by Types
- 6.2.1. Crowdsourcing Model
- 6.2.2. Centralized Mode
- 6.1. Market Analysis, Insights and Forecast - by Application
- 7. South America HD Maps Analysis, Insights and Forecast, 2020-2032
- 7.1. Market Analysis, Insights and Forecast - by Application
- 7.1.1. ADAS
- 7.1.2. Autonomous Vehicles
- 7.1.3. Others (Positioning)
- 7.2. Market Analysis, Insights and Forecast - by Types
- 7.2.1. Crowdsourcing Model
- 7.2.2. Centralized Mode
- 7.1. Market Analysis, Insights and Forecast - by Application
- 8. Europe HD Maps Analysis, Insights and Forecast, 2020-2032
- 8.1. Market Analysis, Insights and Forecast - by Application
- 8.1.1. ADAS
- 8.1.2. Autonomous Vehicles
- 8.1.3. Others (Positioning)
- 8.2. Market Analysis, Insights and Forecast - by Types
- 8.2.1. Crowdsourcing Model
- 8.2.2. Centralized Mode
- 8.1. Market Analysis, Insights and Forecast - by Application
- 9. Middle East & Africa HD Maps Analysis, Insights and Forecast, 2020-2032
- 9.1. Market Analysis, Insights and Forecast - by Application
- 9.1.1. ADAS
- 9.1.2. Autonomous Vehicles
- 9.1.3. Others (Positioning)
- 9.2. Market Analysis, Insights and Forecast - by Types
- 9.2.1. Crowdsourcing Model
- 9.2.2. Centralized Mode
- 9.1. Market Analysis, Insights and Forecast - by Application
- 10. Asia Pacific HD Maps Analysis, Insights and Forecast, 2020-2032
- 10.1. Market Analysis, Insights and Forecast - by Application
- 10.1.1. ADAS
- 10.1.2. Autonomous Vehicles
- 10.1.3. Others (Positioning)
- 10.2. Market Analysis, Insights and Forecast - by Types
- 10.2.1. Crowdsourcing Model
- 10.2.2. Centralized Mode
- 10.1. Market Analysis, Insights and Forecast - by Application
- 11. Competitive Analysis
- 11.1. Global Market Share Analysis 2025
- 11.2. Company Profiles
- 11.2.1 Here
- 11.2.1.1. Overview
- 11.2.1.2. Products
- 11.2.1.3. SWOT Analysis
- 11.2.1.4. Recent Developments
- 11.2.1.5. Financials (Based on Availability)
- 11.2.2 TomTom
- 11.2.2.1. Overview
- 11.2.2.2. Products
- 11.2.2.3. SWOT Analysis
- 11.2.2.4. Recent Developments
- 11.2.2.5. Financials (Based on Availability)
- 11.2.3 Google
- 11.2.3.1. Overview
- 11.2.3.2. Products
- 11.2.3.3. SWOT Analysis
- 11.2.3.4. Recent Developments
- 11.2.3.5. Financials (Based on Availability)
- 11.2.4 Alibaba (AutoNavi)
- 11.2.4.1. Overview
- 11.2.4.2. Products
- 11.2.4.3. SWOT Analysis
- 11.2.4.4. Recent Developments
- 11.2.4.5. Financials (Based on Availability)
- 11.2.5 Navinfo
- 11.2.5.1. Overview
- 11.2.5.2. Products
- 11.2.5.3. SWOT Analysis
- 11.2.5.4. Recent Developments
- 11.2.5.5. Financials (Based on Availability)
- 11.2.6 Mobileye
- 11.2.6.1. Overview
- 11.2.6.2. Products
- 11.2.6.3. SWOT Analysis
- 11.2.6.4. Recent Developments
- 11.2.6.5. Financials (Based on Availability)
- 11.2.7 Sanborn
- 11.2.7.1. Overview
- 11.2.7.2. Products
- 11.2.7.3. SWOT Analysis
- 11.2.7.4. Recent Developments
- 11.2.7.5. Financials (Based on Availability)
- 11.2.8 Baidu
- 11.2.8.1. Overview
- 11.2.8.2. Products
- 11.2.8.3. SWOT Analysis
- 11.2.8.4. Recent Developments
- 11.2.8.5. Financials (Based on Availability)
- 11.2.1 Here
List of Figures
- Figure 1: Global HD Maps Revenue Breakdown (million, %) by Region 2025 & 2033
- Figure 2: North America HD Maps Revenue (million), by Application 2025 & 2033
- Figure 3: North America HD Maps Revenue Share (%), by Application 2025 & 2033
- Figure 4: North America HD Maps Revenue (million), by Types 2025 & 2033
- Figure 5: North America HD Maps Revenue Share (%), by Types 2025 & 2033
- Figure 6: North America HD Maps Revenue (million), by Country 2025 & 2033
- Figure 7: North America HD Maps Revenue Share (%), by Country 2025 & 2033
- Figure 8: South America HD Maps Revenue (million), by Application 2025 & 2033
- Figure 9: South America HD Maps Revenue Share (%), by Application 2025 & 2033
- Figure 10: South America HD Maps Revenue (million), by Types 2025 & 2033
- Figure 11: South America HD Maps Revenue Share (%), by Types 2025 & 2033
- Figure 12: South America HD Maps Revenue (million), by Country 2025 & 2033
- Figure 13: South America HD Maps Revenue Share (%), by Country 2025 & 2033
- Figure 14: Europe HD Maps Revenue (million), by Application 2025 & 2033
- Figure 15: Europe HD Maps Revenue Share (%), by Application 2025 & 2033
- Figure 16: Europe HD Maps Revenue (million), by Types 2025 & 2033
- Figure 17: Europe HD Maps Revenue Share (%), by Types 2025 & 2033
- Figure 18: Europe HD Maps Revenue (million), by Country 2025 & 2033
- Figure 19: Europe HD Maps Revenue Share (%), by Country 2025 & 2033
- Figure 20: Middle East & Africa HD Maps Revenue (million), by Application 2025 & 2033
- Figure 21: Middle East & Africa HD Maps Revenue Share (%), by Application 2025 & 2033
- Figure 22: Middle East & Africa HD Maps Revenue (million), by Types 2025 & 2033
- Figure 23: Middle East & Africa HD Maps Revenue Share (%), by Types 2025 & 2033
- Figure 24: Middle East & Africa HD Maps Revenue (million), by Country 2025 & 2033
- Figure 25: Middle East & Africa HD Maps Revenue Share (%), by Country 2025 & 2033
- Figure 26: Asia Pacific HD Maps Revenue (million), by Application 2025 & 2033
- Figure 27: Asia Pacific HD Maps Revenue Share (%), by Application 2025 & 2033
- Figure 28: Asia Pacific HD Maps Revenue (million), by Types 2025 & 2033
- Figure 29: Asia Pacific HD Maps Revenue Share (%), by Types 2025 & 2033
- Figure 30: Asia Pacific HD Maps Revenue (million), by Country 2025 & 2033
- Figure 31: Asia Pacific HD Maps Revenue Share (%), by Country 2025 & 2033
List of Tables
- Table 1: Global HD Maps Revenue million Forecast, by Application 2020 & 2033
- Table 2: Global HD Maps Revenue million Forecast, by Types 2020 & 2033
- Table 3: Global HD Maps Revenue million Forecast, by Region 2020 & 2033
- Table 4: Global HD Maps Revenue million Forecast, by Application 2020 & 2033
- Table 5: Global HD Maps Revenue million Forecast, by Types 2020 & 2033
- Table 6: Global HD Maps Revenue million Forecast, by Country 2020 & 2033
- Table 7: United States HD Maps Revenue (million) Forecast, by Application 2020 & 2033
- Table 8: Canada HD Maps Revenue (million) Forecast, by Application 2020 & 2033
- Table 9: Mexico HD Maps Revenue (million) Forecast, by Application 2020 & 2033
- Table 10: Global HD Maps Revenue million Forecast, by Application 2020 & 2033
- Table 11: Global HD Maps Revenue million Forecast, by Types 2020 & 2033
- Table 12: Global HD Maps Revenue million Forecast, by Country 2020 & 2033
- Table 13: Brazil HD Maps Revenue (million) Forecast, by Application 2020 & 2033
- Table 14: Argentina HD Maps Revenue (million) Forecast, by Application 2020 & 2033
- Table 15: Rest of South America HD Maps Revenue (million) Forecast, by Application 2020 & 2033
- Table 16: Global HD Maps Revenue million Forecast, by Application 2020 & 2033
- Table 17: Global HD Maps Revenue million Forecast, by Types 2020 & 2033
- Table 18: Global HD Maps Revenue million Forecast, by Country 2020 & 2033
- Table 19: United Kingdom HD Maps Revenue (million) Forecast, by Application 2020 & 2033
- Table 20: Germany HD Maps Revenue (million) Forecast, by Application 2020 & 2033
- Table 21: France HD Maps Revenue (million) Forecast, by Application 2020 & 2033
- Table 22: Italy HD Maps Revenue (million) Forecast, by Application 2020 & 2033
- Table 23: Spain HD Maps Revenue (million) Forecast, by Application 2020 & 2033
- Table 24: Russia HD Maps Revenue (million) Forecast, by Application 2020 & 2033
- Table 25: Benelux HD Maps Revenue (million) Forecast, by Application 2020 & 2033
- Table 26: Nordics HD Maps Revenue (million) Forecast, by Application 2020 & 2033
- Table 27: Rest of Europe HD Maps Revenue (million) Forecast, by Application 2020 & 2033
- Table 28: Global HD Maps Revenue million Forecast, by Application 2020 & 2033
- Table 29: Global HD Maps Revenue million Forecast, by Types 2020 & 2033
- Table 30: Global HD Maps Revenue million Forecast, by Country 2020 & 2033
- Table 31: Turkey HD Maps Revenue (million) Forecast, by Application 2020 & 2033
- Table 32: Israel HD Maps Revenue (million) Forecast, by Application 2020 & 2033
- Table 33: GCC HD Maps Revenue (million) Forecast, by Application 2020 & 2033
- Table 34: North Africa HD Maps Revenue (million) Forecast, by Application 2020 & 2033
- Table 35: South Africa HD Maps Revenue (million) Forecast, by Application 2020 & 2033
- Table 36: Rest of Middle East & Africa HD Maps Revenue (million) Forecast, by Application 2020 & 2033
- Table 37: Global HD Maps Revenue million Forecast, by Application 2020 & 2033
- Table 38: Global HD Maps Revenue million Forecast, by Types 2020 & 2033
- Table 39: Global HD Maps Revenue million Forecast, by Country 2020 & 2033
- Table 40: China HD Maps Revenue (million) Forecast, by Application 2020 & 2033
- Table 41: India HD Maps Revenue (million) Forecast, by Application 2020 & 2033
- Table 42: Japan HD Maps Revenue (million) Forecast, by Application 2020 & 2033
- Table 43: South Korea HD Maps Revenue (million) Forecast, by Application 2020 & 2033
- Table 44: ASEAN HD Maps Revenue (million) Forecast, by Application 2020 & 2033
- Table 45: Oceania HD Maps Revenue (million) Forecast, by Application 2020 & 2033
- Table 46: Rest of Asia Pacific HD Maps Revenue (million) Forecast, by Application 2020 & 2033
Frequently Asked Questions
1. What is the projected Compound Annual Growth Rate (CAGR) of the HD Maps?
The projected CAGR is approximately 28.9%.
2. Which companies are prominent players in the HD Maps?
Key companies in the market include Here, TomTom, Google, Alibaba (AutoNavi), Navinfo, Mobileye, Sanborn, Baidu.
3. What are the main segments of the HD Maps?
The market segments include Application, Types.
4. Can you provide details about the market size?
The market size is estimated to be USD 3579.5 million as of 2022.
5. What are some drivers contributing to market growth?
N/A
6. What are the notable trends driving market growth?
N/A
7. Are there any restraints impacting market growth?
N/A
8. Can you provide examples of recent developments in the market?
N/A
9. What pricing options are available for accessing the report?
Pricing options include single-user, multi-user, and enterprise licenses priced at USD 3950.00, USD 5925.00, and USD 7900.00 respectively.
10. Is the market size provided in terms of value or volume?
The market size is provided in terms of value, measured in million.
11. Are there any specific market keywords associated with the report?
Yes, the market keyword associated with the report is "HD Maps," which aids in identifying and referencing the specific market segment covered.
12. How do I determine which pricing option suits my needs best?
The pricing options vary based on user requirements and access needs. Individual users may opt for single-user licenses, while businesses requiring broader access may choose multi-user or enterprise licenses for cost-effective access to the report.
13. Are there any additional resources or data provided in the HD Maps report?
While the report offers comprehensive insights, it's advisable to review the specific contents or supplementary materials provided to ascertain if additional resources or data are available.
14. How can I stay updated on further developments or reports in the HD Maps?
To stay informed about further developments, trends, and reports in the HD Maps, consider subscribing to industry newsletters, following relevant companies and organizations, or regularly checking reputable industry news sources and publications.
Methodology
Step 1 - Identification of Relevant Samples Size from Population Database


Step 2 - Approaches for Defining Global Market Size (Value, Volume* & Price*)

Note*: In applicable scenarios
Step 3 - Data Sources
Primary Research
- Web Analytics
- Survey Reports
- Research Institute
- Latest Research Reports
- Opinion Leaders
Secondary Research
- Annual Reports
- White Paper
- Latest Press Release
- Industry Association
- Paid Database
- Investor Presentations

Step 4 - Data Triangulation
Involves using different sources of information in order to increase the validity of a study
These sources are likely to be stakeholders in a program - participants, other researchers, program staff, other community members, and so on.
Then we put all data in single framework & apply various statistical tools to find out the dynamic on the market.
During the analysis stage, feedback from the stakeholder groups would be compared to determine areas of agreement as well as areas of divergence