


Key Insights
The global harbor dredging market is poised for substantial expansion, fueled by escalating international trade and the imperative to enhance port capacity through the expansion and deepening of existing facilities and the development of new ones. The increasing adoption of larger vessels necessitates upgraded port infrastructure, a pivotal factor driving market growth. Significant government investment in infrastructure development worldwide, particularly in rapidly industrializing and urbanizing developing economies, further bolsters market expansion. Innovations in dredging technology, leading to enhanced efficiency and reduced environmental footprints, are also key growth catalysts. Despite hurdles such as stringent environmental regulations and the impact of commodity price volatility on project financing, the harbor dredging market forecasts a consistent Compound Annual Growth Rate (CAGR) of 2.65%. The estimated market size is $11.16 billion in the base year 2024.
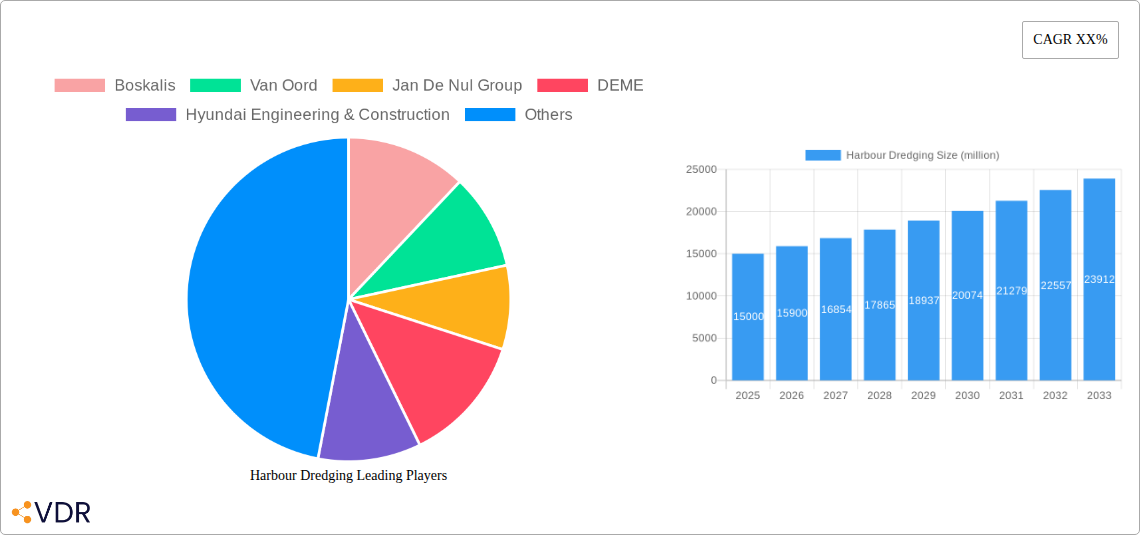
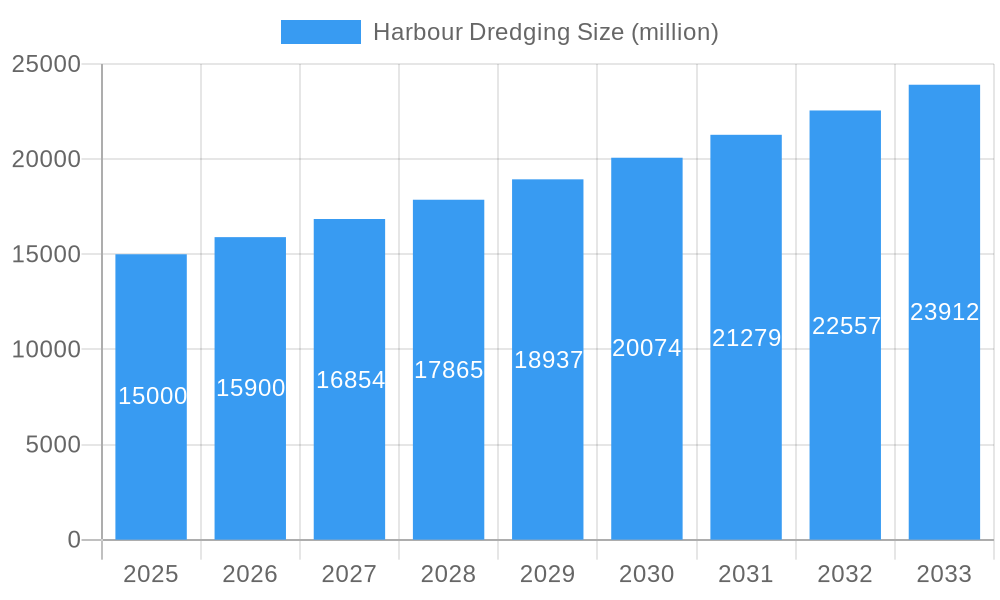
Harbour Dredging Market Size (In Billion)

Anticipated growth will be propelled by extensive global infrastructure projects. Leading entities such as Boskalis, Van Oord, Jan De Nul Group, and DEME are strategically positioned to leverage this expansion. However, robust competition from established players and the emergence of new regional contractors will necessitate strategic alliances and novel strategies for sustained market presence. The market's trajectory will also be shaped by a persistent emphasis on sustainable dredging methodologies, minimizing ecological impact, and deploying cutting-edge technologies for cost optimization and operational safety enhancement. Regional growth disparities will be influenced by economic climates, regulatory landscapes, and the extent of port development activities within each area. This ongoing dynamic necessitates adaptable business strategies for navigating the complexities of this evolving market.
Harbour Dredging Company Market Share
Harbour Dredging Market Report: 2019-2033
A comprehensive analysis of the global harbour dredging market, providing in-depth insights into market dynamics, growth trends, key players, and future opportunities. This report covers the period from 2019 to 2033, with a focus on the 2025-2033 forecast period. The base year for this analysis is 2025. The parent market is the dredging industry, and the child market is specifically harbour dredging.
Keywords: Harbour dredging, dredging market, port development, maritime infrastructure, dredging contractors, Boskalis, Van Oord, Jan De Nul Group, DEME, Hyundai Engineering & Construction, Penta Ocean Construction, China Harbor Engineering, Great Lakes Dredge & Dock, Toa Corporation, market size, market share, CAGR, market growth, industry trends, competitive landscape, technological advancements, regulatory framework.
Harbour Dredging Market Dynamics & Structure
The global harbour dredging market is characterized by a moderately concentrated structure, with a few large players dominating the landscape. The market size in 2025 is estimated at $XX billion. These key players, including Boskalis, Van Oord, Jan De Nul Group, and DEME, collectively hold approximately 60% of the market share. Technological innovation, primarily in dredging equipment and techniques, plays a crucial role in driving market growth. Stringent environmental regulations and a growing focus on sustainable dredging practices are shaping market dynamics. Substitutes for harbour dredging are limited, though alternative approaches like land reclamation may be considered in specific scenarios. End-user demographics primarily consist of government agencies, port authorities, and private companies involved in maritime infrastructure development. M&A activity has been moderate in recent years, with approximately XX deals recorded between 2019 and 2024, primarily focusing on consolidation and expansion into new geographies.
- Market Concentration: Highly concentrated, with top 5 players holding ~60% market share in 2025.
- Technological Innovation: Focus on automation, efficiency, and environmentally friendly techniques.
- Regulatory Framework: Stringent environmental regulations drive adoption of sustainable practices.
- Competitive Substitutes: Limited substitutes, with land reclamation being a possible alternative.
- End-User Demographics: Primarily government agencies, port authorities, and private sector companies.
- M&A Trends: Moderate activity, driven by consolidation and geographic expansion (XX deals, 2019-2024).
Harbour Dredging Growth Trends & Insights
The harbour dredging market has experienced consistent growth over the historical period (2019-2024), driven by increasing global trade, port expansion projects, and the need for deeper waterways to accommodate larger vessels. The market experienced a CAGR of XX% during this period. Adoption rates for new technologies, such as GPS-guided dredging and specialized cutter suction dredgers, have steadily increased, leading to improved efficiency and reduced environmental impact. Shifting consumer behaviour, reflected in the increased demand for sustainable and environmentally responsible dredging practices, is also significantly influencing market dynamics. We project a CAGR of XX% for the forecast period (2025-2033), with the market size reaching an estimated $XX billion by 2033. Market penetration is expected to increase, particularly in developing economies with significant port infrastructure development plans.
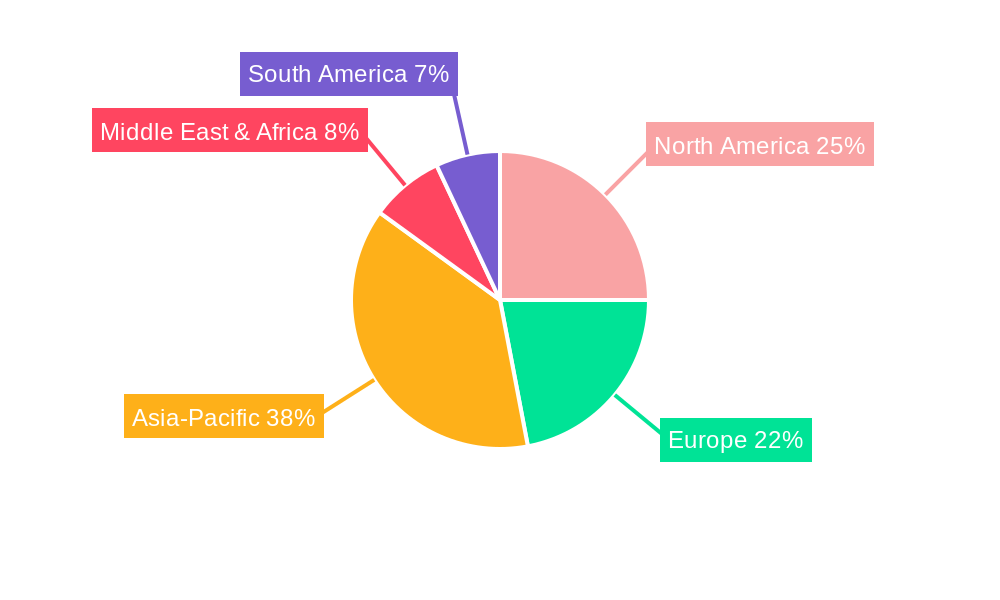
Dominant Regions, Countries, or Segments in Harbour Dredging
Asia-Pacific dominates the global harbour dredging market, driven by robust economic growth, significant port infrastructure development, and increasing trade volumes. China, India, and Southeast Asian countries represent key growth drivers within this region. Europe and North America also hold substantial market shares, driven by ongoing maintenance and expansion projects in existing ports.
- Key Drivers (Asia-Pacific):
- Rapid economic growth and increasing trade volumes.
- Significant government investment in port infrastructure development.
- Rising demand for deeper waterways to accommodate larger vessels.
- Dominance Factors:
- High volume of port construction and expansion projects.
- Strategic location along major shipping routes.
- Supportive government policies and regulations.
- Growth Potential: Continued expansion of port infrastructure, coupled with increasing container traffic, will drive future growth.
Harbour Dredging Product Landscape
The harbour dredging product landscape encompasses a range of specialized equipment, including cutter suction dredgers, trailing suction hopper dredgers, and grab dredgers. Technological advancements have led to the development of more efficient, precise, and environmentally friendly dredging equipment. The unique selling propositions of these products include increased dredging capacity, improved precision, and reduced environmental impact. Key performance metrics include dredging rate, fuel efficiency, and environmental compliance.
Key Drivers, Barriers & Challenges in Harbour Dredging
Key Drivers: Increased global trade, port expansion projects, the need for deeper waterways, and government investments in maritime infrastructure are primary growth drivers. Technological advancements in dredging equipment and techniques further enhance market expansion.
Challenges & Restraints: Stringent environmental regulations, rising fuel costs, and intense competition among dredging contractors pose significant challenges. Supply chain disruptions and geopolitical instability can also impact project timelines and costs. We estimate that regulatory compliance adds approximately XX% to project costs.
Emerging Opportunities in Harbour Dredging
Emerging opportunities lie in the development of sustainable dredging practices, the adoption of advanced technologies like AI and automation, and the expansion into new geographic markets with growing port infrastructure needs. The increasing demand for environmentally friendly dredging solutions creates a significant opportunity for companies to develop and implement innovative technologies and methods. Untapped markets in Africa and South America present substantial growth potential.
Growth Accelerators in the Harbour Dredging Industry
Technological advancements in dredging equipment and techniques, strategic partnerships between dredging contractors and port authorities, and the expansion into new geographic markets are key catalysts driving long-term growth in the harbour dredging industry. Government initiatives promoting sustainable infrastructure development also play a significant role in shaping future market expansion.
Key Players Shaping the Harbour Dredging Market
- Boskalis
- Van Oord
- Jan De Nul Group
- DEME
- Hyundai Engineering & Construction
- Penta Ocean Construction
- China Harbor Engineering
- Great Lakes Dredge & Dock
- Toa Corporation
Notable Milestones in Harbour Dredging Sector
- 2020: Introduction of a new generation of environmentally friendly cutter suction dredgers by Boskalis.
- 2022: Successful completion of a large-scale port expansion project in Singapore by Van Oord.
- 2023: Merger of two smaller dredging companies in the Middle East.
- 2024: Implementation of new regulations regarding sustainable dredging practices in Europe.
In-Depth Harbour Dredging Market Outlook
The harbour dredging market is poised for continued growth over the forecast period (2025-2033), driven by sustained investments in port infrastructure, increasing global trade volumes, and ongoing technological advancements. Strategic partnerships, focus on sustainable practices, and expansion into emerging markets will be critical for success. The market presents significant opportunities for established players and new entrants alike, particularly those focused on innovation and sustainability. Further growth can be expected as technologies like AI and automation are deployed more widely within the industry.
Harbour Dredging Segmentation
-
1. Application
- 1.1. Government Organizations
- 1.2. Private Organizations
- 1.3. Mining & Energy Companies
- 1.4. Oil & Gas Companies
- 1.5. Other
-
2. Types
- 2.1. Capital
- 2.2. Coastal Protection
- 2.3. Maintenance
- 2.4. Rivers & Lakes
Harbour Dredging Segmentation By Geography
-
1. North America
- 1.1. United States
- 1.2. Canada
- 1.3. Mexico
-
2. South America
- 2.1. Brazil
- 2.2. Argentina
- 2.3. Rest of South America
-
3. Europe
- 3.1. United Kingdom
- 3.2. Germany
- 3.3. France
- 3.4. Italy
- 3.5. Spain
- 3.6. Russia
- 3.7. Benelux
- 3.8. Nordics
- 3.9. Rest of Europe
-
4. Middle East & Africa
- 4.1. Turkey
- 4.2. Israel
- 4.3. GCC
- 4.4. North Africa
- 4.5. South Africa
- 4.6. Rest of Middle East & Africa
-
5. Asia Pacific
- 5.1. China
- 5.2. India
- 5.3. Japan
- 5.4. South Korea
- 5.5. ASEAN
- 5.6. Oceania
- 5.7. Rest of Asia Pacific
Harbour Dredging Regional Market Share
Geographic Coverage of Harbour Dredging
Harbour Dredging REPORT HIGHLIGHTS
| Aspects | Details |
|---|---|
| Study Period | 2020-2034 |
| Base Year | 2025 |
| Estimated Year | 2026 |
| Forecast Period | 2026-2034 |
| Historical Period | 2020-2025 |
| Growth Rate | CAGR of 2.65% from 2020-2034 |
| Segmentation |
|
Table of Contents
- 1. Introduction
- 1.1. Research Scope
- 1.2. Market Segmentation
- 1.3. Research Methodology
- 1.4. Definitions and Assumptions
- 2. Executive Summary
- 2.1. Introduction
- 3. Market Dynamics
- 3.1. Introduction
- 3.2. Market Drivers
- 3.3. Market Restrains
- 3.4. Market Trends
- 4. Market Factor Analysis
- 4.1. Porters Five Forces
- 4.2. Supply/Value Chain
- 4.3. PESTEL analysis
- 4.4. Market Entropy
- 4.5. Patent/Trademark Analysis
- 5. Global Harbour Dredging Analysis, Insights and Forecast, 2020-2032
- 5.1. Market Analysis, Insights and Forecast - by Application
- 5.1.1. Government Organizations
- 5.1.2. Private Organizations
- 5.1.3. Mining & Energy Companies
- 5.1.4. Oil & Gas Companies
- 5.1.5. Other
- 5.2. Market Analysis, Insights and Forecast - by Types
- 5.2.1. Capital
- 5.2.2. Coastal Protection
- 5.2.3. Maintenance
- 5.2.4. Rivers & Lakes
- 5.3. Market Analysis, Insights and Forecast - by Region
- 5.3.1. North America
- 5.3.2. South America
- 5.3.3. Europe
- 5.3.4. Middle East & Africa
- 5.3.5. Asia Pacific
- 5.1. Market Analysis, Insights and Forecast - by Application
- 6. North America Harbour Dredging Analysis, Insights and Forecast, 2020-2032
- 6.1. Market Analysis, Insights and Forecast - by Application
- 6.1.1. Government Organizations
- 6.1.2. Private Organizations
- 6.1.3. Mining & Energy Companies
- 6.1.4. Oil & Gas Companies
- 6.1.5. Other
- 6.2. Market Analysis, Insights and Forecast - by Types
- 6.2.1. Capital
- 6.2.2. Coastal Protection
- 6.2.3. Maintenance
- 6.2.4. Rivers & Lakes
- 6.1. Market Analysis, Insights and Forecast - by Application
- 7. South America Harbour Dredging Analysis, Insights and Forecast, 2020-2032
- 7.1. Market Analysis, Insights and Forecast - by Application
- 7.1.1. Government Organizations
- 7.1.2. Private Organizations
- 7.1.3. Mining & Energy Companies
- 7.1.4. Oil & Gas Companies
- 7.1.5. Other
- 7.2. Market Analysis, Insights and Forecast - by Types
- 7.2.1. Capital
- 7.2.2. Coastal Protection
- 7.2.3. Maintenance
- 7.2.4. Rivers & Lakes
- 7.1. Market Analysis, Insights and Forecast - by Application
- 8. Europe Harbour Dredging Analysis, Insights and Forecast, 2020-2032
- 8.1. Market Analysis, Insights and Forecast - by Application
- 8.1.1. Government Organizations
- 8.1.2. Private Organizations
- 8.1.3. Mining & Energy Companies
- 8.1.4. Oil & Gas Companies
- 8.1.5. Other
- 8.2. Market Analysis, Insights and Forecast - by Types
- 8.2.1. Capital
- 8.2.2. Coastal Protection
- 8.2.3. Maintenance
- 8.2.4. Rivers & Lakes
- 8.1. Market Analysis, Insights and Forecast - by Application
- 9. Middle East & Africa Harbour Dredging Analysis, Insights and Forecast, 2020-2032
- 9.1. Market Analysis, Insights and Forecast - by Application
- 9.1.1. Government Organizations
- 9.1.2. Private Organizations
- 9.1.3. Mining & Energy Companies
- 9.1.4. Oil & Gas Companies
- 9.1.5. Other
- 9.2. Market Analysis, Insights and Forecast - by Types
- 9.2.1. Capital
- 9.2.2. Coastal Protection
- 9.2.3. Maintenance
- 9.2.4. Rivers & Lakes
- 9.1. Market Analysis, Insights and Forecast - by Application
- 10. Asia Pacific Harbour Dredging Analysis, Insights and Forecast, 2020-2032
- 10.1. Market Analysis, Insights and Forecast - by Application
- 10.1.1. Government Organizations
- 10.1.2. Private Organizations
- 10.1.3. Mining & Energy Companies
- 10.1.4. Oil & Gas Companies
- 10.1.5. Other
- 10.2. Market Analysis, Insights and Forecast - by Types
- 10.2.1. Capital
- 10.2.2. Coastal Protection
- 10.2.3. Maintenance
- 10.2.4. Rivers & Lakes
- 10.1. Market Analysis, Insights and Forecast - by Application
- 11. Competitive Analysis
- 11.1. Global Market Share Analysis 2025
- 11.2. Company Profiles
- 11.2.1 Boskalis
- 11.2.1.1. Overview
- 11.2.1.2. Products
- 11.2.1.3. SWOT Analysis
- 11.2.1.4. Recent Developments
- 11.2.1.5. Financials (Based on Availability)
- 11.2.2 Van Oord
- 11.2.2.1. Overview
- 11.2.2.2. Products
- 11.2.2.3. SWOT Analysis
- 11.2.2.4. Recent Developments
- 11.2.2.5. Financials (Based on Availability)
- 11.2.3 Jan De Nul Group
- 11.2.3.1. Overview
- 11.2.3.2. Products
- 11.2.3.3. SWOT Analysis
- 11.2.3.4. Recent Developments
- 11.2.3.5. Financials (Based on Availability)
- 11.2.4 DEME
- 11.2.4.1. Overview
- 11.2.4.2. Products
- 11.2.4.3. SWOT Analysis
- 11.2.4.4. Recent Developments
- 11.2.4.5. Financials (Based on Availability)
- 11.2.5 Hyundai Engineering & Construction
- 11.2.5.1. Overview
- 11.2.5.2. Products
- 11.2.5.3. SWOT Analysis
- 11.2.5.4. Recent Developments
- 11.2.5.5. Financials (Based on Availability)
- 11.2.6 Penta Ocean Construction
- 11.2.6.1. Overview
- 11.2.6.2. Products
- 11.2.6.3. SWOT Analysis
- 11.2.6.4. Recent Developments
- 11.2.6.5. Financials (Based on Availability)
- 11.2.7 China Harbor Engineering
- 11.2.7.1. Overview
- 11.2.7.2. Products
- 11.2.7.3. SWOT Analysis
- 11.2.7.4. Recent Developments
- 11.2.7.5. Financials (Based on Availability)
- 11.2.8 Great Lakes Dredge & Dock
- 11.2.8.1. Overview
- 11.2.8.2. Products
- 11.2.8.3. SWOT Analysis
- 11.2.8.4. Recent Developments
- 11.2.8.5. Financials (Based on Availability)
- 11.2.9 Toa Corporation
- 11.2.9.1. Overview
- 11.2.9.2. Products
- 11.2.9.3. SWOT Analysis
- 11.2.9.4. Recent Developments
- 11.2.9.5. Financials (Based on Availability)
- 11.2.1 Boskalis
List of Figures
- Figure 1: Global Harbour Dredging Revenue Breakdown (billion, %) by Region 2025 & 2033
- Figure 2: North America Harbour Dredging Revenue (billion), by Application 2025 & 2033
- Figure 3: North America Harbour Dredging Revenue Share (%), by Application 2025 & 2033
- Figure 4: North America Harbour Dredging Revenue (billion), by Types 2025 & 2033
- Figure 5: North America Harbour Dredging Revenue Share (%), by Types 2025 & 2033
- Figure 6: North America Harbour Dredging Revenue (billion), by Country 2025 & 2033
- Figure 7: North America Harbour Dredging Revenue Share (%), by Country 2025 & 2033
- Figure 8: South America Harbour Dredging Revenue (billion), by Application 2025 & 2033
- Figure 9: South America Harbour Dredging Revenue Share (%), by Application 2025 & 2033
- Figure 10: South America Harbour Dredging Revenue (billion), by Types 2025 & 2033
- Figure 11: South America Harbour Dredging Revenue Share (%), by Types 2025 & 2033
- Figure 12: South America Harbour Dredging Revenue (billion), by Country 2025 & 2033
- Figure 13: South America Harbour Dredging Revenue Share (%), by Country 2025 & 2033
- Figure 14: Europe Harbour Dredging Revenue (billion), by Application 2025 & 2033
- Figure 15: Europe Harbour Dredging Revenue Share (%), by Application 2025 & 2033
- Figure 16: Europe Harbour Dredging Revenue (billion), by Types 2025 & 2033
- Figure 17: Europe Harbour Dredging Revenue Share (%), by Types 2025 & 2033
- Figure 18: Europe Harbour Dredging Revenue (billion), by Country 2025 & 2033
- Figure 19: Europe Harbour Dredging Revenue Share (%), by Country 2025 & 2033
- Figure 20: Middle East & Africa Harbour Dredging Revenue (billion), by Application 2025 & 2033
- Figure 21: Middle East & Africa Harbour Dredging Revenue Share (%), by Application 2025 & 2033
- Figure 22: Middle East & Africa Harbour Dredging Revenue (billion), by Types 2025 & 2033
- Figure 23: Middle East & Africa Harbour Dredging Revenue Share (%), by Types 2025 & 2033
- Figure 24: Middle East & Africa Harbour Dredging Revenue (billion), by Country 2025 & 2033
- Figure 25: Middle East & Africa Harbour Dredging Revenue Share (%), by Country 2025 & 2033
- Figure 26: Asia Pacific Harbour Dredging Revenue (billion), by Application 2025 & 2033
- Figure 27: Asia Pacific Harbour Dredging Revenue Share (%), by Application 2025 & 2033
- Figure 28: Asia Pacific Harbour Dredging Revenue (billion), by Types 2025 & 2033
- Figure 29: Asia Pacific Harbour Dredging Revenue Share (%), by Types 2025 & 2033
- Figure 30: Asia Pacific Harbour Dredging Revenue (billion), by Country 2025 & 2033
- Figure 31: Asia Pacific Harbour Dredging Revenue Share (%), by Country 2025 & 2033
List of Tables
- Table 1: Global Harbour Dredging Revenue billion Forecast, by Application 2020 & 2033
- Table 2: Global Harbour Dredging Revenue billion Forecast, by Types 2020 & 2033
- Table 3: Global Harbour Dredging Revenue billion Forecast, by Region 2020 & 2033
- Table 4: Global Harbour Dredging Revenue billion Forecast, by Application 2020 & 2033
- Table 5: Global Harbour Dredging Revenue billion Forecast, by Types 2020 & 2033
- Table 6: Global Harbour Dredging Revenue billion Forecast, by Country 2020 & 2033
- Table 7: United States Harbour Dredging Revenue (billion) Forecast, by Application 2020 & 2033
- Table 8: Canada Harbour Dredging Revenue (billion) Forecast, by Application 2020 & 2033
- Table 9: Mexico Harbour Dredging Revenue (billion) Forecast, by Application 2020 & 2033
- Table 10: Global Harbour Dredging Revenue billion Forecast, by Application 2020 & 2033
- Table 11: Global Harbour Dredging Revenue billion Forecast, by Types 2020 & 2033
- Table 12: Global Harbour Dredging Revenue billion Forecast, by Country 2020 & 2033
- Table 13: Brazil Harbour Dredging Revenue (billion) Forecast, by Application 2020 & 2033
- Table 14: Argentina Harbour Dredging Revenue (billion) Forecast, by Application 2020 & 2033
- Table 15: Rest of South America Harbour Dredging Revenue (billion) Forecast, by Application 2020 & 2033
- Table 16: Global Harbour Dredging Revenue billion Forecast, by Application 2020 & 2033
- Table 17: Global Harbour Dredging Revenue billion Forecast, by Types 2020 & 2033
- Table 18: Global Harbour Dredging Revenue billion Forecast, by Country 2020 & 2033
- Table 19: United Kingdom Harbour Dredging Revenue (billion) Forecast, by Application 2020 & 2033
- Table 20: Germany Harbour Dredging Revenue (billion) Forecast, by Application 2020 & 2033
- Table 21: France Harbour Dredging Revenue (billion) Forecast, by Application 2020 & 2033
- Table 22: Italy Harbour Dredging Revenue (billion) Forecast, by Application 2020 & 2033
- Table 23: Spain Harbour Dredging Revenue (billion) Forecast, by Application 2020 & 2033
- Table 24: Russia Harbour Dredging Revenue (billion) Forecast, by Application 2020 & 2033
- Table 25: Benelux Harbour Dredging Revenue (billion) Forecast, by Application 2020 & 2033
- Table 26: Nordics Harbour Dredging Revenue (billion) Forecast, by Application 2020 & 2033
- Table 27: Rest of Europe Harbour Dredging Revenue (billion) Forecast, by Application 2020 & 2033
- Table 28: Global Harbour Dredging Revenue billion Forecast, by Application 2020 & 2033
- Table 29: Global Harbour Dredging Revenue billion Forecast, by Types 2020 & 2033
- Table 30: Global Harbour Dredging Revenue billion Forecast, by Country 2020 & 2033
- Table 31: Turkey Harbour Dredging Revenue (billion) Forecast, by Application 2020 & 2033
- Table 32: Israel Harbour Dredging Revenue (billion) Forecast, by Application 2020 & 2033
- Table 33: GCC Harbour Dredging Revenue (billion) Forecast, by Application 2020 & 2033
- Table 34: North Africa Harbour Dredging Revenue (billion) Forecast, by Application 2020 & 2033
- Table 35: South Africa Harbour Dredging Revenue (billion) Forecast, by Application 2020 & 2033
- Table 36: Rest of Middle East & Africa Harbour Dredging Revenue (billion) Forecast, by Application 2020 & 2033
- Table 37: Global Harbour Dredging Revenue billion Forecast, by Application 2020 & 2033
- Table 38: Global Harbour Dredging Revenue billion Forecast, by Types 2020 & 2033
- Table 39: Global Harbour Dredging Revenue billion Forecast, by Country 2020 & 2033
- Table 40: China Harbour Dredging Revenue (billion) Forecast, by Application 2020 & 2033
- Table 41: India Harbour Dredging Revenue (billion) Forecast, by Application 2020 & 2033
- Table 42: Japan Harbour Dredging Revenue (billion) Forecast, by Application 2020 & 2033
- Table 43: South Korea Harbour Dredging Revenue (billion) Forecast, by Application 2020 & 2033
- Table 44: ASEAN Harbour Dredging Revenue (billion) Forecast, by Application 2020 & 2033
- Table 45: Oceania Harbour Dredging Revenue (billion) Forecast, by Application 2020 & 2033
- Table 46: Rest of Asia Pacific Harbour Dredging Revenue (billion) Forecast, by Application 2020 & 2033
Frequently Asked Questions
1. What is the projected Compound Annual Growth Rate (CAGR) of the Harbour Dredging?
The projected CAGR is approximately 2.65%.
2. Which companies are prominent players in the Harbour Dredging?
Key companies in the market include Boskalis, Van Oord, Jan De Nul Group, DEME, Hyundai Engineering & Construction, Penta Ocean Construction, China Harbor Engineering, Great Lakes Dredge & Dock, Toa Corporation.
3. What are the main segments of the Harbour Dredging?
The market segments include Application, Types.
4. Can you provide details about the market size?
The market size is estimated to be USD 11.16 billion as of 2022.
5. What are some drivers contributing to market growth?
N/A
6. What are the notable trends driving market growth?
N/A
7. Are there any restraints impacting market growth?
N/A
8. Can you provide examples of recent developments in the market?
N/A
9. What pricing options are available for accessing the report?
Pricing options include single-user, multi-user, and enterprise licenses priced at USD 4900.00, USD 7350.00, and USD 9800.00 respectively.
10. Is the market size provided in terms of value or volume?
The market size is provided in terms of value, measured in billion.
11. Are there any specific market keywords associated with the report?
Yes, the market keyword associated with the report is "Harbour Dredging," which aids in identifying and referencing the specific market segment covered.
12. How do I determine which pricing option suits my needs best?
The pricing options vary based on user requirements and access needs. Individual users may opt for single-user licenses, while businesses requiring broader access may choose multi-user or enterprise licenses for cost-effective access to the report.
13. Are there any additional resources or data provided in the Harbour Dredging report?
While the report offers comprehensive insights, it's advisable to review the specific contents or supplementary materials provided to ascertain if additional resources or data are available.
14. How can I stay updated on further developments or reports in the Harbour Dredging?
To stay informed about further developments, trends, and reports in the Harbour Dredging, consider subscribing to industry newsletters, following relevant companies and organizations, or regularly checking reputable industry news sources and publications.
Methodology
Step 1 - Identification of Relevant Samples Size from Population Database


Step 2 - Approaches for Defining Global Market Size (Value, Volume* & Price*)

Note*: In applicable scenarios
Step 3 - Data Sources
Primary Research
- Web Analytics
- Survey Reports
- Research Institute
- Latest Research Reports
- Opinion Leaders
Secondary Research
- Annual Reports
- White Paper
- Latest Press Release
- Industry Association
- Paid Database
- Investor Presentations

Step 4 - Data Triangulation
Involves using different sources of information in order to increase the validity of a study
These sources are likely to be stakeholders in a program - participants, other researchers, program staff, other community members, and so on.
Then we put all data in single framework & apply various statistical tools to find out the dynamic on the market.
During the analysis stage, feedback from the stakeholder groups would be compared to determine areas of agreement as well as areas of divergence