

Key Insights
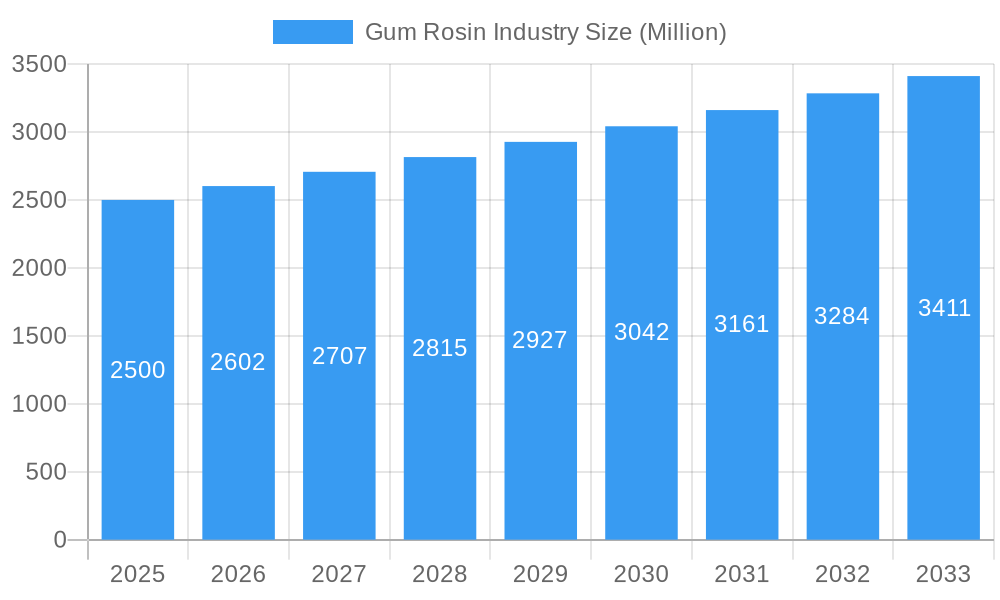
The global Gum Rosin market, projected to reach 2632.6 million by 2025, is forecasted to grow at a Compound Annual Growth Rate (CAGR) of 4.4% from 2025 to 2033. Key growth drivers include escalating demand from paper sizing, printing inks, adhesives, sealants, paints, and coatings. Expanding global populations, increased construction, packaging, and printing activities are significantly contributing to this expansion. Innovations in rosin derivatives are also propelling market growth with higher-performing and sustainable product development. However, raw material price volatility and the rise of synthetic alternatives present market challenges. The Asia-Pacific region, particularly China and India, is anticipated to lead market growth due to strong economic expansion and manufacturing sectors. Mature markets in North America and Europe will continue to be significant contributors, supported by established industries and consistent demand. The competitive landscape features a mix of established and regional producers, influencing pricing and product innovation.
Gum Rosin Industry Market Size (In Billion)
Sustained market expansion for Gum Rosin necessitates continued investment in research and development to create innovative, industry-specific products. Collaborative efforts to optimize supply chains and minimize environmental impact are crucial for long-term success. Sustainable raw material sourcing and eco-friendly manufacturing processes will enhance the industry's reputation and appeal to environmentally conscious stakeholders. Effectively addressing competition from synthetic substitutes requires emphasizing Gum Rosin's inherent advantages, such as biodegradability and unique functional properties. Adaptability to market shifts and a commitment to innovation and sustainability are paramount for market players.
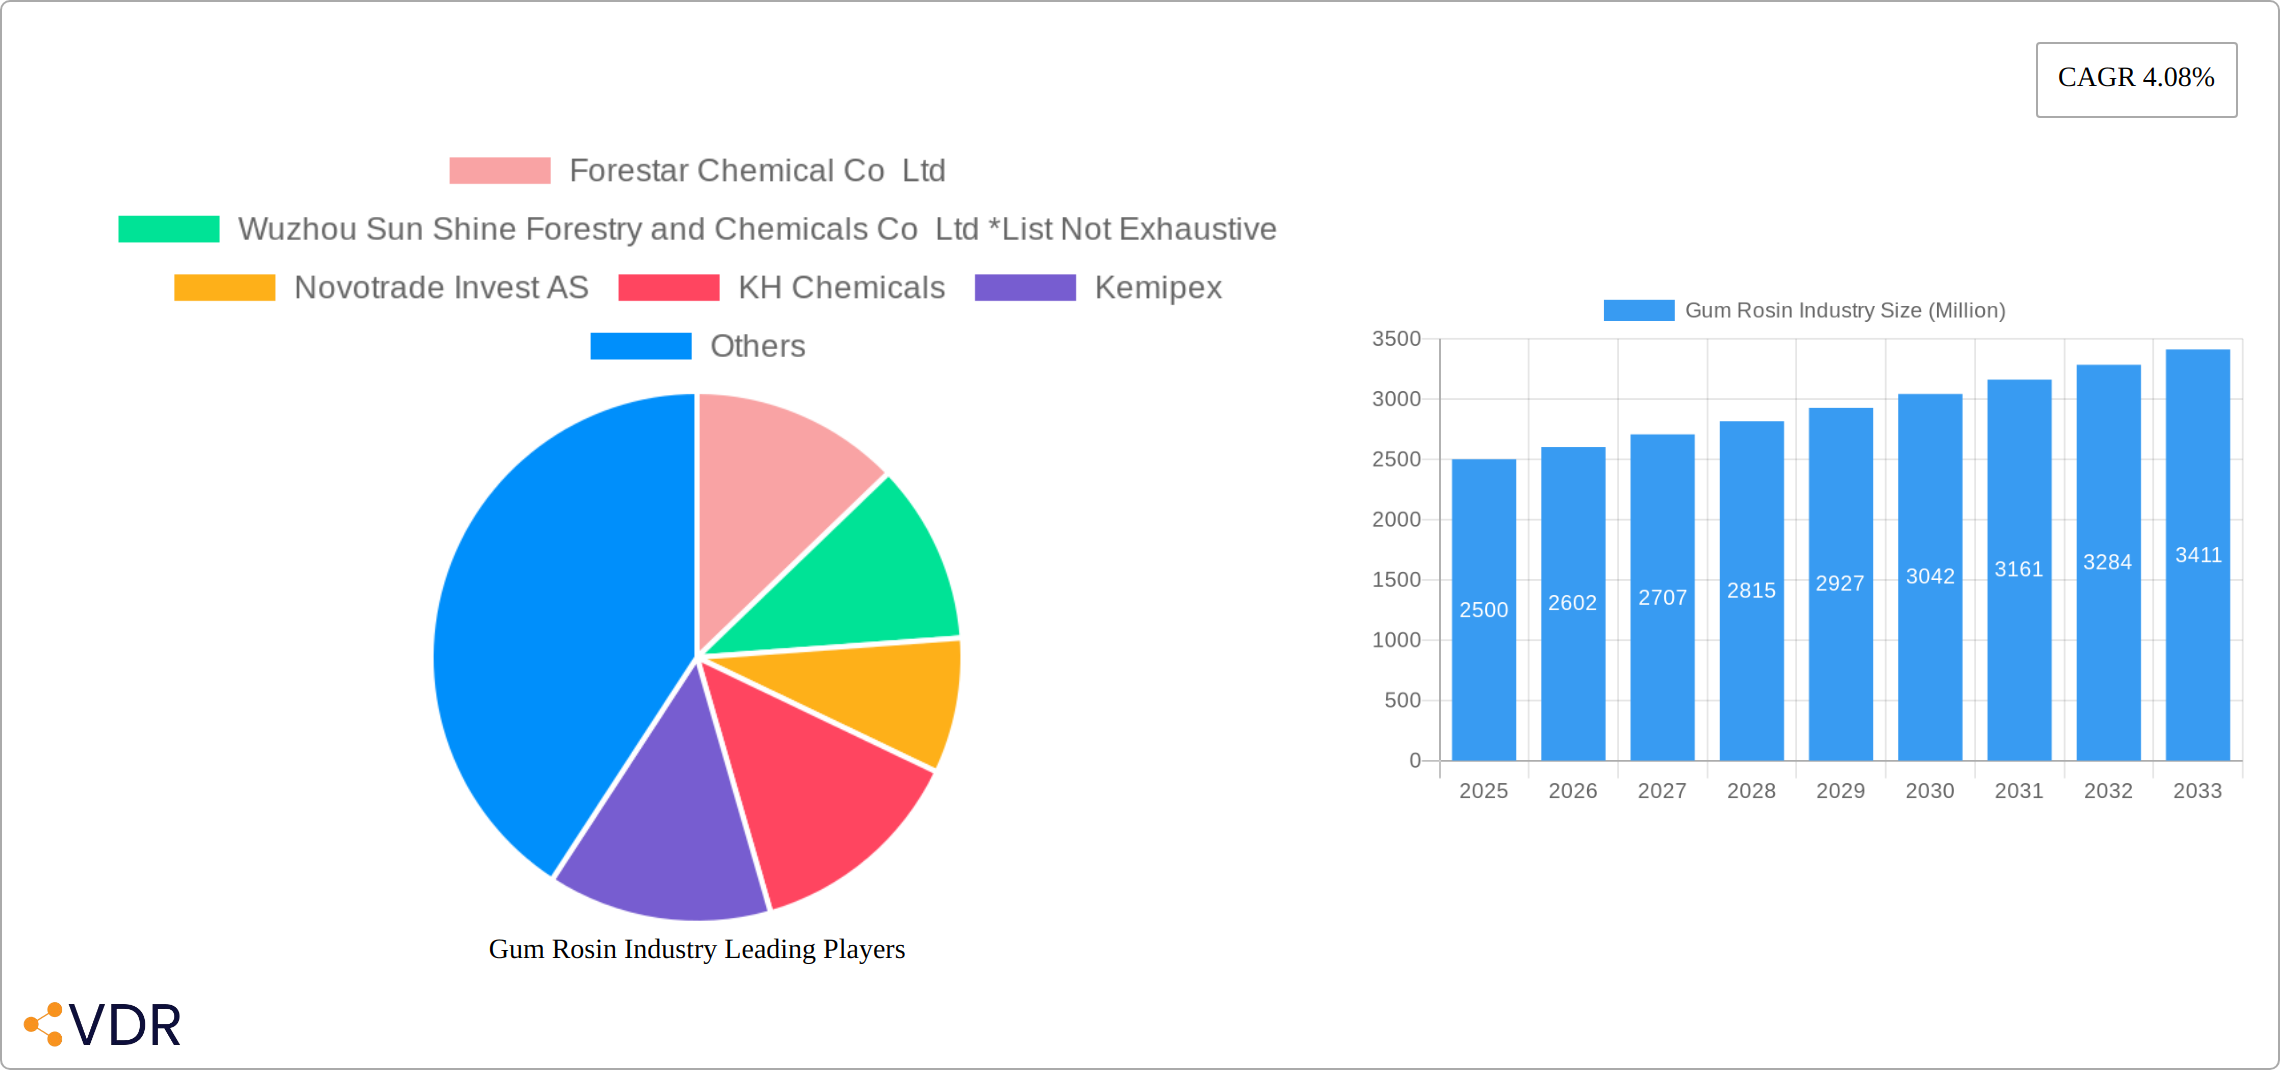
Gum Rosin Industry Company Market Share
This report offers a comprehensive analysis of the Gum Rosin industry, covering market dynamics, growth trends, regional insights, competitive landscape, and future projections. Focusing on segments including Paper Sizing, Printing Ink, Adhesives & Sealants, Rubber, Paints & Coatings, and Other Applications, this study serves as a vital resource for industry professionals, investors, and strategists. The analysis spans from 2019-2033, with 2025 serving as the base year for the 2025-2033 forecast period.
Gum Rosin Industry Market Dynamics & Structure
The Gum Rosin market, a sector valued at [Insert Updated Market Value in Millions for 2024] in 2024, presents a moderately concentrated market structure. Several key players command significant market share, though the exact level of concentration warrants further specification (e.g., Herfindahl-Hirschman Index). Technological innovation is a crucial driver, with a strong emphasis on sustainable rosin production methods, improved performance characteristics tailored to specific end-use applications, and the development of bio-based alternatives. Stringent environmental regulations, particularly those concerning volatile organic compounds (VOCs) and the increasing focus on circular economy principles, continue to influence product formulations, manufacturing processes, and the overall sustainability profile of the industry. Competition from synthetic resins remains a significant factor, impacting pricing strategies and market share distribution among industry participants. End-user demand is evolving, with a notable shift towards specialized applications within rapidly expanding sectors such as renewable energy, advanced composites, and high-performance coatings. Mergers and acquisitions (M&A) activity has shown moderate levels of activity, often reflecting strategies for resource consolidation, geographical expansion, and technological capability enhancement.
- Market Concentration: [Insert Updated Market Concentration Data with supporting source/index - e.g., High (x%), with top 5 players holding y% market share in 2024. Source: [Citation]]
- Technological Innovation: Focus on bio-based resins, improved performance additives (e.g., enhanced tack, adhesion, water resistance, UV resistance), and circular economy principles (e.g., rosin recycling and reuse).
- Regulatory Framework: Stringent environmental regulations, including VOC limits and sustainability certifications (e.g., REACH, ISO 14001), drive sustainable production methods and innovation in waste reduction.
- Competitive Substitutes: Synthetic resins, including petroleum-based and bio-based alternatives, pose a significant competitive challenge, demanding continuous innovation and value proposition development.
- M&A Trends: Moderate activity with a focus on consolidation, technological advancement, and expansion into new geographical markets or application areas. [Include examples if possible].
- Innovation Barriers: High R&D costs, lengthy regulatory approval processes for novel materials, and access to sustainable and traceable raw materials.
Gum Rosin Industry Growth Trends & Insights
The global Gum Rosin market experienced a CAGR of xx% during the historical period (2019-2024), reaching xx Million in 2024. This growth is attributed to increasing demand from key applications, particularly in the packaging and construction sectors. Technological advancements have led to improved product formulations with enhanced performance characteristics and sustainability. Consumer behavior shifts towards eco-friendly products are bolstering the demand for sustainably sourced rosin. The forecast period (2025-2033) projects continued growth, driven by expansion in emerging markets and the adoption of advanced applications. Market penetration in specific regions is expected to increase significantly, leading to an overall CAGR of xx% during the forecast period.
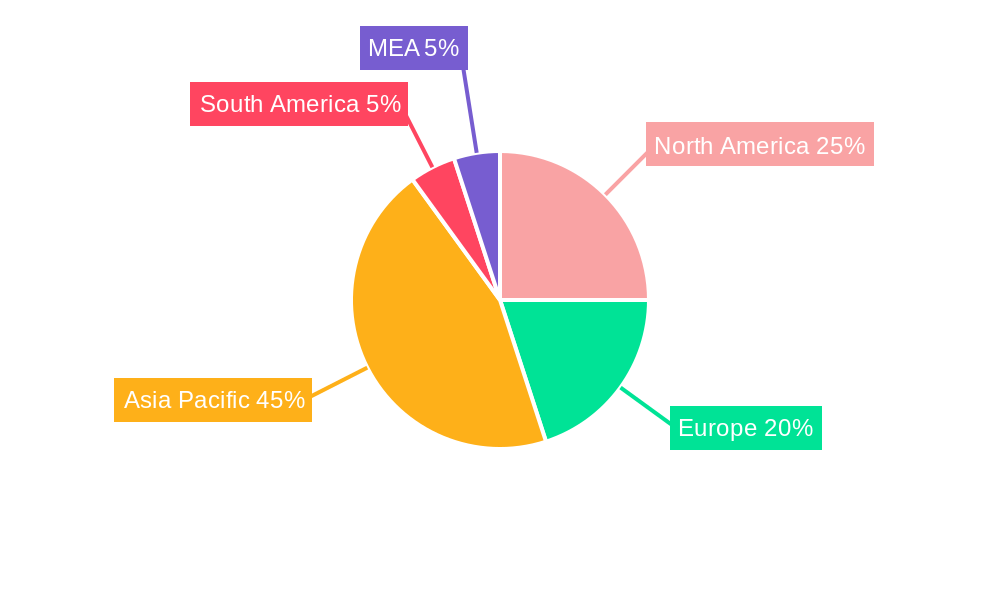
Dominant Regions, Countries, or Segments in Gum Rosin Industry
The Asia-Pacific region maintains its position as the dominant market for Gum Rosin, accounting for [Insert Updated Percentage] of the global market share in 2024. China and India remain key contributors, driven by their robust economic growth, expanding construction and packaging sectors, and large consumer base. However, growth is also observed in other regions, with specific drivers such as increased demand for sustainable materials in Europe and North America. The Paper Sizing segment continues to hold a substantial market share, though the relative proportions of various application segments (e.g., Adhesives & Sealants, Paints & Coatings, Specialty Chemicals) warrant further detail. Emerging applications are also worth noting (e.g., use in bio-based plastics or adhesives).
- Asia-Pacific: High growth driven by economic expansion, industrialization, and increasing demand for sustainable packaging solutions.
- North America: Stable growth with a focus on high-value specialty applications and increasing regulatory pressure to adopt sustainable alternatives.
- Europe: Moderate growth influenced by environmental regulations and demand for bio-based and sustainable materials. Increased focus on circular economy principles.
- Paper Sizing Segment: Largest market share, although potentially facing competition from alternative paper sizing agents.
- Adhesives and Sealants: Significant growth potential driven by construction, packaging, and renewable energy applications.
- [Add other significant segments]: [Describe other significant segments and their growth prospects]
Gum Rosin Industry Product Landscape
The Gum Rosin product landscape is diverse, encompassing various grades and modifications tailored to specific performance requirements. These include different viscosity grades, color specifications, and chemical modifications to enhance specific properties such as tack, adhesion, water resistance, and UV resistance. The emphasis on sustainability is driving innovation in eco-friendly production methods, including the utilization of recycled materials and waste reduction strategies. Manufacturers increasingly highlight unique selling propositions emphasizing improved performance, cost-effectiveness, and environmental compatibility through certifications and sustainability reports.
Key Drivers, Barriers & Challenges in Gum Rosin Industry
Key Drivers: Growing demand from packaging and construction industries, technological advancements in rosin derivatives, and increasing awareness of sustainable materials.
Challenges: Fluctuations in raw material prices, environmental regulations limiting certain applications, and competition from synthetic resin substitutes. Supply chain disruptions have caused price volatility, impacting profitability. Stringent environmental regulations add to manufacturing costs.
Emerging Opportunities in Gum Rosin Industry
Untapped markets in developing economies present significant growth opportunities. Innovative applications in bio-based composites and adhesives are emerging. Evolving consumer preferences toward sustainable and eco-friendly products drive demand for sustainably sourced rosin.
Growth Accelerators in the Gum Rosin Industry Industry
Technological advancements in rosin modification and processing are key growth catalysts. Strategic partnerships between rosin producers and downstream users facilitate market expansion and innovation. Aggressive market expansion strategies targeting high-growth regions contribute to growth acceleration.
Key Players Shaping the Gum Rosin Industry Market
- Forestar Chemical Co Ltd
- Wuzhou Sun Shine Forestry and Chemicals Co Ltd
- Novotrade Invest AS
- KH Chemicals
- Kemipex
- PT INDOPICRI ( Indonesia Pine Chemical Industri )
- Harima Chemicals Group Inc
- Guangxi Dinghong Resin Co Ltd
- Finjetchemical Co Ltd
- Silver Fern Chemical Inc
- Guangxi Tone Resin Chemical Co Ltd
- United Resins
- Foreverest Resources Ltd
- Arakawa Chemical Industries Ltd
- DRT (Dérivés Résiniques et Terpéniques)
- [Add other relevant key players]
Notable Milestones in Gum Rosin Industry Sector
- 2021-Q3: Introduction of a new bio-based rosin by [Company Name].
- 2022-Q1: Acquisition of [Company A] by [Company B].
- 2023-Q2: Launch of a sustainable rosin production facility in [Location].
In-Depth Gum Rosin Industry Market Outlook
The Gum Rosin market is poised for continued growth, driven by a combination of factors, including increasing demand from key applications, technological advancements leading to improved product formulations, and a greater focus on sustainable and eco-friendly options. Strategic partnerships and market expansions will play a crucial role in shaping the future of this dynamic industry. The market is expected to reach xx Million by 2033.
Gum Rosin Industry Segmentation
-
1. Application
- 1.1. Paper Sizing
- 1.2. Printing Ink
- 1.3. Adhesives and Sealants
- 1.4. Rubber
- 1.5. Paints and Coatings
- 1.6. Other Applications
Gum Rosin Industry Segmentation By Geography
-
1. Asia Pacific
- 1.1. China
- 1.2. India
- 1.3. Japan
- 1.4. South Korea
- 1.5. Rest of Asia Pacific
-
2. North America
- 2.1. United States
- 2.2. Canada
- 2.3. Mexico
-
3. Europe
- 3.1. Germany
- 3.2. United Kingdom
- 3.3. Italy
- 3.4. France
- 3.5. Rest of Europe
-
4. South America
- 4.1. Brazil
- 4.2. Argentina
- 4.3. Rest of South America
-
5. Middle East and Africa
- 5.1. Saudi Arabia
- 5.2. South Africa
- 5.3. Rest of Middle East and Africa
Gum Rosin Industry Regional Market Share
Geographic Coverage of Gum Rosin Industry
Gum Rosin Industry REPORT HIGHLIGHTS
| Aspects | Details |
|---|---|
| Study Period | 2020-2034 |
| Base Year | 2025 |
| Estimated Year | 2026 |
| Forecast Period | 2026-2034 |
| Historical Period | 2020-2025 |
| Growth Rate | CAGR of 4.4% from 2020-2034 |
| Segmentation |
|
Table of Contents
- 1. Introduction
- 1.1. Research Scope
- 1.2. Market Segmentation
- 1.3. Research Objective
- 1.4. Definitions and Assumptions
- 2. Executive Summary
- 2.1. Market Snapshot
- 3. Market Dynamics
- 3.1. Market Drivers
- 3.2. Market Restrains
- 3.3. Market Trends
- 3.4. Market Opportunities
- 4. Market Factor Analysis
- 4.1. Porters Five Forces
- 4.1.1. Bargaining Power of Suppliers
- 4.1.2. Bargaining Power of Buyers
- 4.1.3. Threat of New Entrants
- 4.1.4. Threat of Substitutes
- 4.1.5. Competitive Rivalry
- 4.2. PESTEL analysis
- 4.3. BCG Analysis
- 4.3.1. Stars (High Growth, High Market Share)
- 4.3.2. Cash Cows (Low Growth, High Market Share)
- 4.3.3. Question Mark (High Growth, Low Market Share)
- 4.3.4. Dogs (Low Growth, Low Market Share)
- 4.4. Ansoff Matrix Analysis
- 4.5. Supply Chain Analysis
- 4.6. Regulatory Landscape
- 4.7. Current Market Potential and Opportunity Assessment (TAM–SAM–SOM Framework)
- 4.8. VDR Analyst Note
- 4.1. Porters Five Forces
- 5. Market Analysis, Insights and Forecast 2021-2033
- 5.1. Market Analysis, Insights and Forecast - by Application
- 5.1.1. Paper Sizing
- 5.1.2. Printing Ink
- 5.1.3. Adhesives and Sealants
- 5.1.4. Rubber
- 5.1.5. Paints and Coatings
- 5.1.6. Other Applications
- 5.2. Market Analysis, Insights and Forecast - by Region
- 5.2.1. Asia Pacific
- 5.2.2. North America
- 5.2.3. Europe
- 5.2.4. South America
- 5.2.5. Middle East and Africa
- 5.1. Market Analysis, Insights and Forecast - by Application
- 6. Global Gum Rosin Industry Analysis, Insights and Forecast, 2021-2033
- 6.1. Market Analysis, Insights and Forecast - by Application
- 6.1.1. Paper Sizing
- 6.1.2. Printing Ink
- 6.1.3. Adhesives and Sealants
- 6.1.4. Rubber
- 6.1.5. Paints and Coatings
- 6.1.6. Other Applications
- 6.1. Market Analysis, Insights and Forecast - by Application
- 7. Asia Pacific Gum Rosin Industry Analysis, Insights and Forecast, 2021-2033
- 7.1. Market Analysis, Insights and Forecast - by Application
- 7.1.1. Paper Sizing
- 7.1.2. Printing Ink
- 7.1.3. Adhesives and Sealants
- 7.1.4. Rubber
- 7.1.5. Paints and Coatings
- 7.1.6. Other Applications
- 7.1. Market Analysis, Insights and Forecast - by Application
- 8. North America Gum Rosin Industry Analysis, Insights and Forecast, 2021-2033
- 8.1. Market Analysis, Insights and Forecast - by Application
- 8.1.1. Paper Sizing
- 8.1.2. Printing Ink
- 8.1.3. Adhesives and Sealants
- 8.1.4. Rubber
- 8.1.5. Paints and Coatings
- 8.1.6. Other Applications
- 8.1. Market Analysis, Insights and Forecast - by Application
- 9. Europe Gum Rosin Industry Analysis, Insights and Forecast, 2021-2033
- 9.1. Market Analysis, Insights and Forecast - by Application
- 9.1.1. Paper Sizing
- 9.1.2. Printing Ink
- 9.1.3. Adhesives and Sealants
- 9.1.4. Rubber
- 9.1.5. Paints and Coatings
- 9.1.6. Other Applications
- 9.1. Market Analysis, Insights and Forecast - by Application
- 10. South America Gum Rosin Industry Analysis, Insights and Forecast, 2021-2033
- 10.1. Market Analysis, Insights and Forecast - by Application
- 10.1.1. Paper Sizing
- 10.1.2. Printing Ink
- 10.1.3. Adhesives and Sealants
- 10.1.4. Rubber
- 10.1.5. Paints and Coatings
- 10.1.6. Other Applications
- 10.1. Market Analysis, Insights and Forecast - by Application
- 11. Middle East and Africa Gum Rosin Industry Analysis, Insights and Forecast, 2021-2033
- 11.1. Market Analysis, Insights and Forecast - by Application
- 11.1.1. Paper Sizing
- 11.1.2. Printing Ink
- 11.1.3. Adhesives and Sealants
- 11.1.4. Rubber
- 11.1.5. Paints and Coatings
- 11.1.6. Other Applications
- 11.1. Market Analysis, Insights and Forecast - by Application
- 12. Competitive Analysis
- 12.1. Company Profiles
- 12.1.1 Forestar Chemical Co Ltd
- 12.1.1.1. Company Overview
- 12.1.1.2. Products
- 12.1.1.3. Company Financials
- 12.1.1.4. SWOT Analysis
- 12.1.2 Wuzhou Sun Shine Forestry and Chemicals Co Ltd *List Not Exhaustive
- 12.1.2.1. Company Overview
- 12.1.2.2. Products
- 12.1.2.3. Company Financials
- 12.1.2.4. SWOT Analysis
- 12.1.3 Novotrade Invest AS
- 12.1.3.1. Company Overview
- 12.1.3.2. Products
- 12.1.3.3. Company Financials
- 12.1.3.4. SWOT Analysis
- 12.1.4 KH Chemicals
- 12.1.4.1. Company Overview
- 12.1.4.2. Products
- 12.1.4.3. Company Financials
- 12.1.4.4. SWOT Analysis
- 12.1.5 Kemipex
- 12.1.5.1. Company Overview
- 12.1.5.2. Products
- 12.1.5.3. Company Financials
- 12.1.5.4. SWOT Analysis
- 12.1.6 PT INDOPICRI ( Indonesia Pine Chemical Industri )
- 12.1.6.1. Company Overview
- 12.1.6.2. Products
- 12.1.6.3. Company Financials
- 12.1.6.4. SWOT Analysis
- 12.1.7 Harima Chemicals Group Inc
- 12.1.7.1. Company Overview
- 12.1.7.2. Products
- 12.1.7.3. Company Financials
- 12.1.7.4. SWOT Analysis
- 12.1.8 Guangxi Dinghong Resin Co Ltd
- 12.1.8.1. Company Overview
- 12.1.8.2. Products
- 12.1.8.3. Company Financials
- 12.1.8.4. SWOT Analysis
- 12.1.9 Finjetchemical Co Ltd
- 12.1.9.1. Company Overview
- 12.1.9.2. Products
- 12.1.9.3. Company Financials
- 12.1.9.4. SWOT Analysis
- 12.1.10 Silver Fern Chemical Inc
- 12.1.10.1. Company Overview
- 12.1.10.2. Products
- 12.1.10.3. Company Financials
- 12.1.10.4. SWOT Analysis
- 12.1.11 Guangxi Tone Resin Chemical Co Ltd
- 12.1.11.1. Company Overview
- 12.1.11.2. Products
- 12.1.11.3. Company Financials
- 12.1.11.4. SWOT Analysis
- 12.1.12 United Resins
- 12.1.12.1. Company Overview
- 12.1.12.2. Products
- 12.1.12.3. Company Financials
- 12.1.12.4. SWOT Analysis
- 12.1.13 Foreverest Resources Ltd
- 12.1.13.1. Company Overview
- 12.1.13.2. Products
- 12.1.13.3. Company Financials
- 12.1.13.4. SWOT Analysis
- 12.1.14 Arakawa Chemical Industries Ltd
- 12.1.14.1. Company Overview
- 12.1.14.2. Products
- 12.1.14.3. Company Financials
- 12.1.14.4. SWOT Analysis
- 12.1.15 DRT (Dérivés Résiniques et Terpéniques)
- 12.1.15.1. Company Overview
- 12.1.15.2. Products
- 12.1.15.3. Company Financials
- 12.1.15.4. SWOT Analysis
- 12.1.1 Forestar Chemical Co Ltd
- 12.2. Market Entropy
- 12.2.1 Company's Key Areas Served
- 12.2.2 Recent Developments
- 12.3. Company Market Share Analysis 2025
- 12.3.1 Top 5 Companies Market Share Analysis
- 12.3.2 Top 3 Companies Market Share Analysis
- 12.4. List of Potential Customers
- 13. Research Methodology
List of Figures
- Figure 1: Global Gum Rosin Industry Revenue Breakdown (million, %) by Region 2025 & 2033
- Figure 2: Global Gum Rosin Industry Volume Breakdown (K Tons, %) by Region 2025 & 2033
- Figure 3: Asia Pacific Gum Rosin Industry Revenue (million), by Application 2025 & 2033
- Figure 4: Asia Pacific Gum Rosin Industry Volume (K Tons), by Application 2025 & 2033
- Figure 5: Asia Pacific Gum Rosin Industry Revenue Share (%), by Application 2025 & 2033
- Figure 6: Asia Pacific Gum Rosin Industry Volume Share (%), by Application 2025 & 2033
- Figure 7: Asia Pacific Gum Rosin Industry Revenue (million), by Country 2025 & 2033
- Figure 8: Asia Pacific Gum Rosin Industry Volume (K Tons), by Country 2025 & 2033
- Figure 9: Asia Pacific Gum Rosin Industry Revenue Share (%), by Country 2025 & 2033
- Figure 10: Asia Pacific Gum Rosin Industry Volume Share (%), by Country 2025 & 2033
- Figure 11: North America Gum Rosin Industry Revenue (million), by Application 2025 & 2033
- Figure 12: North America Gum Rosin Industry Volume (K Tons), by Application 2025 & 2033
- Figure 13: North America Gum Rosin Industry Revenue Share (%), by Application 2025 & 2033
- Figure 14: North America Gum Rosin Industry Volume Share (%), by Application 2025 & 2033
- Figure 15: North America Gum Rosin Industry Revenue (million), by Country 2025 & 2033
- Figure 16: North America Gum Rosin Industry Volume (K Tons), by Country 2025 & 2033
- Figure 17: North America Gum Rosin Industry Revenue Share (%), by Country 2025 & 2033
- Figure 18: North America Gum Rosin Industry Volume Share (%), by Country 2025 & 2033
- Figure 19: Europe Gum Rosin Industry Revenue (million), by Application 2025 & 2033
- Figure 20: Europe Gum Rosin Industry Volume (K Tons), by Application 2025 & 2033
- Figure 21: Europe Gum Rosin Industry Revenue Share (%), by Application 2025 & 2033
- Figure 22: Europe Gum Rosin Industry Volume Share (%), by Application 2025 & 2033
- Figure 23: Europe Gum Rosin Industry Revenue (million), by Country 2025 & 2033
- Figure 24: Europe Gum Rosin Industry Volume (K Tons), by Country 2025 & 2033
- Figure 25: Europe Gum Rosin Industry Revenue Share (%), by Country 2025 & 2033
- Figure 26: Europe Gum Rosin Industry Volume Share (%), by Country 2025 & 2033
- Figure 27: South America Gum Rosin Industry Revenue (million), by Application 2025 & 2033
- Figure 28: South America Gum Rosin Industry Volume (K Tons), by Application 2025 & 2033
- Figure 29: South America Gum Rosin Industry Revenue Share (%), by Application 2025 & 2033
- Figure 30: South America Gum Rosin Industry Volume Share (%), by Application 2025 & 2033
- Figure 31: South America Gum Rosin Industry Revenue (million), by Country 2025 & 2033
- Figure 32: South America Gum Rosin Industry Volume (K Tons), by Country 2025 & 2033
- Figure 33: South America Gum Rosin Industry Revenue Share (%), by Country 2025 & 2033
- Figure 34: South America Gum Rosin Industry Volume Share (%), by Country 2025 & 2033
- Figure 35: Middle East and Africa Gum Rosin Industry Revenue (million), by Application 2025 & 2033
- Figure 36: Middle East and Africa Gum Rosin Industry Volume (K Tons), by Application 2025 & 2033
- Figure 37: Middle East and Africa Gum Rosin Industry Revenue Share (%), by Application 2025 & 2033
- Figure 38: Middle East and Africa Gum Rosin Industry Volume Share (%), by Application 2025 & 2033
- Figure 39: Middle East and Africa Gum Rosin Industry Revenue (million), by Country 2025 & 2033
- Figure 40: Middle East and Africa Gum Rosin Industry Volume (K Tons), by Country 2025 & 2033
- Figure 41: Middle East and Africa Gum Rosin Industry Revenue Share (%), by Country 2025 & 2033
- Figure 42: Middle East and Africa Gum Rosin Industry Volume Share (%), by Country 2025 & 2033
List of Tables
- Table 1: Global Gum Rosin Industry Revenue million Forecast, by Application 2020 & 2033
- Table 2: Global Gum Rosin Industry Volume K Tons Forecast, by Application 2020 & 2033
- Table 3: Global Gum Rosin Industry Revenue million Forecast, by Region 2020 & 2033
- Table 4: Global Gum Rosin Industry Volume K Tons Forecast, by Region 2020 & 2033
- Table 5: Global Gum Rosin Industry Revenue million Forecast, by Application 2020 & 2033
- Table 6: Global Gum Rosin Industry Volume K Tons Forecast, by Application 2020 & 2033
- Table 7: Global Gum Rosin Industry Revenue million Forecast, by Country 2020 & 2033
- Table 8: Global Gum Rosin Industry Volume K Tons Forecast, by Country 2020 & 2033
- Table 9: China Gum Rosin Industry Revenue (million) Forecast, by Application 2020 & 2033
- Table 10: China Gum Rosin Industry Volume (K Tons) Forecast, by Application 2020 & 2033
- Table 11: India Gum Rosin Industry Revenue (million) Forecast, by Application 2020 & 2033
- Table 12: India Gum Rosin Industry Volume (K Tons) Forecast, by Application 2020 & 2033
- Table 13: Japan Gum Rosin Industry Revenue (million) Forecast, by Application 2020 & 2033
- Table 14: Japan Gum Rosin Industry Volume (K Tons) Forecast, by Application 2020 & 2033
- Table 15: South Korea Gum Rosin Industry Revenue (million) Forecast, by Application 2020 & 2033
- Table 16: South Korea Gum Rosin Industry Volume (K Tons) Forecast, by Application 2020 & 2033
- Table 17: Rest of Asia Pacific Gum Rosin Industry Revenue (million) Forecast, by Application 2020 & 2033
- Table 18: Rest of Asia Pacific Gum Rosin Industry Volume (K Tons) Forecast, by Application 2020 & 2033
- Table 19: Global Gum Rosin Industry Revenue million Forecast, by Application 2020 & 2033
- Table 20: Global Gum Rosin Industry Volume K Tons Forecast, by Application 2020 & 2033
- Table 21: Global Gum Rosin Industry Revenue million Forecast, by Country 2020 & 2033
- Table 22: Global Gum Rosin Industry Volume K Tons Forecast, by Country 2020 & 2033
- Table 23: United States Gum Rosin Industry Revenue (million) Forecast, by Application 2020 & 2033
- Table 24: United States Gum Rosin Industry Volume (K Tons) Forecast, by Application 2020 & 2033
- Table 25: Canada Gum Rosin Industry Revenue (million) Forecast, by Application 2020 & 2033
- Table 26: Canada Gum Rosin Industry Volume (K Tons) Forecast, by Application 2020 & 2033
- Table 27: Mexico Gum Rosin Industry Revenue (million) Forecast, by Application 2020 & 2033
- Table 28: Mexico Gum Rosin Industry Volume (K Tons) Forecast, by Application 2020 & 2033
- Table 29: Global Gum Rosin Industry Revenue million Forecast, by Application 2020 & 2033
- Table 30: Global Gum Rosin Industry Volume K Tons Forecast, by Application 2020 & 2033
- Table 31: Global Gum Rosin Industry Revenue million Forecast, by Country 2020 & 2033
- Table 32: Global Gum Rosin Industry Volume K Tons Forecast, by Country 2020 & 2033
- Table 33: Germany Gum Rosin Industry Revenue (million) Forecast, by Application 2020 & 2033
- Table 34: Germany Gum Rosin Industry Volume (K Tons) Forecast, by Application 2020 & 2033
- Table 35: United Kingdom Gum Rosin Industry Revenue (million) Forecast, by Application 2020 & 2033
- Table 36: United Kingdom Gum Rosin Industry Volume (K Tons) Forecast, by Application 2020 & 2033
- Table 37: Italy Gum Rosin Industry Revenue (million) Forecast, by Application 2020 & 2033
- Table 38: Italy Gum Rosin Industry Volume (K Tons) Forecast, by Application 2020 & 2033
- Table 39: France Gum Rosin Industry Revenue (million) Forecast, by Application 2020 & 2033
- Table 40: France Gum Rosin Industry Volume (K Tons) Forecast, by Application 2020 & 2033
- Table 41: Rest of Europe Gum Rosin Industry Revenue (million) Forecast, by Application 2020 & 2033
- Table 42: Rest of Europe Gum Rosin Industry Volume (K Tons) Forecast, by Application 2020 & 2033
- Table 43: Global Gum Rosin Industry Revenue million Forecast, by Application 2020 & 2033
- Table 44: Global Gum Rosin Industry Volume K Tons Forecast, by Application 2020 & 2033
- Table 45: Global Gum Rosin Industry Revenue million Forecast, by Country 2020 & 2033
- Table 46: Global Gum Rosin Industry Volume K Tons Forecast, by Country 2020 & 2033
- Table 47: Brazil Gum Rosin Industry Revenue (million) Forecast, by Application 2020 & 2033
- Table 48: Brazil Gum Rosin Industry Volume (K Tons) Forecast, by Application 2020 & 2033
- Table 49: Argentina Gum Rosin Industry Revenue (million) Forecast, by Application 2020 & 2033
- Table 50: Argentina Gum Rosin Industry Volume (K Tons) Forecast, by Application 2020 & 2033
- Table 51: Rest of South America Gum Rosin Industry Revenue (million) Forecast, by Application 2020 & 2033
- Table 52: Rest of South America Gum Rosin Industry Volume (K Tons) Forecast, by Application 2020 & 2033
- Table 53: Global Gum Rosin Industry Revenue million Forecast, by Application 2020 & 2033
- Table 54: Global Gum Rosin Industry Volume K Tons Forecast, by Application 2020 & 2033
- Table 55: Global Gum Rosin Industry Revenue million Forecast, by Country 2020 & 2033
- Table 56: Global Gum Rosin Industry Volume K Tons Forecast, by Country 2020 & 2033
- Table 57: Saudi Arabia Gum Rosin Industry Revenue (million) Forecast, by Application 2020 & 2033
- Table 58: Saudi Arabia Gum Rosin Industry Volume (K Tons) Forecast, by Application 2020 & 2033
- Table 59: South Africa Gum Rosin Industry Revenue (million) Forecast, by Application 2020 & 2033
- Table 60: South Africa Gum Rosin Industry Volume (K Tons) Forecast, by Application 2020 & 2033
- Table 61: Rest of Middle East and Africa Gum Rosin Industry Revenue (million) Forecast, by Application 2020 & 2033
- Table 62: Rest of Middle East and Africa Gum Rosin Industry Volume (K Tons) Forecast, by Application 2020 & 2033
Frequently Asked Questions
1. What is the projected Compound Annual Growth Rate (CAGR) of the Gum Rosin Industry?
The projected CAGR is approximately 4.4%.
2. Which companies are prominent players in the Gum Rosin Industry?
Key companies in the market include Forestar Chemical Co Ltd, Wuzhou Sun Shine Forestry and Chemicals Co Ltd *List Not Exhaustive, Novotrade Invest AS, KH Chemicals, Kemipex, PT INDOPICRI ( Indonesia Pine Chemical Industri ), Harima Chemicals Group Inc, Guangxi Dinghong Resin Co Ltd, Finjetchemical Co Ltd, Silver Fern Chemical Inc, Guangxi Tone Resin Chemical Co Ltd, United Resins, Foreverest Resources Ltd, Arakawa Chemical Industries Ltd, DRT (Dérivés Résiniques et Terpéniques).
3. What are the main segments of the Gum Rosin Industry?
The market segments include Application.
4. Can you provide details about the market size?
The market size is estimated to be USD 2632.6 million as of 2022.
5. What are some drivers contributing to market growth?
Growing Demand for Bio-based Adhesives and Sealants; Burgeoning Paper Packaging Industry; Other Drivers.
6. What are the notable trends driving market growth?
The Adhesives and Sealants Segment is Expected to Dominate the Market.
7. Are there any restraints impacting market growth?
Shift of Interest toward Tall Oil Rosin-based Phenolic Resins; Other Restraints.
8. Can you provide examples of recent developments in the market?
N/A
9. What pricing options are available for accessing the report?
Pricing options include single-user, multi-user, and enterprise licenses priced at USD 4750, USD 5250, and USD 8750 respectively.
10. Is the market size provided in terms of value or volume?
The market size is provided in terms of value, measured in million and volume, measured in K Tons.
11. Are there any specific market keywords associated with the report?
Yes, the market keyword associated with the report is "Gum Rosin Industry," which aids in identifying and referencing the specific market segment covered.
12. How do I determine which pricing option suits my needs best?
The pricing options vary based on user requirements and access needs. Individual users may opt for single-user licenses, while businesses requiring broader access may choose multi-user or enterprise licenses for cost-effective access to the report.
13. Are there any additional resources or data provided in the Gum Rosin Industry report?
While the report offers comprehensive insights, it's advisable to review the specific contents or supplementary materials provided to ascertain if additional resources or data are available.
14. How can I stay updated on further developments or reports in the Gum Rosin Industry?
To stay informed about further developments, trends, and reports in the Gum Rosin Industry, consider subscribing to industry newsletters, following relevant companies and organizations, or regularly checking reputable industry news sources and publications.
Methodology
Step 1 - Identification of Relevant Samples Size from Population Database


Step 2 - Approaches for Defining Global Market Size (Value, Volume* & Price*)

Note*: In applicable scenarios
Step 3 - Data Sources
Primary Research
- Web Analytics
- Survey Reports
- Research Institute
- Latest Research Reports
- Opinion Leaders
Secondary Research
- Annual Reports
- White Paper
- Latest Press Release
- Industry Association
- Paid Database
- Investor Presentations

Step 4 - Data Triangulation
Involves using different sources of information in order to increase the validity of a study
These sources are likely to be stakeholders in a program - participants, other researchers, program staff, other community members, and so on.
Then we put all data in single framework & apply various statistical tools to find out the dynamic on the market.
During the analysis stage, feedback from the stakeholder groups would be compared to determine areas of agreement as well as areas of divergence