

Key Insights
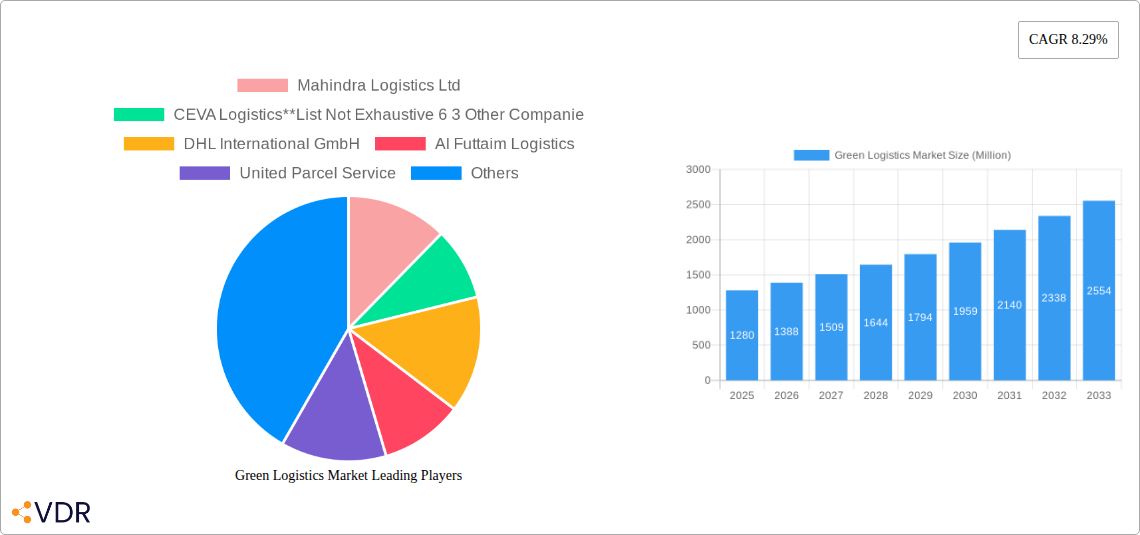
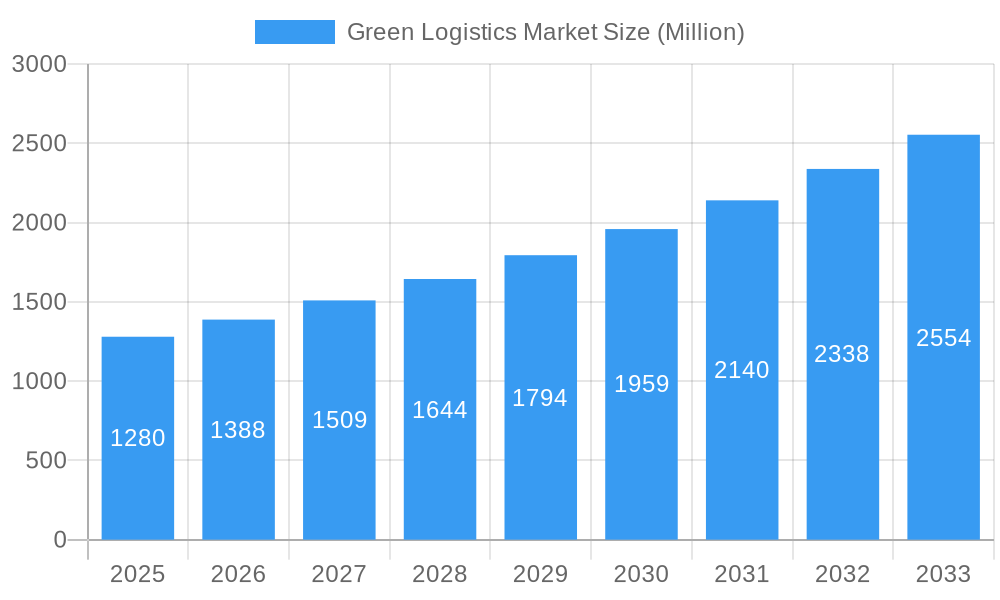
The global green logistics market, valued at $1.28 billion in 2025, is poised for robust growth, exhibiting a Compound Annual Growth Rate (CAGR) of 8.29% from 2025 to 2033. This expansion is driven by several key factors. Increasing environmental regulations globally are compelling businesses to adopt sustainable practices across their supply chains. Growing consumer awareness of environmental issues and demand for eco-friendly products are further fueling this shift. Technological advancements, such as the adoption of electric vehicles, alternative fuels, and route optimization software, are significantly improving the efficiency and environmental performance of logistics operations. The healthcare, e-commerce, and manufacturing sectors are leading the adoption of green logistics solutions due to their high volume of shipments and stringent sustainability requirements. The market is segmented by end-user, business type (warehousing, distribution, value-added services), and mode of operation (road, sea, storage). The North American and European regions currently dominate the market, but the Asia-Pacific region is expected to witness substantial growth driven by rapid economic development and increasing urbanization.
Green Logistics Market Market Size (In Billion)
Despite the positive outlook, the market faces certain challenges. High initial investment costs associated with adopting green technologies can be a barrier for smaller companies. The lack of standardized green logistics practices and infrastructure in certain regions also presents hurdles. However, government incentives, technological innovations, and increasing corporate social responsibility initiatives are expected to mitigate these challenges and drive further market growth. Key players such as Mahindra Logistics, DHL, UPS, and others are strategically investing in sustainable logistics solutions, enhancing their market positions and shaping the future of this dynamic sector. The forecast period anticipates continued growth, with a significant increase in market value by 2033, driven by ongoing advancements and increasing regulatory pressure.
Green Logistics Market Company Market Share
Green Logistics Market: A Comprehensive Report (2019-2033)
This comprehensive report provides an in-depth analysis of the Green Logistics Market, encompassing its dynamics, growth trends, regional performance, key players, and future outlook. The study period covers 2019-2033, with 2025 as the base year and forecast period spanning 2025-2033. The report segments the market by end-user (Healthcare, Manufacturing, Automotive, Banking & Financial Services, Retail & E-commerce, Others), business type (Warehousing, Distribution, Value-Added Services), and mode of operation (Storage, Roadways Distribution, Seaways Distribution, Others). Key players analyzed include Mahindra Logistics Ltd, CEVA Logistics, DHL International GmbH, Al-Futtaim Logistics, United Parcel Service, Yusen Logistics Co Ltd, GEODIS, XPO Logistics, Agility Public Warehousing Company K S C P, Bolloré Logistics, Bowling Green Logistics, and 63 other companies. The market is valued in Million units.
Green Logistics Market Dynamics & Structure
The Green Logistics market is experiencing significant growth driven by increasing environmental concerns, stringent government regulations, and rising consumer demand for sustainable supply chains. Market concentration is moderate, with several large players holding significant shares, while smaller, specialized firms cater to niche segments. Technological innovation, particularly in electric vehicles, alternative fuels, and route optimization software, is a primary growth driver. Regulatory frameworks, such as carbon emission standards and waste management policies, are shaping market practices and encouraging adoption of green solutions. While traditional logistics methods still dominate, the increasing availability of cost-effective green alternatives is slowly increasing their market share. Furthermore, the market is witnessing an increase in mergers and acquisitions (M&A) activity, particularly among companies seeking to expand their green logistics capabilities.
- Market Concentration: Moderate, with top 10 players holding approximately xx% market share in 2025.
- Technological Innovation: Significant advancements in electric vehicles, renewable energy integration, and AI-powered route optimization.
- Regulatory Frameworks: Increasingly stringent emission standards and environmental regulations are driving market transformation.
- Competitive Product Substitutes: Traditional logistics solutions are facing increasing competition from greener alternatives.
- M&A Activity: xx deals recorded in the last five years, indicating consolidation and expansion within the sector.
- Innovation Barriers: High initial investment costs for green technologies, lack of standardized infrastructure, and skills gap in the workforce.
Green Logistics Market Growth Trends & Insights
The Green Logistics market exhibits a robust growth trajectory, projected to expand at a Compound Annual Growth Rate (CAGR) of xx% during the forecast period (2025-2033). This growth is fueled by heightened environmental awareness among businesses and consumers, coupled with supportive government policies. The market size is expected to reach xx Million by 2033 from xx Million in 2025. Market penetration of green logistics solutions is steadily increasing, particularly within environmentally conscious sectors like retail and e-commerce. Technological advancements are further accelerating adoption rates, while shifting consumer preferences toward sustainable products and services are putting pressure on companies to adopt greener practices.
(Detailed analysis of market size evolution, adoption rates, technological disruptions, and consumer behavior shifts will be provided in the full report, supported by relevant data and metrics.)
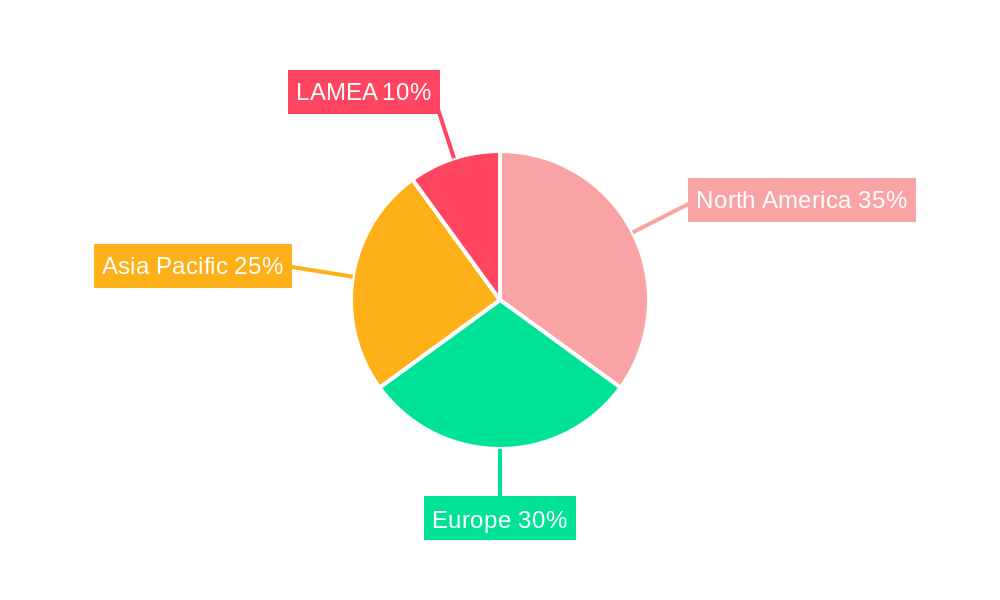
Dominant Regions, Countries, or Segments in Green Logistics Market
North America and Europe currently stand as the leading forces in the Green Logistics market. This dominance is a direct result of stringent environmental mandates, well-established and efficient infrastructure, and a heightened level of consumer awareness regarding sustainability. Within these dominant regions, countries like the United States, Germany, and the United Kingdom are spearheading the adoption of green logistics practices. Concurrently, the Asia-Pacific region is poised for substantial growth in the coming years. This surge is attributed to rapid industrial expansion and proactive government initiatives dedicated to fostering sustainable development.
By End-User: The retail and e-commerce sector presently commands the largest share of the market, closely followed by the manufacturing industry. The healthcare sector is emerging as a rapidly expanding segment, driven by the critical need for temperature-controlled transportation of sensitive medical goods and pharmaceuticals.
By Business Type: Warehousing emerges as the most significant segment when viewed by business type. However, value-added services, including sophisticated reverse logistics operations and innovative sustainable packaging solutions, are demonstrating particularly high growth rates, indicating a shift towards more comprehensive green logistics offerings.
By Mode of Operation: Roadway distribution remains the predominant mode of operation within green logistics, with seaway distribution ranking as the second most utilized method.
- Key Drivers: The market is propelled by several critical factors including the enforcement of stringent environmental regulations, the escalating costs of fossil fuels, continuous advancements in green technologies, and an increasing consumer demand for businesses to adopt sustainable practices.
- Dominance Factors: The established infrastructure, supportive government policies and incentives, high levels of consumer environmental consciousness, and the presence of major industry players are key contributors to the current market dominance in certain regions.
Green Logistics Market Product Landscape
The Green Logistics market encompasses a wide and evolving array of products and services designed to minimize environmental impact. These include a growing fleet of electric and hybrid vehicles, the adoption of alternative fuels such as biofuels and hydrogen, sophisticated optimized routing software that reduces mileage, and innovative sustainable packaging solutions. The core objective of these offerings is to significantly reduce carbon emissions, minimize waste generation throughout the supply chain, and enhance overall operational efficiency. Notable innovations driving the market forward include the development of autonomous vehicles for more efficient delivery, the integration of renewable energy sources into logistics hubs and operations, and advancements in tracking and monitoring technologies that provide unparalleled transparency and accountability in supply chains. The unique selling propositions of these solutions often revolve around demonstrably reduced environmental footprints, tangible cost savings, and substantial improvements in operational efficiency and reliability.
Key Drivers, Barriers & Challenges in Green Logistics Market
Key Drivers: Growing environmental concerns, stringent government regulations, rising fuel costs, technological advancements in green logistics solutions, and increasing consumer demand for sustainable products and services.
Challenges and Restraints: High initial investment costs for green technologies, lack of standardized infrastructure, limited availability of skilled workforce, interoperability issues between different systems, and resistance to change among some businesses. Further, supply chain disruptions can hinder adoption, and regulatory hurdles in some regions remain. Competition from traditional logistics providers offering lower prices can also pose a significant challenge.
Emerging Opportunities in Green Logistics Market
The Green Logistics market presents several emerging opportunities, including the expansion into untapped markets (developing economies), the development of innovative applications such as drone delivery for last-mile logistics, and the rise of sustainable packaging and waste management solutions. Evolving consumer preferences towards environmentally conscious brands and services create an enormous market opportunity. The integration of blockchain technology for enhanced traceability and transparency will also be a pivotal factor.
Growth Accelerators in the Green Logistics Market Industry
The sustained long-term growth of the Green Logistics market will be significantly fueled by ongoing technological breakthroughs. Key areas of advancement include improvements in electric vehicle battery technology and charging infrastructure, the wider availability and efficiency of alternative fuels, and the increasing application of Artificial Intelligence (AI) for sophisticated supply chain optimization. Strategic collaborations and partnerships between logistics providers and cutting-edge technology companies are expected to accelerate the adoption and integration of these innovative solutions. Furthermore, expansion into new, emerging markets and the diversification of service offerings will be crucial for enhancing profitability and attracting substantial investment. Crucially, continued government support, manifested through subsidies, tax incentives, and investments in green infrastructure development, will play a vital catalytic role in shaping the future trajectory of the industry.
Key Players Shaping the Green Logistics Market Market
- Mahindra Logistics Ltd
- CEVA Logistics
- DHL International GmbH
- Al-Futtaim Logistics
- United Parcel Service
- Yusen Logistics Co Ltd
- GEODIS
- XPO Logistics
- Agility Public Warehousing Company K S C P
- Bolloré Logistics
- Bowling Green Logistics
- 63 Other Companies
Notable Milestones in Green Logistics Market Sector
- 2020: Several major logistics companies announced ambitious sustainability targets, committing to carbon neutrality by 2050.
- 2021: Significant investments in electric vehicle fleets by leading logistics providers.
- 2022: Introduction of new regulations in several countries aimed at reducing emissions from transportation.
- 2023: Increased adoption of AI-powered route optimization software to reduce fuel consumption and emissions.
- (Further milestones will be detailed in the full report.)
In-Depth Green Logistics Market Market Outlook
The Green Logistics market is poised for considerable future expansion, underpinned by relentless technological innovation, increasingly supportive regulatory frameworks globally, and a surging consumer and corporate demand for sustainable business practices. Key growth catalysts will include the formation of strategic partnerships, substantial investments in green logistics infrastructure, and the successful expansion into untapped geographical markets. The market is firmly on an upward trajectory, presenting significant and lucrative opportunities for companies that are committed to embracing green technologies and embedding sustainable practices into their core operations. The analysis concludes with a comprehensive outline of actionable strategic opportunities tailored for investors, aspiring entrepreneurs, and all stakeholders within the green logistics industry, highlighting pathways to success in this dynamic and growing sector.
Green Logistics Market Segmentation
-
1. End User
- 1.1. Healthcare
- 1.2. Manufacturing
- 1.3. Automotive
- 1.4. Banking and Financial services
- 1.5. Retail and E-commerce
- 1.6. Others
-
2. Business Type
- 2.1. Warehousing
- 2.2. Distribution
- 2.3. Value-Added Services
-
3. Mode of Operation
- 3.1. Storage
- 3.2. Roadways Distribution
- 3.3. Seaways Distribution
- 3.4. Others
Green Logistics Market Segmentation By Geography
-
1. North America
- 1.1. US
- 1.2. Canada
- 1.3. Mexico
-
2. Europe
- 2.1. Germany
- 2.2. UK
- 2.3. France
- 2.4. Russia
- 2.5. Spain
- 2.6. Rest of Europe
-
3. Asia Pacific
- 3.1. India
- 3.2. China
- 3.3. Japan
- 3.4. South Korea
- 3.5. Rest of Asia Pacific
-
4. LAMEA
- 4.1. Latin America
- 4.2. Middle East
- 4.3. Africa
Green Logistics Market Regional Market Share
Geographic Coverage of Green Logistics Market
Green Logistics Market REPORT HIGHLIGHTS
| Aspects | Details |
|---|---|
| Study Period | 2020-2034 |
| Base Year | 2025 |
| Estimated Year | 2026 |
| Forecast Period | 2026-2034 |
| Historical Period | 2020-2025 |
| Growth Rate | CAGR of 8.29% from 2020-2034 |
| Segmentation |
|
Table of Contents
- 1. Introduction
- 1.1. Research Scope
- 1.2. Market Segmentation
- 1.3. Research Objective
- 1.4. Definitions and Assumptions
- 2. Executive Summary
- 2.1. Market Snapshot
- 3. Market Dynamics
- 3.1. Market Drivers
- 3.2. Market Restrains
- 3.3. Market Trends
- 3.4. Market Opportunities
- 4. Market Factor Analysis
- 4.1. Porters Five Forces
- 4.1.1. Bargaining Power of Suppliers
- 4.1.2. Bargaining Power of Buyers
- 4.1.3. Threat of New Entrants
- 4.1.4. Threat of Substitutes
- 4.1.5. Competitive Rivalry
- 4.2. PESTEL analysis
- 4.3. BCG Analysis
- 4.3.1. Stars (High Growth, High Market Share)
- 4.3.2. Cash Cows (Low Growth, High Market Share)
- 4.3.3. Question Mark (High Growth, Low Market Share)
- 4.3.4. Dogs (Low Growth, Low Market Share)
- 4.4. Ansoff Matrix Analysis
- 4.5. Supply Chain Analysis
- 4.6. Regulatory Landscape
- 4.7. Current Market Potential and Opportunity Assessment (TAM–SAM–SOM Framework)
- 4.8. VDR Analyst Note
- 4.1. Porters Five Forces
- 5. Market Analysis, Insights and Forecast 2021-2033
- 5.1. Market Analysis, Insights and Forecast - by End User
- 5.1.1. Healthcare
- 5.1.2. Manufacturing
- 5.1.3. Automotive
- 5.1.4. Banking and Financial services
- 5.1.5. Retail and E-commerce
- 5.1.6. Others
- 5.2. Market Analysis, Insights and Forecast - by Business Type
- 5.2.1. Warehousing
- 5.2.2. Distribution
- 5.2.3. Value-Added Services
- 5.3. Market Analysis, Insights and Forecast - by Mode of Operation
- 5.3.1. Storage
- 5.3.2. Roadways Distribution
- 5.3.3. Seaways Distribution
- 5.3.4. Others
- 5.4. Market Analysis, Insights and Forecast - by Region
- 5.4.1. North America
- 5.4.2. Europe
- 5.4.3. Asia Pacific
- 5.4.4. LAMEA
- 5.1. Market Analysis, Insights and Forecast - by End User
- 6. Green Logistics Market Analysis, Insights and Forecast, 2021-2033
- 6.1. Market Analysis, Insights and Forecast - by End User
- 6.1.1. Healthcare
- 6.1.2. Manufacturing
- 6.1.3. Automotive
- 6.1.4. Banking and Financial services
- 6.1.5. Retail and E-commerce
- 6.1.6. Others
- 6.2. Market Analysis, Insights and Forecast - by Business Type
- 6.2.1. Warehousing
- 6.2.2. Distribution
- 6.2.3. Value-Added Services
- 6.3. Market Analysis, Insights and Forecast - by Mode of Operation
- 6.3.1. Storage
- 6.3.2. Roadways Distribution
- 6.3.3. Seaways Distribution
- 6.3.4. Others
- 6.1. Market Analysis, Insights and Forecast - by End User
- 7. North America Green Logistics Market Analysis, Insights and Forecast, 2021-2033
- 7.1. Market Analysis, Insights and Forecast - by End User
- 7.1.1. Healthcare
- 7.1.2. Manufacturing
- 7.1.3. Automotive
- 7.1.4. Banking and Financial services
- 7.1.5. Retail and E-commerce
- 7.1.6. Others
- 7.2. Market Analysis, Insights and Forecast - by Business Type
- 7.2.1. Warehousing
- 7.2.2. Distribution
- 7.2.3. Value-Added Services
- 7.3. Market Analysis, Insights and Forecast - by Mode of Operation
- 7.3.1. Storage
- 7.3.2. Roadways Distribution
- 7.3.3. Seaways Distribution
- 7.3.4. Others
- 7.1. Market Analysis, Insights and Forecast - by End User
- 8. Europe Green Logistics Market Analysis, Insights and Forecast, 2021-2033
- 8.1. Market Analysis, Insights and Forecast - by End User
- 8.1.1. Healthcare
- 8.1.2. Manufacturing
- 8.1.3. Automotive
- 8.1.4. Banking and Financial services
- 8.1.5. Retail and E-commerce
- 8.1.6. Others
- 8.2. Market Analysis, Insights and Forecast - by Business Type
- 8.2.1. Warehousing
- 8.2.2. Distribution
- 8.2.3. Value-Added Services
- 8.3. Market Analysis, Insights and Forecast - by Mode of Operation
- 8.3.1. Storage
- 8.3.2. Roadways Distribution
- 8.3.3. Seaways Distribution
- 8.3.4. Others
- 8.1. Market Analysis, Insights and Forecast - by End User
- 9. Asia Pacific Green Logistics Market Analysis, Insights and Forecast, 2021-2033
- 9.1. Market Analysis, Insights and Forecast - by End User
- 9.1.1. Healthcare
- 9.1.2. Manufacturing
- 9.1.3. Automotive
- 9.1.4. Banking and Financial services
- 9.1.5. Retail and E-commerce
- 9.1.6. Others
- 9.2. Market Analysis, Insights and Forecast - by Business Type
- 9.2.1. Warehousing
- 9.2.2. Distribution
- 9.2.3. Value-Added Services
- 9.3. Market Analysis, Insights and Forecast - by Mode of Operation
- 9.3.1. Storage
- 9.3.2. Roadways Distribution
- 9.3.3. Seaways Distribution
- 9.3.4. Others
- 9.1. Market Analysis, Insights and Forecast - by End User
- 10. LAMEA Green Logistics Market Analysis, Insights and Forecast, 2021-2033
- 10.1. Market Analysis, Insights and Forecast - by End User
- 10.1.1. Healthcare
- 10.1.2. Manufacturing
- 10.1.3. Automotive
- 10.1.4. Banking and Financial services
- 10.1.5. Retail and E-commerce
- 10.1.6. Others
- 10.2. Market Analysis, Insights and Forecast - by Business Type
- 10.2.1. Warehousing
- 10.2.2. Distribution
- 10.2.3. Value-Added Services
- 10.3. Market Analysis, Insights and Forecast - by Mode of Operation
- 10.3.1. Storage
- 10.3.2. Roadways Distribution
- 10.3.3. Seaways Distribution
- 10.3.4. Others
- 10.1. Market Analysis, Insights and Forecast - by End User
- 11. Competitive Analysis
- 11.1. Company Profiles
- 11.1.1 Mahindra Logistics Ltd
- 11.1.1.1. Company Overview
- 11.1.1.2. Products
- 11.1.1.3. Company Financials
- 11.1.1.4. SWOT Analysis
- 11.1.2 CEVA Logistics**List Not Exhaustive 6 3 Other Companie
- 11.1.2.1. Company Overview
- 11.1.2.2. Products
- 11.1.2.3. Company Financials
- 11.1.2.4. SWOT Analysis
- 11.1.3 DHL International GmbH
- 11.1.3.1. Company Overview
- 11.1.3.2. Products
- 11.1.3.3. Company Financials
- 11.1.3.4. SWOT Analysis
- 11.1.4 AI Futtaim Logistics
- 11.1.4.1. Company Overview
- 11.1.4.2. Products
- 11.1.4.3. Company Financials
- 11.1.4.4. SWOT Analysis
- 11.1.5 United Parcel Service
- 11.1.5.1. Company Overview
- 11.1.5.2. Products
- 11.1.5.3. Company Financials
- 11.1.5.4. SWOT Analysis
- 11.1.6 Yusen Logistics Co Ltd
- 11.1.6.1. Company Overview
- 11.1.6.2. Products
- 11.1.6.3. Company Financials
- 11.1.6.4. SWOT Analysis
- 11.1.7 GEODIS
- 11.1.7.1. Company Overview
- 11.1.7.2. Products
- 11.1.7.3. Company Financials
- 11.1.7.4. SWOT Analysis
- 11.1.8 XPO Logistics
- 11.1.8.1. Company Overview
- 11.1.8.2. Products
- 11.1.8.3. Company Financials
- 11.1.8.4. SWOT Analysis
- 11.1.9 Agility Public Warehousing Company K S C P
- 11.1.9.1. Company Overview
- 11.1.9.2. Products
- 11.1.9.3. Company Financials
- 11.1.9.4. SWOT Analysis
- 11.1.10 Bollore Logistics
- 11.1.10.1. Company Overview
- 11.1.10.2. Products
- 11.1.10.3. Company Financials
- 11.1.10.4. SWOT Analysis
- 11.1.11 Bowling Green Logistics
- 11.1.11.1. Company Overview
- 11.1.11.2. Products
- 11.1.11.3. Company Financials
- 11.1.11.4. SWOT Analysis
- 11.1.1 Mahindra Logistics Ltd
- 11.2. Market Entropy
- 11.2.1 Company's Key Areas Served
- 11.2.2 Recent Developments
- 11.3. Company Market Share Analysis 2025
- 11.3.1 Top 5 Companies Market Share Analysis
- 11.3.2 Top 3 Companies Market Share Analysis
- 11.4. List of Potential Customers
- 12. Research Methodology
List of Figures
- Figure 1: Green Logistics Market Revenue Breakdown (Million, %) by Product 2025 & 2033
- Figure 2: Green Logistics Market Share (%) by Company 2025
List of Tables
- Table 1: Green Logistics Market Revenue Million Forecast, by End User 2020 & 2033
- Table 2: Green Logistics Market Revenue Million Forecast, by Business Type 2020 & 2033
- Table 3: Green Logistics Market Revenue Million Forecast, by Mode of Operation 2020 & 2033
- Table 4: Green Logistics Market Revenue Million Forecast, by Region 2020 & 2033
- Table 5: Green Logistics Market Revenue Million Forecast, by End User 2020 & 2033
- Table 6: Green Logistics Market Revenue Million Forecast, by Business Type 2020 & 2033
- Table 7: Green Logistics Market Revenue Million Forecast, by Mode of Operation 2020 & 2033
- Table 8: Green Logistics Market Revenue Million Forecast, by Country 2020 & 2033
- Table 9: US Green Logistics Market Revenue (Million) Forecast, by Application 2020 & 2033
- Table 10: Canada Green Logistics Market Revenue (Million) Forecast, by Application 2020 & 2033
- Table 11: Mexico Green Logistics Market Revenue (Million) Forecast, by Application 2020 & 2033
- Table 12: Green Logistics Market Revenue Million Forecast, by End User 2020 & 2033
- Table 13: Green Logistics Market Revenue Million Forecast, by Business Type 2020 & 2033
- Table 14: Green Logistics Market Revenue Million Forecast, by Mode of Operation 2020 & 2033
- Table 15: Green Logistics Market Revenue Million Forecast, by Country 2020 & 2033
- Table 16: Germany Green Logistics Market Revenue (Million) Forecast, by Application 2020 & 2033
- Table 17: UK Green Logistics Market Revenue (Million) Forecast, by Application 2020 & 2033
- Table 18: France Green Logistics Market Revenue (Million) Forecast, by Application 2020 & 2033
- Table 19: Russia Green Logistics Market Revenue (Million) Forecast, by Application 2020 & 2033
- Table 20: Spain Green Logistics Market Revenue (Million) Forecast, by Application 2020 & 2033
- Table 21: Rest of Europe Green Logistics Market Revenue (Million) Forecast, by Application 2020 & 2033
- Table 22: Green Logistics Market Revenue Million Forecast, by End User 2020 & 2033
- Table 23: Green Logistics Market Revenue Million Forecast, by Business Type 2020 & 2033
- Table 24: Green Logistics Market Revenue Million Forecast, by Mode of Operation 2020 & 2033
- Table 25: Green Logistics Market Revenue Million Forecast, by Country 2020 & 2033
- Table 26: India Green Logistics Market Revenue (Million) Forecast, by Application 2020 & 2033
- Table 27: China Green Logistics Market Revenue (Million) Forecast, by Application 2020 & 2033
- Table 28: Japan Green Logistics Market Revenue (Million) Forecast, by Application 2020 & 2033
- Table 29: South Korea Green Logistics Market Revenue (Million) Forecast, by Application 2020 & 2033
- Table 30: Rest of Asia Pacific Green Logistics Market Revenue (Million) Forecast, by Application 2020 & 2033
- Table 31: Green Logistics Market Revenue Million Forecast, by End User 2020 & 2033
- Table 32: Green Logistics Market Revenue Million Forecast, by Business Type 2020 & 2033
- Table 33: Green Logistics Market Revenue Million Forecast, by Mode of Operation 2020 & 2033
- Table 34: Green Logistics Market Revenue Million Forecast, by Country 2020 & 2033
- Table 35: Latin America Green Logistics Market Revenue (Million) Forecast, by Application 2020 & 2033
- Table 36: Middle East Green Logistics Market Revenue (Million) Forecast, by Application 2020 & 2033
- Table 37: Africa Green Logistics Market Revenue (Million) Forecast, by Application 2020 & 2033
Frequently Asked Questions
1. What is the projected Compound Annual Growth Rate (CAGR) of the Green Logistics Market?
The projected CAGR is approximately 8.29%.
2. Which companies are prominent players in the Green Logistics Market?
Key companies in the market include Mahindra Logistics Ltd, CEVA Logistics**List Not Exhaustive 6 3 Other Companie, DHL International GmbH, AI Futtaim Logistics, United Parcel Service, Yusen Logistics Co Ltd, GEODIS, XPO Logistics, Agility Public Warehousing Company K S C P, Bollore Logistics, Bowling Green Logistics.
3. What are the main segments of the Green Logistics Market?
The market segments include End User, Business Type, Mode of Operation.
4. Can you provide details about the market size?
The market size is estimated to be USD 1.28 Million as of 2022.
5. What are some drivers contributing to market growth?
Growing adoption of EVs in the logistics industry; Increase in adoption of artificial intelligence (AI) in the global logistics industry.
6. What are the notable trends driving market growth?
The Demand for Green Warehouses is Rising.
7. Are there any restraints impacting market growth?
Dependency on fossil fuels. majority for transportation; The high costs of implementing green procurement practices discourage potential investors.
8. Can you provide examples of recent developments in the market?
N/A
9. What pricing options are available for accessing the report?
Pricing options include single-user, multi-user, and enterprise licenses priced at USD 3800, USD 4500, and USD 5800 respectively.
10. Is the market size provided in terms of value or volume?
The market size is provided in terms of value, measured in Million.
11. Are there any specific market keywords associated with the report?
Yes, the market keyword associated with the report is "Green Logistics Market," which aids in identifying and referencing the specific market segment covered.
12. How do I determine which pricing option suits my needs best?
The pricing options vary based on user requirements and access needs. Individual users may opt for single-user licenses, while businesses requiring broader access may choose multi-user or enterprise licenses for cost-effective access to the report.
13. Are there any additional resources or data provided in the Green Logistics Market report?
While the report offers comprehensive insights, it's advisable to review the specific contents or supplementary materials provided to ascertain if additional resources or data are available.
14. How can I stay updated on further developments or reports in the Green Logistics Market?
To stay informed about further developments, trends, and reports in the Green Logistics Market, consider subscribing to industry newsletters, following relevant companies and organizations, or regularly checking reputable industry news sources and publications.
Methodology
Step 1 - Identification of Relevant Samples Size from Population Database


Step 2 - Approaches for Defining Global Market Size (Value, Volume* & Price*)

Note*: In applicable scenarios
Step 3 - Data Sources
Primary Research
- Web Analytics
- Survey Reports
- Research Institute
- Latest Research Reports
- Opinion Leaders
Secondary Research
- Annual Reports
- White Paper
- Latest Press Release
- Industry Association
- Paid Database
- Investor Presentations

Step 4 - Data Triangulation
Involves using different sources of information in order to increase the validity of a study
These sources are likely to be stakeholders in a program - participants, other researchers, program staff, other community members, and so on.
Then we put all data in single framework & apply various statistical tools to find out the dynamic on the market.
During the analysis stage, feedback from the stakeholder groups would be compared to determine areas of agreement as well as areas of divergence