

Key Insights
The global graphite market, projected to reach $31.59 billion by 2025, is poised for substantial growth. This expansion is primarily propelled by the surging demand from the electric vehicle (EV) and energy storage sectors, driven by the critical role of graphite in lithium-ion batteries. The market is expected to grow at a Compound Annual Growth Rate (CAGR) of 8.42% from 2025 to 2033. Further market impetus comes from the increasing application of graphite in refractories for the steel and metallurgical industries, lubricants, and advanced electronics. The Asia-Pacific region, led by China, is anticipated to maintain market dominance due to its robust manufacturing capabilities and significant contribution to global EV production. Key market challenges include price volatility stemming from supply chain intricacies and environmental considerations in graphite extraction and processing. Synthetic graphite, despite its higher cost, is gaining prominence for its superior quality and performance, expected to outpace the growth of natural graphite. Sustainable mining practices and innovative processing techniques will be vital for long-term market sustainability and addressing environmental concerns. The competitive landscape is characterized by intense rivalry among established and emerging players, fostering continuous innovation.
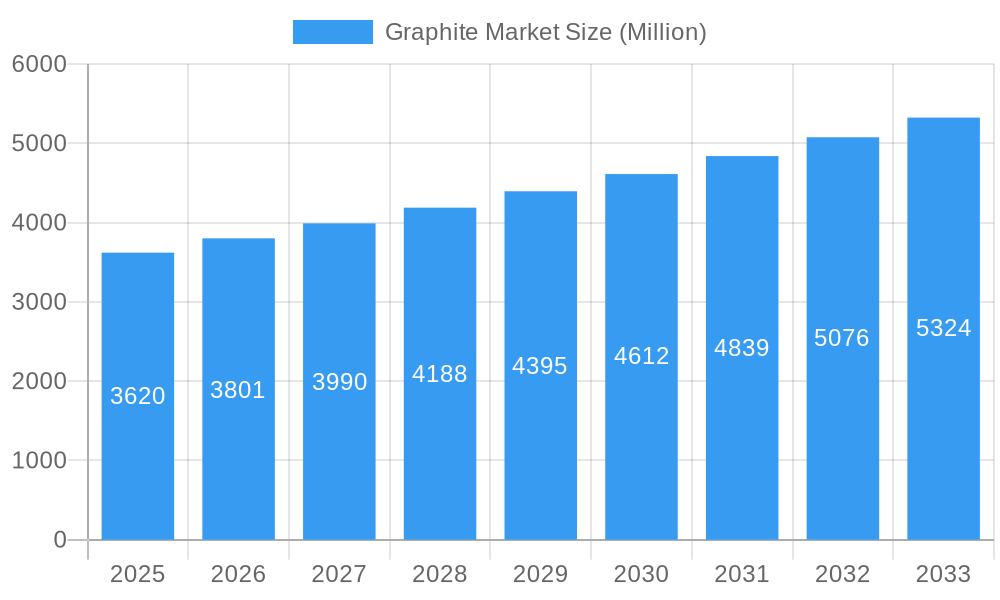
Graphite Market Market Size (In Billion)
Market segmentation highlights diverse applications and end-user industries. The battery sector is the primary growth engine, fueled by the global shift towards electric mobility and renewable energy storage. The electronics industry represents another significant market, utilizing graphite in various components. Metallurgical applications, including refractories and foundry processes, offer a stable market base. While North America and Europe are established markets, Asia-Pacific and other emerging economies present substantial expansion opportunities due to industrialization and expanding EV markets. Strategic navigation requires a keen understanding of regional demand variations, regulatory landscapes, and technological advancements.
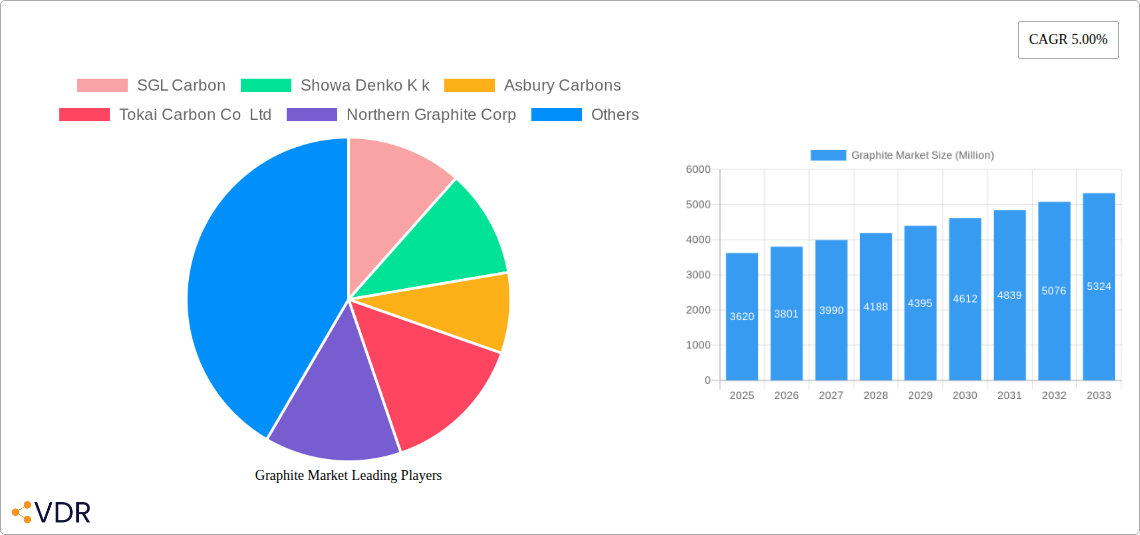
Graphite Market Company Market Share
Graphite Market Analysis: Trends, Size, and Forecast (2019-2033)
This in-depth report analyzes the graphite market's dynamics, growth trajectories, regional segmentation, product landscape, key players, and future outlook. Covering the historical period (2019-2024), base year (2025), and forecast period (2025-2033), it offers critical insights for industry professionals, investors, and stakeholders. The market is segmented by type (Natural Graphite, Synthetic Graphite), application (Electrodes, Refractories, Casting & Foundries, Batteries, Lubricants, Other Applications), and end-user industry (Electronics, Metallurgy, Automotive (including EV/HEV vehicles), Other End-user Industries). Market size is presented in billion units.
Graphite Market Dynamics & Structure
The global graphite market is characterized by moderate concentration, with several major players holding significant market share. Technological innovation, particularly in battery technology and advanced materials, is a key driver, while stringent environmental regulations and the availability of substitute materials pose challenges. The market witnesses consistent M&A activity, reflecting consolidation efforts and strategic expansions.
- Market Concentration: Moderately concentrated, with the top 5 players holding approximately xx% of the market share in 2024.
- Technological Innovation: Focus on improving graphite purity, enhancing performance characteristics (e.g., higher conductivity), and developing sustainable production methods.
- Regulatory Framework: Stringent environmental regulations concerning graphite mining and processing influence production costs and sustainability practices.
- Competitive Product Substitutes: Alternative materials, such as graphene and other carbon-based materials, are emerging as potential substitutes, impacting market competition.
- End-User Demographics: Growing demand from the electronics, automotive, and energy storage sectors is driving market growth, particularly from the burgeoning EV/HEV segment.
- M&A Trends: Significant M&A activity observed in the past five years, with xx deals recorded, primarily focused on securing raw material sources and expanding production capacity.
Graphite Market Growth Trends & Insights
The graphite market has experienced significant growth in recent years, driven primarily by the increasing demand for lithium-ion batteries in electric vehicles (EVs), energy storage systems (ESS), and portable electronics. The market is expected to witness a CAGR of xx% during the forecast period (2025-2033), reaching a market size of xx million units by 2033. Technological advancements, such as the development of high-performance graphite materials, are further accelerating market growth. Shifting consumer preferences towards eco-friendly products and the rising adoption of renewable energy sources are also contributing factors. The market penetration rate for graphite in battery applications is expected to increase from xx% in 2024 to xx% by 2033.
Dominant Regions, Countries, or Segments in Graphite Market
China currently holds the largest market share in graphite production and consumption, driven by its substantial manufacturing base and robust domestic demand. However, regions like North America and Europe are witnessing significant growth, fueled by the expanding EV and ESS markets. The battery application segment dominates the market, followed by electrodes and refractories.
- Key Drivers:
- China: Strong domestic demand, established manufacturing infrastructure, and abundant resources.
- North America: Growing EV and ESS manufacturing, supportive government policies, and investments in lithium-ion battery production.
- Europe: Stringent environmental regulations pushing for electric mobility, increasing investments in renewable energy projects.
- Dominant Segments:
- Batteries: Highest growth potential due to the increasing adoption of EVs and ESS.
- Synthetic Graphite: Higher purity and consistent quality compared to natural graphite, leading to increased preference in high-performance applications.
Graphite Market Product Landscape
The graphite market offers a diverse range of products, including natural graphite and synthetic graphite, with varying purity levels and performance characteristics. Continuous innovations focus on enhancing conductivity, improving thermal stability, and reducing production costs. Unique selling propositions include superior purity, customized particle size distribution, and enhanced electrochemical properties tailored to specific applications. Technological advancements include the development of advanced purification techniques and the use of novel materials to enhance graphite performance.
Key Drivers, Barriers & Challenges in Graphite Market
Key Drivers:
- The burgeoning electric vehicle and energy storage systems market is a major driver of graphite demand.
- Technological advancements leading to higher-performance graphite materials are boosting market growth.
- Government incentives and policies promoting the adoption of renewable energy technologies are contributing to market expansion.
Challenges & Restraints:
- Fluctuations in raw material prices and supply chain disruptions can significantly impact production costs.
- Stringent environmental regulations related to graphite mining and processing can pose operational challenges.
- Competition from alternative materials and the emergence of substitute technologies are creating pressure on market players. The estimated impact of these factors on market growth is a projected reduction of xx% by 2030.
Emerging Opportunities in Graphite Market
Emerging opportunities exist in the development of high-performance graphite materials for next-generation batteries, as well as in exploring new applications in advanced manufacturing and energy storage technologies. Untapped markets in developing economies present significant growth potential. The growing focus on sustainable and ethical sourcing of graphite is creating new opportunities for responsible companies.
Growth Accelerators in the Graphite Market Industry
Technological breakthroughs in graphite purification and processing are significantly enhancing product quality and performance. Strategic partnerships between graphite producers and battery manufacturers are creating vertically integrated supply chains, fostering market growth. Expansions into new geographical markets and diversification of applications are further accelerating market expansion.
Key Players Shaping the Graphite Market Market
- SGL Carbon
- Showa Denko K.K.
- Asbury Carbons
- Tokai Carbon Co. Ltd.
- Northern Graphite Corp
- Mason Graphite Inc
- Triton Minerals
- BTR New Material Group Co. Ltd.
- Jiangxi Zichen Technology Co. Ltd.
- Imerys
- Shanghai Shanshan Technology Co. Ltd.
- Syrah Resources Limited
- Shenzhen Xiangfenghua Technology Co. Ltd.
- Nippon Kokuen Group
Notable Milestones in Graphite Market Sector
- October 2022: Syrah Resources Ltd. announced a supply agreement with LG Energy Solution Ltd. for 2 ktpa of graphite anode material (AAM) from 2025, escalating to at least 10 ktpa subsequently. This signifies a substantial commitment to the EV battery market.
- October 2022: Imerys Graphite & Carbon launched the EMILI Project, expanding its lithium-ion battery component production, strengthening its market leadership position.
In-Depth Graphite Market Market Outlook
The graphite market is poised for robust growth in the coming years, driven by the increasing demand for lithium-ion batteries in EVs, ESS, and other applications. Strategic partnerships, technological advancements, and market expansion into new geographical areas will continue to drive market expansion. Companies focusing on sustainable practices and providing high-quality, cost-effective products are well-positioned to capitalize on emerging opportunities.
Graphite Market Segmentation
-
1. Type
- 1.1. Natural Graphite
- 1.2. Synthetic Graphite
-
2. Application
- 2.1. Electrodes
- 2.2. Refractories, Casting, and Foundries
- 2.3. Batteries
- 2.4. Lubricants
- 2.5. Other Applications
-
3. End-user Industry
- 3.1. Electronics
- 3.2. Metallurgy
- 3.3. Automotive (Includes EV/HEV Vehicles)
- 3.4. Other End-user Industries
Graphite Market Segmentation By Geography
-
1. Asia Pacific
- 1.1. China
- 1.2. India
- 1.3. Japan
- 1.4. South Korea
- 1.5. Rest of Asia Pacific
-
2. North America
- 2.1. United States
- 2.2. Canada
- 2.3. Mexico
-
3. Europe
- 3.1. Germany
- 3.2. United Kingdom
- 3.3. Italy
- 3.4. France
- 3.5. Russia
- 3.6. Rest of Europe
-
4. South America
- 4.1. Brazil
- 4.2. Argentina
- 4.3. Rest of South America
-
5. Middle East and Africa
- 5.1. Saudi Arabia
- 5.2. South Africa
- 5.3. Rest of Middle East and Africa
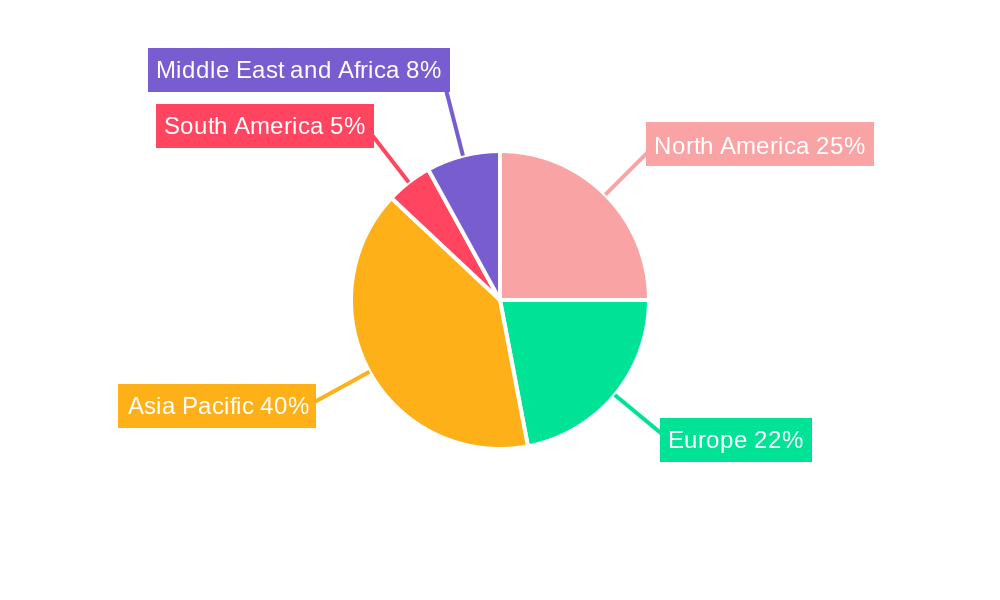
Graphite Market Regional Market Share
Geographic Coverage of Graphite Market
Graphite Market REPORT HIGHLIGHTS
| Aspects | Details |
|---|---|
| Study Period | 2020-2034 |
| Base Year | 2025 |
| Estimated Year | 2026 |
| Forecast Period | 2026-2034 |
| Historical Period | 2020-2025 |
| Growth Rate | CAGR of 8.42% from 2020-2034 |
| Segmentation |
|
Table of Contents
- 1. Introduction
- 1.1. Research Scope
- 1.2. Market Segmentation
- 1.3. Research Objective
- 1.4. Definitions and Assumptions
- 2. Executive Summary
- 2.1. Market Snapshot
- 3. Market Dynamics
- 3.1. Market Drivers
- 3.2. Market Restrains
- 3.3. Market Trends
- 3.4. Market Opportunities
- 4. Market Factor Analysis
- 4.1. Porters Five Forces
- 4.1.1. Bargaining Power of Suppliers
- 4.1.2. Bargaining Power of Buyers
- 4.1.3. Threat of New Entrants
- 4.1.4. Threat of Substitutes
- 4.1.5. Competitive Rivalry
- 4.2. PESTEL analysis
- 4.3. BCG Analysis
- 4.3.1. Stars (High Growth, High Market Share)
- 4.3.2. Cash Cows (Low Growth, High Market Share)
- 4.3.3. Question Mark (High Growth, Low Market Share)
- 4.3.4. Dogs (Low Growth, Low Market Share)
- 4.4. Ansoff Matrix Analysis
- 4.5. Supply Chain Analysis
- 4.6. Regulatory Landscape
- 4.7. Current Market Potential and Opportunity Assessment (TAM–SAM–SOM Framework)
- 4.8. VDR Analyst Note
- 4.1. Porters Five Forces
- 5. Market Analysis, Insights and Forecast 2021-2033
- 5.1. Market Analysis, Insights and Forecast - by Type
- 5.1.1. Natural Graphite
- 5.1.2. Synthetic Graphite
- 5.2. Market Analysis, Insights and Forecast - by Application
- 5.2.1. Electrodes
- 5.2.2. Refractories, Casting, and Foundries
- 5.2.3. Batteries
- 5.2.4. Lubricants
- 5.2.5. Other Applications
- 5.3. Market Analysis, Insights and Forecast - by End-user Industry
- 5.3.1. Electronics
- 5.3.2. Metallurgy
- 5.3.3. Automotive (Includes EV/HEV Vehicles)
- 5.3.4. Other End-user Industries
- 5.4. Market Analysis, Insights and Forecast - by Region
- 5.4.1. Asia Pacific
- 5.4.2. North America
- 5.4.3. Europe
- 5.4.4. South America
- 5.4.5. Middle East and Africa
- 5.1. Market Analysis, Insights and Forecast - by Type
- 6. Global Graphite Market Analysis, Insights and Forecast, 2021-2033
- 6.1. Market Analysis, Insights and Forecast - by Type
- 6.1.1. Natural Graphite
- 6.1.2. Synthetic Graphite
- 6.2. Market Analysis, Insights and Forecast - by Application
- 6.2.1. Electrodes
- 6.2.2. Refractories, Casting, and Foundries
- 6.2.3. Batteries
- 6.2.4. Lubricants
- 6.2.5. Other Applications
- 6.3. Market Analysis, Insights and Forecast - by End-user Industry
- 6.3.1. Electronics
- 6.3.2. Metallurgy
- 6.3.3. Automotive (Includes EV/HEV Vehicles)
- 6.3.4. Other End-user Industries
- 6.1. Market Analysis, Insights and Forecast - by Type
- 7. Asia Pacific Graphite Market Analysis, Insights and Forecast, 2021-2033
- 7.1. Market Analysis, Insights and Forecast - by Type
- 7.1.1. Natural Graphite
- 7.1.2. Synthetic Graphite
- 7.2. Market Analysis, Insights and Forecast - by Application
- 7.2.1. Electrodes
- 7.2.2. Refractories, Casting, and Foundries
- 7.2.3. Batteries
- 7.2.4. Lubricants
- 7.2.5. Other Applications
- 7.3. Market Analysis, Insights and Forecast - by End-user Industry
- 7.3.1. Electronics
- 7.3.2. Metallurgy
- 7.3.3. Automotive (Includes EV/HEV Vehicles)
- 7.3.4. Other End-user Industries
- 7.1. Market Analysis, Insights and Forecast - by Type
- 8. North America Graphite Market Analysis, Insights and Forecast, 2021-2033
- 8.1. Market Analysis, Insights and Forecast - by Type
- 8.1.1. Natural Graphite
- 8.1.2. Synthetic Graphite
- 8.2. Market Analysis, Insights and Forecast - by Application
- 8.2.1. Electrodes
- 8.2.2. Refractories, Casting, and Foundries
- 8.2.3. Batteries
- 8.2.4. Lubricants
- 8.2.5. Other Applications
- 8.3. Market Analysis, Insights and Forecast - by End-user Industry
- 8.3.1. Electronics
- 8.3.2. Metallurgy
- 8.3.3. Automotive (Includes EV/HEV Vehicles)
- 8.3.4. Other End-user Industries
- 8.1. Market Analysis, Insights and Forecast - by Type
- 9. Europe Graphite Market Analysis, Insights and Forecast, 2021-2033
- 9.1. Market Analysis, Insights and Forecast - by Type
- 9.1.1. Natural Graphite
- 9.1.2. Synthetic Graphite
- 9.2. Market Analysis, Insights and Forecast - by Application
- 9.2.1. Electrodes
- 9.2.2. Refractories, Casting, and Foundries
- 9.2.3. Batteries
- 9.2.4. Lubricants
- 9.2.5. Other Applications
- 9.3. Market Analysis, Insights and Forecast - by End-user Industry
- 9.3.1. Electronics
- 9.3.2. Metallurgy
- 9.3.3. Automotive (Includes EV/HEV Vehicles)
- 9.3.4. Other End-user Industries
- 9.1. Market Analysis, Insights and Forecast - by Type
- 10. South America Graphite Market Analysis, Insights and Forecast, 2021-2033
- 10.1. Market Analysis, Insights and Forecast - by Type
- 10.1.1. Natural Graphite
- 10.1.2. Synthetic Graphite
- 10.2. Market Analysis, Insights and Forecast - by Application
- 10.2.1. Electrodes
- 10.2.2. Refractories, Casting, and Foundries
- 10.2.3. Batteries
- 10.2.4. Lubricants
- 10.2.5. Other Applications
- 10.3. Market Analysis, Insights and Forecast - by End-user Industry
- 10.3.1. Electronics
- 10.3.2. Metallurgy
- 10.3.3. Automotive (Includes EV/HEV Vehicles)
- 10.3.4. Other End-user Industries
- 10.1. Market Analysis, Insights and Forecast - by Type
- 11. Middle East and Africa Graphite Market Analysis, Insights and Forecast, 2021-2033
- 11.1. Market Analysis, Insights and Forecast - by Type
- 11.1.1. Natural Graphite
- 11.1.2. Synthetic Graphite
- 11.2. Market Analysis, Insights and Forecast - by Application
- 11.2.1. Electrodes
- 11.2.2. Refractories, Casting, and Foundries
- 11.2.3. Batteries
- 11.2.4. Lubricants
- 11.2.5. Other Applications
- 11.3. Market Analysis, Insights and Forecast - by End-user Industry
- 11.3.1. Electronics
- 11.3.2. Metallurgy
- 11.3.3. Automotive (Includes EV/HEV Vehicles)
- 11.3.4. Other End-user Industries
- 11.1. Market Analysis, Insights and Forecast - by Type
- 12. Competitive Analysis
- 12.1. Company Profiles
- 12.1.1 SGL Carbon
- 12.1.1.1. Company Overview
- 12.1.1.2. Products
- 12.1.1.3. Company Financials
- 12.1.1.4. SWOT Analysis
- 12.1.2 Showa Denko K k
- 12.1.2.1. Company Overview
- 12.1.2.2. Products
- 12.1.2.3. Company Financials
- 12.1.2.4. SWOT Analysis
- 12.1.3 Asbury Carbons
- 12.1.3.1. Company Overview
- 12.1.3.2. Products
- 12.1.3.3. Company Financials
- 12.1.3.4. SWOT Analysis
- 12.1.4 Tokai Carbon Co Ltd
- 12.1.4.1. Company Overview
- 12.1.4.2. Products
- 12.1.4.3. Company Financials
- 12.1.4.4. SWOT Analysis
- 12.1.5 Northern Graphite Corp
- 12.1.5.1. Company Overview
- 12.1.5.2. Products
- 12.1.5.3. Company Financials
- 12.1.5.4. SWOT Analysis
- 12.1.6 Mason Graphite Inc
- 12.1.6.1. Company Overview
- 12.1.6.2. Products
- 12.1.6.3. Company Financials
- 12.1.6.4. SWOT Analysis
- 12.1.7 Triton Minerals
- 12.1.7.1. Company Overview
- 12.1.7.2. Products
- 12.1.7.3. Company Financials
- 12.1.7.4. SWOT Analysis
- 12.1.8 BTR New Material Group Co Ltd
- 12.1.8.1. Company Overview
- 12.1.8.2. Products
- 12.1.8.3. Company Financials
- 12.1.8.4. SWOT Analysis
- 12.1.9 Jiangxi Zichen Technology Co Ltd
- 12.1.9.1. Company Overview
- 12.1.9.2. Products
- 12.1.9.3. Company Financials
- 12.1.9.4. SWOT Analysis
- 12.1.10 Imerys
- 12.1.10.1. Company Overview
- 12.1.10.2. Products
- 12.1.10.3. Company Financials
- 12.1.10.4. SWOT Analysis
- 12.1.11 Shanghai Shanshan Technology Co Ltd
- 12.1.11.1. Company Overview
- 12.1.11.2. Products
- 12.1.11.3. Company Financials
- 12.1.11.4. SWOT Analysis
- 12.1.12 Syrah Resources Limited
- 12.1.12.1. Company Overview
- 12.1.12.2. Products
- 12.1.12.3. Company Financials
- 12.1.12.4. SWOT Analysis
- 12.1.13 Shenzhen Xiangfenghua Technology Co Ltd
- 12.1.13.1. Company Overview
- 12.1.13.2. Products
- 12.1.13.3. Company Financials
- 12.1.13.4. SWOT Analysis
- 12.1.14 Nippon Kokuen Group
- 12.1.14.1. Company Overview
- 12.1.14.2. Products
- 12.1.14.3. Company Financials
- 12.1.14.4. SWOT Analysis
- 12.1.1 SGL Carbon
- 12.2. Market Entropy
- 12.2.1 Company's Key Areas Served
- 12.2.2 Recent Developments
- 12.3. Company Market Share Analysis 2025
- 12.3.1 Top 5 Companies Market Share Analysis
- 12.3.2 Top 3 Companies Market Share Analysis
- 12.4. List of Potential Customers
- 13. Research Methodology
List of Figures
- Figure 1: Global Graphite Market Revenue Breakdown (billion, %) by Region 2025 & 2033
- Figure 2: Global Graphite Market Volume Breakdown (K Tons, %) by Region 2025 & 2033
- Figure 3: Asia Pacific Graphite Market Revenue (billion), by Type 2025 & 2033
- Figure 4: Asia Pacific Graphite Market Volume (K Tons), by Type 2025 & 2033
- Figure 5: Asia Pacific Graphite Market Revenue Share (%), by Type 2025 & 2033
- Figure 6: Asia Pacific Graphite Market Volume Share (%), by Type 2025 & 2033
- Figure 7: Asia Pacific Graphite Market Revenue (billion), by Application 2025 & 2033
- Figure 8: Asia Pacific Graphite Market Volume (K Tons), by Application 2025 & 2033
- Figure 9: Asia Pacific Graphite Market Revenue Share (%), by Application 2025 & 2033
- Figure 10: Asia Pacific Graphite Market Volume Share (%), by Application 2025 & 2033
- Figure 11: Asia Pacific Graphite Market Revenue (billion), by End-user Industry 2025 & 2033
- Figure 12: Asia Pacific Graphite Market Volume (K Tons), by End-user Industry 2025 & 2033
- Figure 13: Asia Pacific Graphite Market Revenue Share (%), by End-user Industry 2025 & 2033
- Figure 14: Asia Pacific Graphite Market Volume Share (%), by End-user Industry 2025 & 2033
- Figure 15: Asia Pacific Graphite Market Revenue (billion), by Country 2025 & 2033
- Figure 16: Asia Pacific Graphite Market Volume (K Tons), by Country 2025 & 2033
- Figure 17: Asia Pacific Graphite Market Revenue Share (%), by Country 2025 & 2033
- Figure 18: Asia Pacific Graphite Market Volume Share (%), by Country 2025 & 2033
- Figure 19: North America Graphite Market Revenue (billion), by Type 2025 & 2033
- Figure 20: North America Graphite Market Volume (K Tons), by Type 2025 & 2033
- Figure 21: North America Graphite Market Revenue Share (%), by Type 2025 & 2033
- Figure 22: North America Graphite Market Volume Share (%), by Type 2025 & 2033
- Figure 23: North America Graphite Market Revenue (billion), by Application 2025 & 2033
- Figure 24: North America Graphite Market Volume (K Tons), by Application 2025 & 2033
- Figure 25: North America Graphite Market Revenue Share (%), by Application 2025 & 2033
- Figure 26: North America Graphite Market Volume Share (%), by Application 2025 & 2033
- Figure 27: North America Graphite Market Revenue (billion), by End-user Industry 2025 & 2033
- Figure 28: North America Graphite Market Volume (K Tons), by End-user Industry 2025 & 2033
- Figure 29: North America Graphite Market Revenue Share (%), by End-user Industry 2025 & 2033
- Figure 30: North America Graphite Market Volume Share (%), by End-user Industry 2025 & 2033
- Figure 31: North America Graphite Market Revenue (billion), by Country 2025 & 2033
- Figure 32: North America Graphite Market Volume (K Tons), by Country 2025 & 2033
- Figure 33: North America Graphite Market Revenue Share (%), by Country 2025 & 2033
- Figure 34: North America Graphite Market Volume Share (%), by Country 2025 & 2033
- Figure 35: Europe Graphite Market Revenue (billion), by Type 2025 & 2033
- Figure 36: Europe Graphite Market Volume (K Tons), by Type 2025 & 2033
- Figure 37: Europe Graphite Market Revenue Share (%), by Type 2025 & 2033
- Figure 38: Europe Graphite Market Volume Share (%), by Type 2025 & 2033
- Figure 39: Europe Graphite Market Revenue (billion), by Application 2025 & 2033
- Figure 40: Europe Graphite Market Volume (K Tons), by Application 2025 & 2033
- Figure 41: Europe Graphite Market Revenue Share (%), by Application 2025 & 2033
- Figure 42: Europe Graphite Market Volume Share (%), by Application 2025 & 2033
- Figure 43: Europe Graphite Market Revenue (billion), by End-user Industry 2025 & 2033
- Figure 44: Europe Graphite Market Volume (K Tons), by End-user Industry 2025 & 2033
- Figure 45: Europe Graphite Market Revenue Share (%), by End-user Industry 2025 & 2033
- Figure 46: Europe Graphite Market Volume Share (%), by End-user Industry 2025 & 2033
- Figure 47: Europe Graphite Market Revenue (billion), by Country 2025 & 2033
- Figure 48: Europe Graphite Market Volume (K Tons), by Country 2025 & 2033
- Figure 49: Europe Graphite Market Revenue Share (%), by Country 2025 & 2033
- Figure 50: Europe Graphite Market Volume Share (%), by Country 2025 & 2033
- Figure 51: South America Graphite Market Revenue (billion), by Type 2025 & 2033
- Figure 52: South America Graphite Market Volume (K Tons), by Type 2025 & 2033
- Figure 53: South America Graphite Market Revenue Share (%), by Type 2025 & 2033
- Figure 54: South America Graphite Market Volume Share (%), by Type 2025 & 2033
- Figure 55: South America Graphite Market Revenue (billion), by Application 2025 & 2033
- Figure 56: South America Graphite Market Volume (K Tons), by Application 2025 & 2033
- Figure 57: South America Graphite Market Revenue Share (%), by Application 2025 & 2033
- Figure 58: South America Graphite Market Volume Share (%), by Application 2025 & 2033
- Figure 59: South America Graphite Market Revenue (billion), by End-user Industry 2025 & 2033
- Figure 60: South America Graphite Market Volume (K Tons), by End-user Industry 2025 & 2033
- Figure 61: South America Graphite Market Revenue Share (%), by End-user Industry 2025 & 2033
- Figure 62: South America Graphite Market Volume Share (%), by End-user Industry 2025 & 2033
- Figure 63: South America Graphite Market Revenue (billion), by Country 2025 & 2033
- Figure 64: South America Graphite Market Volume (K Tons), by Country 2025 & 2033
- Figure 65: South America Graphite Market Revenue Share (%), by Country 2025 & 2033
- Figure 66: South America Graphite Market Volume Share (%), by Country 2025 & 2033
- Figure 67: Middle East and Africa Graphite Market Revenue (billion), by Type 2025 & 2033
- Figure 68: Middle East and Africa Graphite Market Volume (K Tons), by Type 2025 & 2033
- Figure 69: Middle East and Africa Graphite Market Revenue Share (%), by Type 2025 & 2033
- Figure 70: Middle East and Africa Graphite Market Volume Share (%), by Type 2025 & 2033
- Figure 71: Middle East and Africa Graphite Market Revenue (billion), by Application 2025 & 2033
- Figure 72: Middle East and Africa Graphite Market Volume (K Tons), by Application 2025 & 2033
- Figure 73: Middle East and Africa Graphite Market Revenue Share (%), by Application 2025 & 2033
- Figure 74: Middle East and Africa Graphite Market Volume Share (%), by Application 2025 & 2033
- Figure 75: Middle East and Africa Graphite Market Revenue (billion), by End-user Industry 2025 & 2033
- Figure 76: Middle East and Africa Graphite Market Volume (K Tons), by End-user Industry 2025 & 2033
- Figure 77: Middle East and Africa Graphite Market Revenue Share (%), by End-user Industry 2025 & 2033
- Figure 78: Middle East and Africa Graphite Market Volume Share (%), by End-user Industry 2025 & 2033
- Figure 79: Middle East and Africa Graphite Market Revenue (billion), by Country 2025 & 2033
- Figure 80: Middle East and Africa Graphite Market Volume (K Tons), by Country 2025 & 2033
- Figure 81: Middle East and Africa Graphite Market Revenue Share (%), by Country 2025 & 2033
- Figure 82: Middle East and Africa Graphite Market Volume Share (%), by Country 2025 & 2033
List of Tables
- Table 1: Global Graphite Market Revenue billion Forecast, by Type 2020 & 2033
- Table 2: Global Graphite Market Volume K Tons Forecast, by Type 2020 & 2033
- Table 3: Global Graphite Market Revenue billion Forecast, by Application 2020 & 2033
- Table 4: Global Graphite Market Volume K Tons Forecast, by Application 2020 & 2033
- Table 5: Global Graphite Market Revenue billion Forecast, by End-user Industry 2020 & 2033
- Table 6: Global Graphite Market Volume K Tons Forecast, by End-user Industry 2020 & 2033
- Table 7: Global Graphite Market Revenue billion Forecast, by Region 2020 & 2033
- Table 8: Global Graphite Market Volume K Tons Forecast, by Region 2020 & 2033
- Table 9: Global Graphite Market Revenue billion Forecast, by Type 2020 & 2033
- Table 10: Global Graphite Market Volume K Tons Forecast, by Type 2020 & 2033
- Table 11: Global Graphite Market Revenue billion Forecast, by Application 2020 & 2033
- Table 12: Global Graphite Market Volume K Tons Forecast, by Application 2020 & 2033
- Table 13: Global Graphite Market Revenue billion Forecast, by End-user Industry 2020 & 2033
- Table 14: Global Graphite Market Volume K Tons Forecast, by End-user Industry 2020 & 2033
- Table 15: Global Graphite Market Revenue billion Forecast, by Country 2020 & 2033
- Table 16: Global Graphite Market Volume K Tons Forecast, by Country 2020 & 2033
- Table 17: China Graphite Market Revenue (billion) Forecast, by Application 2020 & 2033
- Table 18: China Graphite Market Volume (K Tons) Forecast, by Application 2020 & 2033
- Table 19: India Graphite Market Revenue (billion) Forecast, by Application 2020 & 2033
- Table 20: India Graphite Market Volume (K Tons) Forecast, by Application 2020 & 2033
- Table 21: Japan Graphite Market Revenue (billion) Forecast, by Application 2020 & 2033
- Table 22: Japan Graphite Market Volume (K Tons) Forecast, by Application 2020 & 2033
- Table 23: South Korea Graphite Market Revenue (billion) Forecast, by Application 2020 & 2033
- Table 24: South Korea Graphite Market Volume (K Tons) Forecast, by Application 2020 & 2033
- Table 25: Rest of Asia Pacific Graphite Market Revenue (billion) Forecast, by Application 2020 & 2033
- Table 26: Rest of Asia Pacific Graphite Market Volume (K Tons) Forecast, by Application 2020 & 2033
- Table 27: Global Graphite Market Revenue billion Forecast, by Type 2020 & 2033
- Table 28: Global Graphite Market Volume K Tons Forecast, by Type 2020 & 2033
- Table 29: Global Graphite Market Revenue billion Forecast, by Application 2020 & 2033
- Table 30: Global Graphite Market Volume K Tons Forecast, by Application 2020 & 2033
- Table 31: Global Graphite Market Revenue billion Forecast, by End-user Industry 2020 & 2033
- Table 32: Global Graphite Market Volume K Tons Forecast, by End-user Industry 2020 & 2033
- Table 33: Global Graphite Market Revenue billion Forecast, by Country 2020 & 2033
- Table 34: Global Graphite Market Volume K Tons Forecast, by Country 2020 & 2033
- Table 35: United States Graphite Market Revenue (billion) Forecast, by Application 2020 & 2033
- Table 36: United States Graphite Market Volume (K Tons) Forecast, by Application 2020 & 2033
- Table 37: Canada Graphite Market Revenue (billion) Forecast, by Application 2020 & 2033
- Table 38: Canada Graphite Market Volume (K Tons) Forecast, by Application 2020 & 2033
- Table 39: Mexico Graphite Market Revenue (billion) Forecast, by Application 2020 & 2033
- Table 40: Mexico Graphite Market Volume (K Tons) Forecast, by Application 2020 & 2033
- Table 41: Global Graphite Market Revenue billion Forecast, by Type 2020 & 2033
- Table 42: Global Graphite Market Volume K Tons Forecast, by Type 2020 & 2033
- Table 43: Global Graphite Market Revenue billion Forecast, by Application 2020 & 2033
- Table 44: Global Graphite Market Volume K Tons Forecast, by Application 2020 & 2033
- Table 45: Global Graphite Market Revenue billion Forecast, by End-user Industry 2020 & 2033
- Table 46: Global Graphite Market Volume K Tons Forecast, by End-user Industry 2020 & 2033
- Table 47: Global Graphite Market Revenue billion Forecast, by Country 2020 & 2033
- Table 48: Global Graphite Market Volume K Tons Forecast, by Country 2020 & 2033
- Table 49: Germany Graphite Market Revenue (billion) Forecast, by Application 2020 & 2033
- Table 50: Germany Graphite Market Volume (K Tons) Forecast, by Application 2020 & 2033
- Table 51: United Kingdom Graphite Market Revenue (billion) Forecast, by Application 2020 & 2033
- Table 52: United Kingdom Graphite Market Volume (K Tons) Forecast, by Application 2020 & 2033
- Table 53: Italy Graphite Market Revenue (billion) Forecast, by Application 2020 & 2033
- Table 54: Italy Graphite Market Volume (K Tons) Forecast, by Application 2020 & 2033
- Table 55: France Graphite Market Revenue (billion) Forecast, by Application 2020 & 2033
- Table 56: France Graphite Market Volume (K Tons) Forecast, by Application 2020 & 2033
- Table 57: Russia Graphite Market Revenue (billion) Forecast, by Application 2020 & 2033
- Table 58: Russia Graphite Market Volume (K Tons) Forecast, by Application 2020 & 2033
- Table 59: Rest of Europe Graphite Market Revenue (billion) Forecast, by Application 2020 & 2033
- Table 60: Rest of Europe Graphite Market Volume (K Tons) Forecast, by Application 2020 & 2033
- Table 61: Global Graphite Market Revenue billion Forecast, by Type 2020 & 2033
- Table 62: Global Graphite Market Volume K Tons Forecast, by Type 2020 & 2033
- Table 63: Global Graphite Market Revenue billion Forecast, by Application 2020 & 2033
- Table 64: Global Graphite Market Volume K Tons Forecast, by Application 2020 & 2033
- Table 65: Global Graphite Market Revenue billion Forecast, by End-user Industry 2020 & 2033
- Table 66: Global Graphite Market Volume K Tons Forecast, by End-user Industry 2020 & 2033
- Table 67: Global Graphite Market Revenue billion Forecast, by Country 2020 & 2033
- Table 68: Global Graphite Market Volume K Tons Forecast, by Country 2020 & 2033
- Table 69: Brazil Graphite Market Revenue (billion) Forecast, by Application 2020 & 2033
- Table 70: Brazil Graphite Market Volume (K Tons) Forecast, by Application 2020 & 2033
- Table 71: Argentina Graphite Market Revenue (billion) Forecast, by Application 2020 & 2033
- Table 72: Argentina Graphite Market Volume (K Tons) Forecast, by Application 2020 & 2033
- Table 73: Rest of South America Graphite Market Revenue (billion) Forecast, by Application 2020 & 2033
- Table 74: Rest of South America Graphite Market Volume (K Tons) Forecast, by Application 2020 & 2033
- Table 75: Global Graphite Market Revenue billion Forecast, by Type 2020 & 2033
- Table 76: Global Graphite Market Volume K Tons Forecast, by Type 2020 & 2033
- Table 77: Global Graphite Market Revenue billion Forecast, by Application 2020 & 2033
- Table 78: Global Graphite Market Volume K Tons Forecast, by Application 2020 & 2033
- Table 79: Global Graphite Market Revenue billion Forecast, by End-user Industry 2020 & 2033
- Table 80: Global Graphite Market Volume K Tons Forecast, by End-user Industry 2020 & 2033
- Table 81: Global Graphite Market Revenue billion Forecast, by Country 2020 & 2033
- Table 82: Global Graphite Market Volume K Tons Forecast, by Country 2020 & 2033
- Table 83: Saudi Arabia Graphite Market Revenue (billion) Forecast, by Application 2020 & 2033
- Table 84: Saudi Arabia Graphite Market Volume (K Tons) Forecast, by Application 2020 & 2033
- Table 85: South Africa Graphite Market Revenue (billion) Forecast, by Application 2020 & 2033
- Table 86: South Africa Graphite Market Volume (K Tons) Forecast, by Application 2020 & 2033
- Table 87: Rest of Middle East and Africa Graphite Market Revenue (billion) Forecast, by Application 2020 & 2033
- Table 88: Rest of Middle East and Africa Graphite Market Volume (K Tons) Forecast, by Application 2020 & 2033
Frequently Asked Questions
1. What is the projected Compound Annual Growth Rate (CAGR) of the Graphite Market?
The projected CAGR is approximately 8.42%.
2. Which companies are prominent players in the Graphite Market?
Key companies in the market include SGL Carbon, Showa Denko K k, Asbury Carbons, Tokai Carbon Co Ltd, Northern Graphite Corp, Mason Graphite Inc, Triton Minerals, BTR New Material Group Co Ltd, Jiangxi Zichen Technology Co Ltd, Imerys, Shanghai Shanshan Technology Co Ltd, Syrah Resources Limited, Shenzhen Xiangfenghua Technology Co Ltd, Nippon Kokuen Group.
3. What are the main segments of the Graphite Market?
The market segments include Type, Application, End-user Industry.
4. Can you provide details about the market size?
The market size is estimated to be USD 31.59 billion as of 2022.
5. What are some drivers contributing to market growth?
Augmenting Demand from the Burgeoning Lithium-ion Battery Industry; Increase In Steel Production in Asia and the Middle East.
6. What are the notable trends driving market growth?
The Metallurgy Segment is Expected to Dominate the Market.
7. Are there any restraints impacting market growth?
Stringent Environmental Regulations; Other Restraints.
8. Can you provide examples of recent developments in the market?
October 2022: Syrah Resources Ltd. announced it would supply a key lithium-ion battery component to South Korea's LG Energy Solution Ltd. According to the agreement, the company was to provide 2 kilotons per annum of graphite to LG Energy Solution Ltd. active anode material (AAM) from 2025 and increase it to at least 10 ktpa after its production capacity at its Vidalia facility in Louisiana.
9. What pricing options are available for accessing the report?
Pricing options include single-user, multi-user, and enterprise licenses priced at USD 4750, USD 5250, and USD 8750 respectively.
10. Is the market size provided in terms of value or volume?
The market size is provided in terms of value, measured in billion and volume, measured in K Tons.
11. Are there any specific market keywords associated with the report?
Yes, the market keyword associated with the report is "Graphite Market," which aids in identifying and referencing the specific market segment covered.
12. How do I determine which pricing option suits my needs best?
The pricing options vary based on user requirements and access needs. Individual users may opt for single-user licenses, while businesses requiring broader access may choose multi-user or enterprise licenses for cost-effective access to the report.
13. Are there any additional resources or data provided in the Graphite Market report?
While the report offers comprehensive insights, it's advisable to review the specific contents or supplementary materials provided to ascertain if additional resources or data are available.
14. How can I stay updated on further developments or reports in the Graphite Market?
To stay informed about further developments, trends, and reports in the Graphite Market, consider subscribing to industry newsletters, following relevant companies and organizations, or regularly checking reputable industry news sources and publications.
Methodology
Step 1 - Identification of Relevant Samples Size from Population Database


Step 2 - Approaches for Defining Global Market Size (Value, Volume* & Price*)

Note*: In applicable scenarios
Step 3 - Data Sources
Primary Research
- Web Analytics
- Survey Reports
- Research Institute
- Latest Research Reports
- Opinion Leaders
Secondary Research
- Annual Reports
- White Paper
- Latest Press Release
- Industry Association
- Paid Database
- Investor Presentations

Step 4 - Data Triangulation
Involves using different sources of information in order to increase the validity of a study
These sources are likely to be stakeholders in a program - participants, other researchers, program staff, other community members, and so on.
Then we put all data in single framework & apply various statistical tools to find out the dynamic on the market.
During the analysis stage, feedback from the stakeholder groups would be compared to determine areas of agreement as well as areas of divergence