

Key Insights
The global graphite electrode market, estimated at $4.48 billion in 2025, is poised for robust expansion. This growth is primarily propelled by escalating demand from the steel sector, particularly within rapidly industrializing emerging economies. Steel production volume directly correlates with graphite electrode consumption, further amplified by ongoing infrastructure development and automotive manufacturing. Technological innovations aimed at enhancing electrode quality, durability, and energy efficiency are also significant growth drivers. While secondary, the burgeoning electric vehicle (EV) market indirectly stimulates demand due to graphite's essential role in EV batteries. Key challenges include raw material price volatility, such as petroleum and needle coke, and the financial implications of stringent environmental regulations mandating cleaner production methods. Intense competition among established and new market participants fosters price competition and drives innovation.
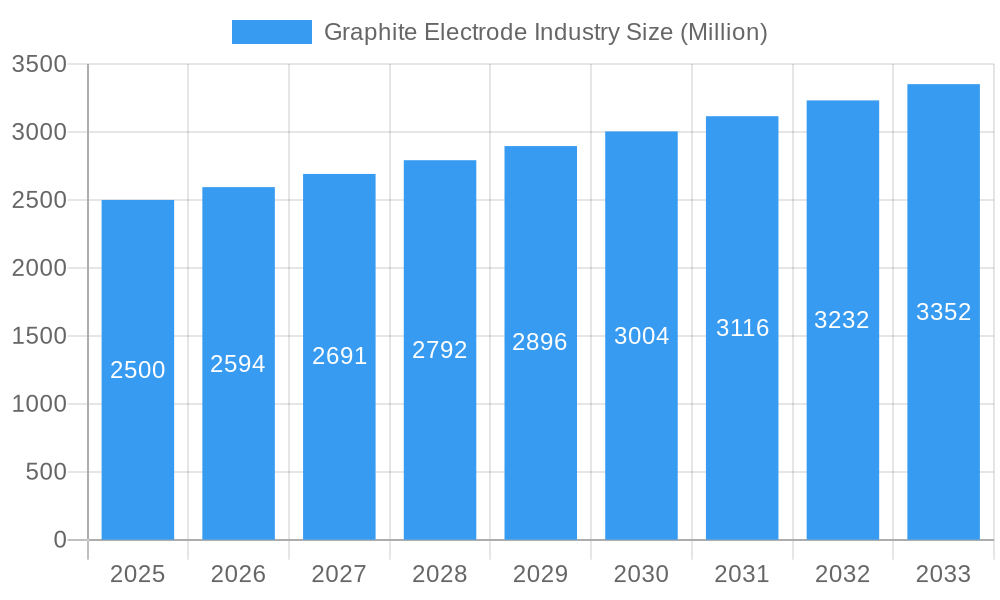
Graphite Electrode Industry Market Size (In Billion)
The market is projected to grow at a compound annual growth rate (CAGR) of 6.48% from 2025 to 2033, signaling substantial expansion. Growth trajectories will vary regionally, with faster development anticipated in areas undergoing rapid industrialization and infrastructure enhancement. Key market segments encompass diverse electrode types, including high-power and ultra-high-power options, and applications within steelmaking, notably Electric Arc Furnace (EAF) processes. The competitive arena features a blend of global corporations and regional entities, all pursuing market share through strategic alliances, production capacity increases, and technological advancements. Sustainable success in this dynamic market necessitates careful management of raw material expenses, environmental considerations, and competitive pressures.
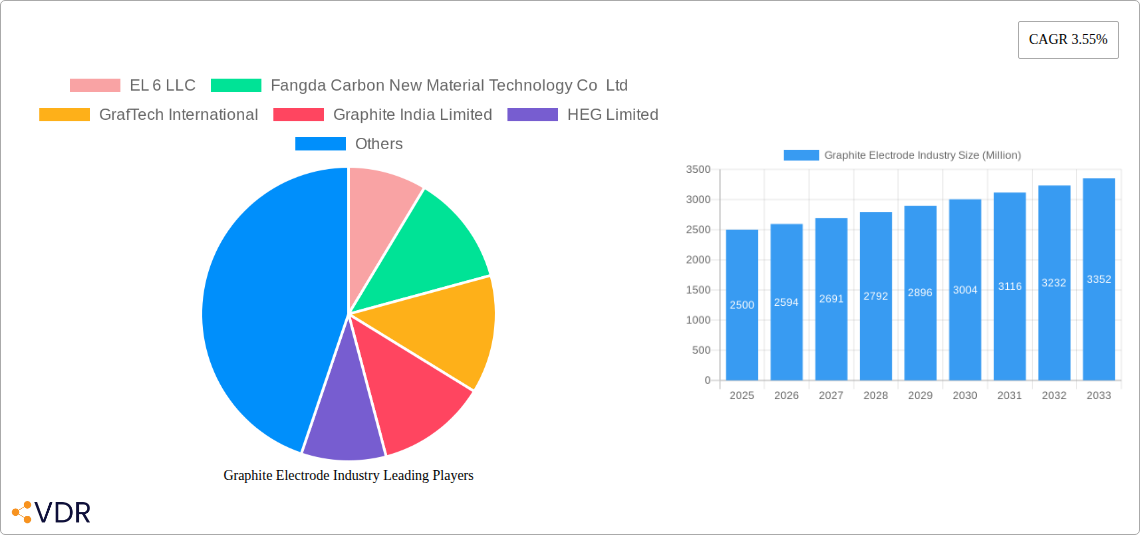
Graphite Electrode Industry Company Market Share
Graphite Electrode Industry Market Report: 2019-2033
This comprehensive report provides a detailed analysis of the Graphite Electrode industry, encompassing market dynamics, growth trends, regional dominance, product landscape, key players, and future outlook. The study period covers 2019-2033, with 2025 as the base and estimated year. The report utilizes a robust methodology, incorporating both qualitative and quantitative data to offer actionable insights for industry professionals and stakeholders. The parent market is the carbon and graphite materials market and the child market is specifically graphite electrodes.
Study Period: 2019-2033 Base Year: 2025 Estimated Year: 2025 Forecast Period: 2025-2033 Historical Period: 2019-2024
Graphite Electrode Industry Market Dynamics & Structure
The graphite electrode market is characterized by moderate concentration, with key players holding significant market share. Technological innovation, particularly in improving electrode performance and lifespan, is a crucial driver. Stringent environmental regulations concerning emissions and waste disposal significantly influence manufacturing practices. Competitive substitutes, such as alternative materials in steelmaking, pose a challenge. The end-user demographic is primarily steel producers, with varying demand based on global steel production levels. Mergers and acquisitions (M&A) activity has been moderate, reflecting consolidation within the industry. For example, xx% of M&A deals between 2021-2023 involved top ten players.
- Market Concentration: Moderately concentrated, with top 5 players holding xx% market share in 2024.
- Technological Innovation: Focus on enhanced conductivity, improved durability, and reduced energy consumption.
- Regulatory Framework: Stringent environmental regulations impacting manufacturing processes and waste management.
- Competitive Substitutes: Alternative materials in steelmaking present a competitive threat.
- End-User Demographics: Primarily steel producers globally.
- M&A Trends: Moderate consolidation activity, with xx deals recorded between 2019-2024.
Graphite Electrode Industry Growth Trends & Insights
The graphite electrode market has experienced steady growth driven by increasing global steel production and demand for higher-performance electrodes. The compound annual growth rate (CAGR) during the historical period (2019-2024) was approximately xx%, with market size reaching xx Million in 2024. Technological disruptions, such as the development of advanced graphite materials, are expected to further accelerate growth. Consumer behavior shifts toward sustainable steel production practices are also influencing market dynamics. Market penetration is projected to increase by xx% by 2033, reaching a market size of xx Million.
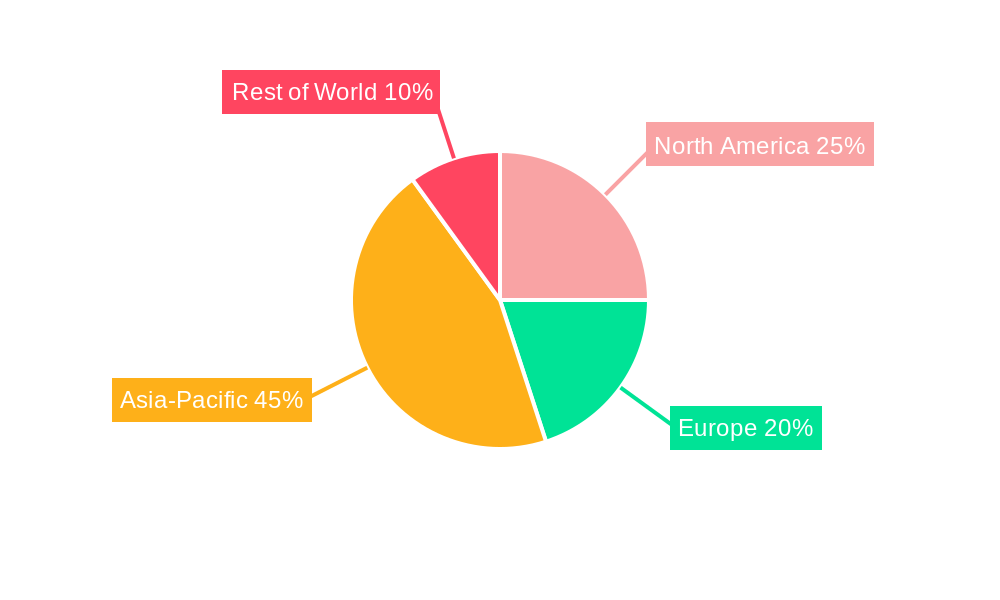
Dominant Regions, Countries, or Segments in Graphite Electrode Industry
China continues to dominate the graphite electrode market, driven by its substantial steel production capacity and robust domestic demand. Other key regions include Europe and North America. The strong economic growth and industrialization in China, coupled with favorable government policies supporting steel production, are primary drivers of its market leadership. The region holds xx% of the global market share and is predicted to grow at a CAGR of xx% from 2025 to 2033.
- Key Drivers in China: Strong steel production capacity, supportive government policies, and robust domestic demand.
- Other Key Regions: Europe and North America, exhibiting steady growth driven by industrial activity and infrastructure development.
- Market Share: China holds the largest market share (xx%), followed by Region/Country and Region/Country
Graphite Electrode Industry Product Landscape
Graphite electrodes are categorized based on size, grade, and application. Recent innovations focus on improving electrical conductivity, reducing consumption, and enhancing service life. Unique selling propositions (USPs) often hinge on superior quality, consistent performance, and tailored specifications to meet customer needs. Technological advancements center around material science and manufacturing techniques to create increasingly durable and efficient electrodes.
Key Drivers, Barriers & Challenges in Graphite Electrode Industry
Key Drivers:
- Increasing global steel production
- Demand for higher-performance electrodes
- Technological advancements in material science.
Challenges & Restraints:
- Fluctuations in raw material prices
- Stringent environmental regulations and compliance costs (estimated impact on margins - xx%)
- Intense competition from established players and emerging markets.
Emerging Opportunities in Graphite Electrode Industry
Emerging opportunities lie in the development of specialized graphite electrodes for niche applications in industries beyond steelmaking, such as aluminum smelting and the growing renewable energy sector. Untapped markets in developing economies present significant growth potential. Evolving consumer preferences toward sustainable materials further propel innovation and market expansion.
Growth Accelerators in the Graphite Electrode Industry
Long-term growth in the graphite electrode market will be propelled by continuous innovation in material science, leading to higher efficiency and performance of electrodes. Strategic partnerships between electrode manufacturers and steel producers will enhance supply chain integration and optimize production processes. Expansion into new markets, particularly in developing economies, offers considerable growth potential.
Key Players Shaping the Graphite Electrode Industry Market
- EL 6 LLC
- Fangda Carbon New Material Technology Co Ltd
- GrafTech International (GrafTech International)
- Graphite India Limited (Graphite India Limited)
- HEG Limited (HEG Limited)
- Kaifeng Pingmei New Carbon Materials Technology Co Ltd
- Liaoning Dantan Technology Group Co Ltd (Dan Carbon)
- Nantong Yangzi Carbon Co Ltd
- Nippon Carbon Co Ltd (Nippon Carbon Co Ltd)
- Sangraf International Inc
- SEC Carbon Limited
- Resonac Holdings Corporation (Resonac Holdings Corporation)
- Tokai Carbon Co Ltd (Tokai Carbon Co Ltd)
- Zhongze Group
- List Not Exhaustive
Notable Milestones in Graphite Electrode Industry Sector
- January 2023: Showa Denko K.K. (SDK) and Showa Denko Materials Co., Ltd. merged, forming Resonac Holdings Corporation and Resonac Corporation, significantly impacting the graphite electrode sector through streamlined operations and supply chains.
In-Depth Graphite Electrode Industry Market Outlook
The graphite electrode market is poised for sustained growth, driven by increasing steel production, technological advancements, and expansion into new applications. Strategic partnerships and investments in R&D will play a critical role in shaping future market dynamics. The focus on sustainability and energy efficiency will further propel the demand for high-performance and environmentally friendly graphite electrodes, creating significant opportunities for innovative players.
Graphite Electrode Industry Segmentation
-
1. Electrode Grade
- 1.1. Ultra High Power (UHP)
- 1.2. High Power (SHP)
- 1.3. Regular Power (RP)
-
2. Application
- 2.1. Electric Arc Furnace
- 2.2. Basic Oxygen Furnace
- 2.3. Non-steel Application
Graphite Electrode Industry Segmentation By Geography
-
1. Asia Pacific
- 1.1. China
- 1.2. India
- 1.3. Japan
- 1.4. South Korea
- 1.5. Malaysia
- 1.6. Thailand
- 1.7. Indonesia
- 1.8. Vietnam
- 1.9. Rest of Asia Pacific
-
2. North America
- 2.1. United States
- 2.2. Canada
- 2.3. Mexico
-
3. Europe
- 3.1. Germany
- 3.2. United Kingdom
- 3.3. France
- 3.4. Italy
- 3.5. Spain
- 3.6. Nordic Countries
- 3.7. Turkey
- 3.8. Russia
- 3.9. Rest of Europe
-
4. South America
- 4.1. Brazil
- 4.2. Argentina
- 4.3. Colombia
- 4.4. Rest of South America
-
5. Middle East and Africa
- 5.1. Saudi Arabia
- 5.2. Qatar
- 5.3. United Arab Emirates
- 5.4. Egypt
- 5.5. South Africa
- 5.6. Rest of Middle East and Africa
Graphite Electrode Industry Regional Market Share
Geographic Coverage of Graphite Electrode Industry
Graphite Electrode Industry REPORT HIGHLIGHTS
| Aspects | Details |
|---|---|
| Study Period | 2020-2034 |
| Base Year | 2025 |
| Estimated Year | 2026 |
| Forecast Period | 2026-2034 |
| Historical Period | 2020-2025 |
| Growth Rate | CAGR of 6.48% from 2020-2034 |
| Segmentation |
|
Table of Contents
- 1. Introduction
- 1.1. Research Scope
- 1.2. Market Segmentation
- 1.3. Research Objective
- 1.4. Definitions and Assumptions
- 2. Executive Summary
- 2.1. Market Snapshot
- 3. Market Dynamics
- 3.1. Market Drivers
- 3.2. Market Restrains
- 3.3. Market Trends
- 3.4. Market Opportunities
- 4. Market Factor Analysis
- 4.1. Porters Five Forces
- 4.1.1. Bargaining Power of Suppliers
- 4.1.2. Bargaining Power of Buyers
- 4.1.3. Threat of New Entrants
- 4.1.4. Threat of Substitutes
- 4.1.5. Competitive Rivalry
- 4.2. PESTEL analysis
- 4.3. BCG Analysis
- 4.3.1. Stars (High Growth, High Market Share)
- 4.3.2. Cash Cows (Low Growth, High Market Share)
- 4.3.3. Question Mark (High Growth, Low Market Share)
- 4.3.4. Dogs (Low Growth, Low Market Share)
- 4.4. Ansoff Matrix Analysis
- 4.5. Supply Chain Analysis
- 4.6. Regulatory Landscape
- 4.7. Current Market Potential and Opportunity Assessment (TAM–SAM–SOM Framework)
- 4.8. VDR Analyst Note
- 4.1. Porters Five Forces
- 5. Market Analysis, Insights and Forecast 2021-2033
- 5.1. Market Analysis, Insights and Forecast - by Electrode Grade
- 5.1.1. Ultra High Power (UHP)
- 5.1.2. High Power (SHP)
- 5.1.3. Regular Power (RP)
- 5.2. Market Analysis, Insights and Forecast - by Application
- 5.2.1. Electric Arc Furnace
- 5.2.2. Basic Oxygen Furnace
- 5.2.3. Non-steel Application
- 5.3. Market Analysis, Insights and Forecast - by Region
- 5.3.1. Asia Pacific
- 5.3.2. North America
- 5.3.3. Europe
- 5.3.4. South America
- 5.3.5. Middle East and Africa
- 5.1. Market Analysis, Insights and Forecast - by Electrode Grade
- 6. Global Graphite Electrode Industry Analysis, Insights and Forecast, 2021-2033
- 6.1. Market Analysis, Insights and Forecast - by Electrode Grade
- 6.1.1. Ultra High Power (UHP)
- 6.1.2. High Power (SHP)
- 6.1.3. Regular Power (RP)
- 6.2. Market Analysis, Insights and Forecast - by Application
- 6.2.1. Electric Arc Furnace
- 6.2.2. Basic Oxygen Furnace
- 6.2.3. Non-steel Application
- 6.1. Market Analysis, Insights and Forecast - by Electrode Grade
- 7. Asia Pacific Graphite Electrode Industry Analysis, Insights and Forecast, 2021-2033
- 7.1. Market Analysis, Insights and Forecast - by Electrode Grade
- 7.1.1. Ultra High Power (UHP)
- 7.1.2. High Power (SHP)
- 7.1.3. Regular Power (RP)
- 7.2. Market Analysis, Insights and Forecast - by Application
- 7.2.1. Electric Arc Furnace
- 7.2.2. Basic Oxygen Furnace
- 7.2.3. Non-steel Application
- 7.1. Market Analysis, Insights and Forecast - by Electrode Grade
- 8. North America Graphite Electrode Industry Analysis, Insights and Forecast, 2021-2033
- 8.1. Market Analysis, Insights and Forecast - by Electrode Grade
- 8.1.1. Ultra High Power (UHP)
- 8.1.2. High Power (SHP)
- 8.1.3. Regular Power (RP)
- 8.2. Market Analysis, Insights and Forecast - by Application
- 8.2.1. Electric Arc Furnace
- 8.2.2. Basic Oxygen Furnace
- 8.2.3. Non-steel Application
- 8.1. Market Analysis, Insights and Forecast - by Electrode Grade
- 9. Europe Graphite Electrode Industry Analysis, Insights and Forecast, 2021-2033
- 9.1. Market Analysis, Insights and Forecast - by Electrode Grade
- 9.1.1. Ultra High Power (UHP)
- 9.1.2. High Power (SHP)
- 9.1.3. Regular Power (RP)
- 9.2. Market Analysis, Insights and Forecast - by Application
- 9.2.1. Electric Arc Furnace
- 9.2.2. Basic Oxygen Furnace
- 9.2.3. Non-steel Application
- 9.1. Market Analysis, Insights and Forecast - by Electrode Grade
- 10. South America Graphite Electrode Industry Analysis, Insights and Forecast, 2021-2033
- 10.1. Market Analysis, Insights and Forecast - by Electrode Grade
- 10.1.1. Ultra High Power (UHP)
- 10.1.2. High Power (SHP)
- 10.1.3. Regular Power (RP)
- 10.2. Market Analysis, Insights and Forecast - by Application
- 10.2.1. Electric Arc Furnace
- 10.2.2. Basic Oxygen Furnace
- 10.2.3. Non-steel Application
- 10.1. Market Analysis, Insights and Forecast - by Electrode Grade
- 11. Middle East and Africa Graphite Electrode Industry Analysis, Insights and Forecast, 2021-2033
- 11.1. Market Analysis, Insights and Forecast - by Electrode Grade
- 11.1.1. Ultra High Power (UHP)
- 11.1.2. High Power (SHP)
- 11.1.3. Regular Power (RP)
- 11.2. Market Analysis, Insights and Forecast - by Application
- 11.2.1. Electric Arc Furnace
- 11.2.2. Basic Oxygen Furnace
- 11.2.3. Non-steel Application
- 11.1. Market Analysis, Insights and Forecast - by Electrode Grade
- 12. Competitive Analysis
- 12.1. Company Profiles
- 12.1.1 EL 6 LLC
- 12.1.1.1. Company Overview
- 12.1.1.2. Products
- 12.1.1.3. Company Financials
- 12.1.1.4. SWOT Analysis
- 12.1.2 Fangda Carbon New Material Technology Co Ltd
- 12.1.2.1. Company Overview
- 12.1.2.2. Products
- 12.1.2.3. Company Financials
- 12.1.2.4. SWOT Analysis
- 12.1.3 GrafTech International
- 12.1.3.1. Company Overview
- 12.1.3.2. Products
- 12.1.3.3. Company Financials
- 12.1.3.4. SWOT Analysis
- 12.1.4 Graphite India Limited
- 12.1.4.1. Company Overview
- 12.1.4.2. Products
- 12.1.4.3. Company Financials
- 12.1.4.4. SWOT Analysis
- 12.1.5 HEG Limited
- 12.1.5.1. Company Overview
- 12.1.5.2. Products
- 12.1.5.3. Company Financials
- 12.1.5.4. SWOT Analysis
- 12.1.6 Kaifeng Pingmei New Carbon Materials Technology Co Ltd
- 12.1.6.1. Company Overview
- 12.1.6.2. Products
- 12.1.6.3. Company Financials
- 12.1.6.4. SWOT Analysis
- 12.1.7 Liaoning Dantan Technology Group Co Ltd (Dan Carbon)
- 12.1.7.1. Company Overview
- 12.1.7.2. Products
- 12.1.7.3. Company Financials
- 12.1.7.4. SWOT Analysis
- 12.1.8 Nantong Yangzi Carbon Co Ltd
- 12.1.8.1. Company Overview
- 12.1.8.2. Products
- 12.1.8.3. Company Financials
- 12.1.8.4. SWOT Analysis
- 12.1.9 Nippon Carbon Co Ltd
- 12.1.9.1. Company Overview
- 12.1.9.2. Products
- 12.1.9.3. Company Financials
- 12.1.9.4. SWOT Analysis
- 12.1.10 Sangraf International Inc
- 12.1.10.1. Company Overview
- 12.1.10.2. Products
- 12.1.10.3. Company Financials
- 12.1.10.4. SWOT Analysis
- 12.1.11 SEC Carbon Limited
- 12.1.11.1. Company Overview
- 12.1.11.2. Products
- 12.1.11.3. Company Financials
- 12.1.11.4. SWOT Analysis
- 12.1.12 Resonac Holdings Corporation
- 12.1.12.1. Company Overview
- 12.1.12.2. Products
- 12.1.12.3. Company Financials
- 12.1.12.4. SWOT Analysis
- 12.1.13 Tokai Carbon Co Ltd
- 12.1.13.1. Company Overview
- 12.1.13.2. Products
- 12.1.13.3. Company Financials
- 12.1.13.4. SWOT Analysis
- 12.1.14 Zhongze Group*List Not Exhaustive
- 12.1.14.1. Company Overview
- 12.1.14.2. Products
- 12.1.14.3. Company Financials
- 12.1.14.4. SWOT Analysis
- 12.1.1 EL 6 LLC
- 12.2. Market Entropy
- 12.2.1 Company's Key Areas Served
- 12.2.2 Recent Developments
- 12.3. Company Market Share Analysis 2025
- 12.3.1 Top 5 Companies Market Share Analysis
- 12.3.2 Top 3 Companies Market Share Analysis
- 12.4. List of Potential Customers
- 13. Research Methodology
List of Figures
- Figure 1: Global Graphite Electrode Industry Revenue Breakdown (billion, %) by Region 2025 & 2033
- Figure 2: Asia Pacific Graphite Electrode Industry Revenue (billion), by Electrode Grade 2025 & 2033
- Figure 3: Asia Pacific Graphite Electrode Industry Revenue Share (%), by Electrode Grade 2025 & 2033
- Figure 4: Asia Pacific Graphite Electrode Industry Revenue (billion), by Application 2025 & 2033
- Figure 5: Asia Pacific Graphite Electrode Industry Revenue Share (%), by Application 2025 & 2033
- Figure 6: Asia Pacific Graphite Electrode Industry Revenue (billion), by Country 2025 & 2033
- Figure 7: Asia Pacific Graphite Electrode Industry Revenue Share (%), by Country 2025 & 2033
- Figure 8: North America Graphite Electrode Industry Revenue (billion), by Electrode Grade 2025 & 2033
- Figure 9: North America Graphite Electrode Industry Revenue Share (%), by Electrode Grade 2025 & 2033
- Figure 10: North America Graphite Electrode Industry Revenue (billion), by Application 2025 & 2033
- Figure 11: North America Graphite Electrode Industry Revenue Share (%), by Application 2025 & 2033
- Figure 12: North America Graphite Electrode Industry Revenue (billion), by Country 2025 & 2033
- Figure 13: North America Graphite Electrode Industry Revenue Share (%), by Country 2025 & 2033
- Figure 14: Europe Graphite Electrode Industry Revenue (billion), by Electrode Grade 2025 & 2033
- Figure 15: Europe Graphite Electrode Industry Revenue Share (%), by Electrode Grade 2025 & 2033
- Figure 16: Europe Graphite Electrode Industry Revenue (billion), by Application 2025 & 2033
- Figure 17: Europe Graphite Electrode Industry Revenue Share (%), by Application 2025 & 2033
- Figure 18: Europe Graphite Electrode Industry Revenue (billion), by Country 2025 & 2033
- Figure 19: Europe Graphite Electrode Industry Revenue Share (%), by Country 2025 & 2033
- Figure 20: South America Graphite Electrode Industry Revenue (billion), by Electrode Grade 2025 & 2033
- Figure 21: South America Graphite Electrode Industry Revenue Share (%), by Electrode Grade 2025 & 2033
- Figure 22: South America Graphite Electrode Industry Revenue (billion), by Application 2025 & 2033
- Figure 23: South America Graphite Electrode Industry Revenue Share (%), by Application 2025 & 2033
- Figure 24: South America Graphite Electrode Industry Revenue (billion), by Country 2025 & 2033
- Figure 25: South America Graphite Electrode Industry Revenue Share (%), by Country 2025 & 2033
- Figure 26: Middle East and Africa Graphite Electrode Industry Revenue (billion), by Electrode Grade 2025 & 2033
- Figure 27: Middle East and Africa Graphite Electrode Industry Revenue Share (%), by Electrode Grade 2025 & 2033
- Figure 28: Middle East and Africa Graphite Electrode Industry Revenue (billion), by Application 2025 & 2033
- Figure 29: Middle East and Africa Graphite Electrode Industry Revenue Share (%), by Application 2025 & 2033
- Figure 30: Middle East and Africa Graphite Electrode Industry Revenue (billion), by Country 2025 & 2033
- Figure 31: Middle East and Africa Graphite Electrode Industry Revenue Share (%), by Country 2025 & 2033
List of Tables
- Table 1: Global Graphite Electrode Industry Revenue billion Forecast, by Electrode Grade 2020 & 2033
- Table 2: Global Graphite Electrode Industry Revenue billion Forecast, by Application 2020 & 2033
- Table 3: Global Graphite Electrode Industry Revenue billion Forecast, by Region 2020 & 2033
- Table 4: Global Graphite Electrode Industry Revenue billion Forecast, by Electrode Grade 2020 & 2033
- Table 5: Global Graphite Electrode Industry Revenue billion Forecast, by Application 2020 & 2033
- Table 6: Global Graphite Electrode Industry Revenue billion Forecast, by Country 2020 & 2033
- Table 7: China Graphite Electrode Industry Revenue (billion) Forecast, by Application 2020 & 2033
- Table 8: India Graphite Electrode Industry Revenue (billion) Forecast, by Application 2020 & 2033
- Table 9: Japan Graphite Electrode Industry Revenue (billion) Forecast, by Application 2020 & 2033
- Table 10: South Korea Graphite Electrode Industry Revenue (billion) Forecast, by Application 2020 & 2033
- Table 11: Malaysia Graphite Electrode Industry Revenue (billion) Forecast, by Application 2020 & 2033
- Table 12: Thailand Graphite Electrode Industry Revenue (billion) Forecast, by Application 2020 & 2033
- Table 13: Indonesia Graphite Electrode Industry Revenue (billion) Forecast, by Application 2020 & 2033
- Table 14: Vietnam Graphite Electrode Industry Revenue (billion) Forecast, by Application 2020 & 2033
- Table 15: Rest of Asia Pacific Graphite Electrode Industry Revenue (billion) Forecast, by Application 2020 & 2033
- Table 16: Global Graphite Electrode Industry Revenue billion Forecast, by Electrode Grade 2020 & 2033
- Table 17: Global Graphite Electrode Industry Revenue billion Forecast, by Application 2020 & 2033
- Table 18: Global Graphite Electrode Industry Revenue billion Forecast, by Country 2020 & 2033
- Table 19: United States Graphite Electrode Industry Revenue (billion) Forecast, by Application 2020 & 2033
- Table 20: Canada Graphite Electrode Industry Revenue (billion) Forecast, by Application 2020 & 2033
- Table 21: Mexico Graphite Electrode Industry Revenue (billion) Forecast, by Application 2020 & 2033
- Table 22: Global Graphite Electrode Industry Revenue billion Forecast, by Electrode Grade 2020 & 2033
- Table 23: Global Graphite Electrode Industry Revenue billion Forecast, by Application 2020 & 2033
- Table 24: Global Graphite Electrode Industry Revenue billion Forecast, by Country 2020 & 2033
- Table 25: Germany Graphite Electrode Industry Revenue (billion) Forecast, by Application 2020 & 2033
- Table 26: United Kingdom Graphite Electrode Industry Revenue (billion) Forecast, by Application 2020 & 2033
- Table 27: France Graphite Electrode Industry Revenue (billion) Forecast, by Application 2020 & 2033
- Table 28: Italy Graphite Electrode Industry Revenue (billion) Forecast, by Application 2020 & 2033
- Table 29: Spain Graphite Electrode Industry Revenue (billion) Forecast, by Application 2020 & 2033
- Table 30: Nordic Countries Graphite Electrode Industry Revenue (billion) Forecast, by Application 2020 & 2033
- Table 31: Turkey Graphite Electrode Industry Revenue (billion) Forecast, by Application 2020 & 2033
- Table 32: Russia Graphite Electrode Industry Revenue (billion) Forecast, by Application 2020 & 2033
- Table 33: Rest of Europe Graphite Electrode Industry Revenue (billion) Forecast, by Application 2020 & 2033
- Table 34: Global Graphite Electrode Industry Revenue billion Forecast, by Electrode Grade 2020 & 2033
- Table 35: Global Graphite Electrode Industry Revenue billion Forecast, by Application 2020 & 2033
- Table 36: Global Graphite Electrode Industry Revenue billion Forecast, by Country 2020 & 2033
- Table 37: Brazil Graphite Electrode Industry Revenue (billion) Forecast, by Application 2020 & 2033
- Table 38: Argentina Graphite Electrode Industry Revenue (billion) Forecast, by Application 2020 & 2033
- Table 39: Colombia Graphite Electrode Industry Revenue (billion) Forecast, by Application 2020 & 2033
- Table 40: Rest of South America Graphite Electrode Industry Revenue (billion) Forecast, by Application 2020 & 2033
- Table 41: Global Graphite Electrode Industry Revenue billion Forecast, by Electrode Grade 2020 & 2033
- Table 42: Global Graphite Electrode Industry Revenue billion Forecast, by Application 2020 & 2033
- Table 43: Global Graphite Electrode Industry Revenue billion Forecast, by Country 2020 & 2033
- Table 44: Saudi Arabia Graphite Electrode Industry Revenue (billion) Forecast, by Application 2020 & 2033
- Table 45: Qatar Graphite Electrode Industry Revenue (billion) Forecast, by Application 2020 & 2033
- Table 46: United Arab Emirates Graphite Electrode Industry Revenue (billion) Forecast, by Application 2020 & 2033
- Table 47: Egypt Graphite Electrode Industry Revenue (billion) Forecast, by Application 2020 & 2033
- Table 48: South Africa Graphite Electrode Industry Revenue (billion) Forecast, by Application 2020 & 2033
- Table 49: Rest of Middle East and Africa Graphite Electrode Industry Revenue (billion) Forecast, by Application 2020 & 2033
Frequently Asked Questions
1. What is the projected Compound Annual Growth Rate (CAGR) of the Graphite Electrode Industry?
The projected CAGR is approximately 6.48%.
2. Which companies are prominent players in the Graphite Electrode Industry?
Key companies in the market include EL 6 LLC, Fangda Carbon New Material Technology Co Ltd, GrafTech International, Graphite India Limited, HEG Limited, Kaifeng Pingmei New Carbon Materials Technology Co Ltd, Liaoning Dantan Technology Group Co Ltd (Dan Carbon), Nantong Yangzi Carbon Co Ltd, Nippon Carbon Co Ltd, Sangraf International Inc, SEC Carbon Limited, Resonac Holdings Corporation, Tokai Carbon Co Ltd, Zhongze Group*List Not Exhaustive.
3. What are the main segments of the Graphite Electrode Industry?
The market segments include Electrode Grade , Application.
4. Can you provide details about the market size?
The market size is estimated to be USD 4.48 billion as of 2022.
5. What are some drivers contributing to market growth?
Strong Demand for EAF Technology for Steelmaking; Rising Availability of Steel Scrap in China.
6. What are the notable trends driving market growth?
The Electric Arc Furnace Segment to Dominate the Market.
7. Are there any restraints impacting market growth?
Strong Demand for EAF Technology for Steelmaking; Rising Availability of Steel Scrap in China.
8. Can you provide examples of recent developments in the market?
January 2023: Showa Denko K.K. (SDK) and Showa Denko Materials Co. Ltd (formerly Hitachi Chemical Company Ltd) underwent a merger. This transformation gave rise to two distinct entities, i.e., a holding company, now known as "Resonac Holdings Corporation," and a manufacturing company, named "Resonac Corporation." This merger consolidated both companies' operations, particularly in the graphite electrode sector, streamlining their manufacturing and supply chains.
9. What pricing options are available for accessing the report?
Pricing options include single-user, multi-user, and enterprise licenses priced at USD 4750, USD 5250, and USD 8750 respectively.
10. Is the market size provided in terms of value or volume?
The market size is provided in terms of value, measured in billion.
11. Are there any specific market keywords associated with the report?
Yes, the market keyword associated with the report is "Graphite Electrode Industry," which aids in identifying and referencing the specific market segment covered.
12. How do I determine which pricing option suits my needs best?
The pricing options vary based on user requirements and access needs. Individual users may opt for single-user licenses, while businesses requiring broader access may choose multi-user or enterprise licenses for cost-effective access to the report.
13. Are there any additional resources or data provided in the Graphite Electrode Industry report?
While the report offers comprehensive insights, it's advisable to review the specific contents or supplementary materials provided to ascertain if additional resources or data are available.
14. How can I stay updated on further developments or reports in the Graphite Electrode Industry?
To stay informed about further developments, trends, and reports in the Graphite Electrode Industry, consider subscribing to industry newsletters, following relevant companies and organizations, or regularly checking reputable industry news sources and publications.
Methodology
Step 1 - Identification of Relevant Samples Size from Population Database


Step 2 - Approaches for Defining Global Market Size (Value, Volume* & Price*)

Note*: In applicable scenarios
Step 3 - Data Sources
Primary Research
- Web Analytics
- Survey Reports
- Research Institute
- Latest Research Reports
- Opinion Leaders
Secondary Research
- Annual Reports
- White Paper
- Latest Press Release
- Industry Association
- Paid Database
- Investor Presentations

Step 4 - Data Triangulation
Involves using different sources of information in order to increase the validity of a study
These sources are likely to be stakeholders in a program - participants, other researchers, program staff, other community members, and so on.
Then we put all data in single framework & apply various statistical tools to find out the dynamic on the market.
During the analysis stage, feedback from the stakeholder groups would be compared to determine areas of agreement as well as areas of divergence