

Key Insights
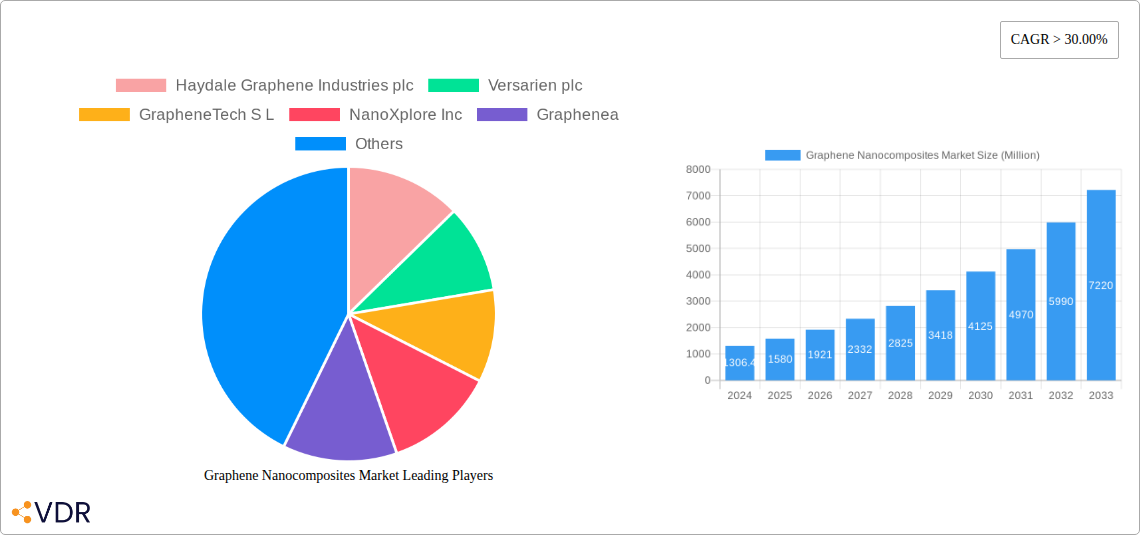
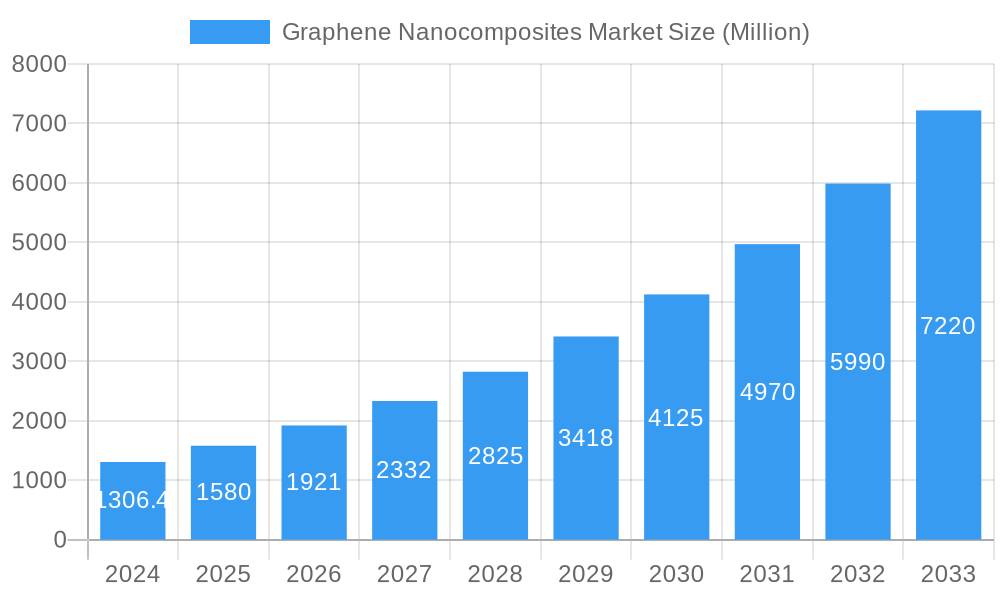
The global Graphene Nanocomposites Market is poised for remarkable expansion, projected to reach an estimated USD 1306.4 million in 2024, and is expected to witness a robust compound annual growth rate (CAGR) of 22.6% during the forecast period of 2025-2033. This significant growth is primarily driven by the exceptional properties of graphene, including its superior electrical conductivity, mechanical strength, and thermal stability, which are increasingly being leveraged across diverse industrial applications. Key sectors such as Electrical and Electronics, Medical, Automotive and Aerospace, and Building and Construction are actively adopting graphene nanocomposites to enhance product performance, enable miniaturization, and develop innovative materials. The rising demand for lightweight yet durable materials in the automotive and aerospace industries, coupled with the need for advanced conductive materials in electronics, are significant accelerators for market penetration. Furthermore, the burgeoning use of graphene nanocomposites in medical devices for improved biocompatibility and drug delivery systems is contributing to its upward trajectory.
Graphene Nanocomposites Market Market Size (In Billion)
The market is characterized by several emerging trends, including advancements in manufacturing techniques for producing high-quality graphene materials more efficiently and cost-effectively, and the development of novel nanocomposite formulations tailored for specific performance requirements. The increasing investment in research and development by both established players and startups is fueling innovation and expanding the application spectrum of graphene nanocomposites. While the market exhibits immense potential, certain restraints, such as the high production cost of graphene and the need for standardized testing and regulatory frameworks, need to be addressed for sustained growth. However, the inherent advantages and the relentless pursuit of technological advancements are expected to outweigh these challenges, propelling the graphene nanocomposites market to new heights of innovation and commercial success in the coming years.
Graphene Nanocomposites Market Company Market Share
Graphene Nanocomposites Market: Unveiling the Future of Advanced Materials
Report Description:
This comprehensive report offers an in-depth analysis of the global graphene nanocomposites market, a rapidly evolving sector poised for significant expansion. Delve into the intricate market dynamics, growth trends, dominant regions, product landscape, and key players shaping the future of advanced materials. Explore the transformative impact of graphene, from its nascent stages to its widespread adoption across diverse industries. This report provides actionable insights for stakeholders seeking to capitalize on the burgeoning opportunities within this high-potential market.
Study Period: 2019–2033 | Base Year: 2025 | Estimated Year: 2025 | Forecast Period: 2025–2033 | Historical Period: 2019–2024
Graphene Nanocomposites Market Market Dynamics & Structure
The graphene nanocomposites market is characterized by dynamic interplay between technological innovation, evolving regulatory landscapes, and intense competition. Market concentration is moderately fragmented, with several key players vying for market share, alongside a growing number of innovative startups. Technological innovation drivers are paramount, with continuous advancements in graphene synthesis, functionalization, and dispersion techniques fueling new applications and improved material performance. Regulatory frameworks, though still developing in some regions, are increasingly focusing on safety and standardization, influencing adoption rates and market entry barriers. Competitive product substitutes, such as carbon nanotubes and other advanced filler materials, are present, but graphene's unique properties – including exceptional strength, electrical conductivity, and thermal conductivity – offer distinct advantages. End-user demographics are broad, spanning industries with high demand for lightweight, durable, and conductive materials. Mergers & Acquisitions (M&A) trends indicate strategic consolidation and collaborations aimed at expanding production capacity, enhancing R&D capabilities, and gaining market access.
- Market Concentration: Moderately fragmented, with both established players and emerging innovators.
- Technological Innovation Drivers: Advancements in graphene synthesis, functionalization, and dispersion.
- Regulatory Frameworks: Evolving regulations impacting safety and standardization.
- Competitive Product Substitutes: Carbon nanotubes, advanced polymer additives.
- End-user Demographics: Diverse, with strong demand from electronics, automotive, and aerospace sectors.
- M&A Trends: Strategic partnerships and acquisitions for capacity expansion and market access.
Graphene Nanocomposites Market Growth Trends & Insights
The global graphene nanocomposites market is projected for substantial growth, driven by increasing demand for high-performance materials across a multitude of industries. Market size evolution is a testament to the escalating adoption of graphene-enhanced solutions, with the market expected to reach an estimated $2,850.5 million by 2025. Adoption rates are accelerating as the benefits of graphene – such as enhanced mechanical strength, improved electrical and thermal conductivity, and superior barrier properties – become more widely recognized and integrated into product designs. Technological disruptions are a constant, with ongoing research and development yielding novel applications in energy storage, advanced composites, and smart materials. Consumer behavior shifts, particularly the growing demand for sustainable, lightweight, and durable products, are further fueling market expansion.
The compound annual growth rate (CAGR) for the graphene nanocomposites market is estimated at 32.5% during the forecast period of 2025–2033, highlighting its rapid ascent. Market penetration is increasing across various sectors, from the Electrical and Electronics industry, where graphene nanocomposites enhance conductivity and reduce weight in devices, to the Automotive and Aerospace sectors, benefiting from lighter and stronger components. The Medical industry is exploring graphene for drug delivery systems and advanced diagnostics, while Building and Construction sees its application in more durable and energy-efficient materials. The Packaging sector is also recognizing the potential for improved barrier properties and recyclability. These evolving applications, coupled with ongoing innovation, paint a picture of robust and sustained market expansion.
Dominant Regions, Countries, or Segments in Graphene Nanocomposites Market
The Electrical and Electronics segment, specifically driven by demand for advanced materials in consumer electronics, semiconductors, and energy storage solutions, is emerging as a dominant force within the graphene nanocomposites market. The superior electrical conductivity and lightweight nature of graphene make it indispensable for next-generation electronic components, from flexible displays to high-performance batteries. Within this segment, North America and Asia Pacific are leading regions due to robust R&D infrastructure, strong manufacturing bases, and significant investments in nanotechnology.
Graphene Nano Platelets (GNP) stand out as the most impactful type of graphene nanocomposite, owing to their ease of dispersion and versatility in enhancing the properties of various matrices. Their widespread application in conductive inks, electrostatic discharge (ESD) protection, and thermal management solutions in electronics significantly contributes to their dominance.
In terms of end-user industries, the Electrical and Electronics sector is projected to hold the largest market share. This is driven by the relentless pursuit of miniaturization, increased energy efficiency, and enhanced performance in electronic devices. The burgeoning market for electric vehicles and advanced energy storage systems further amplifies the demand for graphene-enhanced materials within this sector.
- Dominant Segment (Type): Graphene Nano Platelets (GNP)
- Key Drivers: Ease of dispersion, versatility in polymer enhancement, application in conductive inks and ESD protection.
- Dominant Segment (End-user Industry): Electrical and Electronics
- Key Drivers: Demand for miniaturization, energy efficiency, enhanced performance in devices, growth of EVs and energy storage.
- Leading Regions: North America and Asia Pacific
- Dominance Factors: Strong R&D infrastructure, advanced manufacturing capabilities, significant investment in nanotechnology.
Graphene Nanocomposites Market Product Landscape
The graphene nanocomposites market is witnessing a surge in product innovations centered on enhancing material properties for niche applications. Key advancements include the development of highly conductive graphene inks for printed electronics, robust graphene-reinforced polymers for lightweight automotive and aerospace components, and advanced graphene coatings for improved corrosion resistance and thermal management. Performance metrics such as tensile strength, conductivity, and thermal dissipation are consistently being optimized. Unique selling propositions include superior strength-to-weight ratios, enhanced electrical and thermal conductivity, and improved wear resistance compared to traditional materials. Technological advancements are focused on scalable production methods, precise functionalization for specific end-uses, and cost-effective integration into existing manufacturing processes.
Key Drivers, Barriers & Challenges in Graphene Nanocomposites Market
The graphene nanocomposites market is propelled by several key drivers, including the escalating demand for lightweight and high-strength materials in industries like automotive and aerospace, driven by fuel efficiency and performance requirements. Technological advancements in graphene production and functionalization are making these materials more accessible and cost-effective. Furthermore, the growing applications in energy storage solutions, such as batteries and supercapacitors, and the increasing use in conductive inks for printed electronics are significant growth catalysts.
However, the market faces notable barriers and challenges. High production costs for high-quality graphene, coupled with complexities in achieving uniform dispersion within composite matrices, remain significant hurdles. Scaling up production to meet growing demand while maintaining quality and consistency is a considerable challenge. Regulatory uncertainties and the need for standardized testing and safety protocols can also impede widespread adoption. Intense competition from established advanced materials also poses a challenge, necessitating continuous innovation and demonstration of superior performance-to-cost ratios.
Emerging Opportunities in Graphene Nanocomposites Market
Emerging opportunities in the graphene nanocomposites market are abundant and span several innovative avenues. The development of graphene-enhanced smart textiles with integrated sensing and conductivity capabilities presents a significant untapped market. Advancements in medical applications, such as bio-compatible graphene for drug delivery, tissue engineering, and advanced diagnostics, offer substantial growth potential. Furthermore, the integration of graphene into sustainable building materials for enhanced durability and energy efficiency, as well as its use in advanced filtration and separation technologies, represent promising new frontiers. The increasing focus on circular economy principles is also driving research into graphene-based recycled composites.
Growth Accelerators in the Graphene Nanocomposites Market Industry
Several catalysts are accelerating the growth of the graphene nanocomposites market. Continuous breakthroughs in graphene synthesis, leading to higher yields and purer forms of graphene at reduced costs, are critical. Strategic partnerships between graphene manufacturers and end-user industries, such as collaborations between chemical companies and automotive manufacturers, are fostering application-specific development and market penetration. Government funding and research grants for nanotechnology initiatives worldwide are also playing a crucial role in R&D and market development. The increasing number of patents filed related to graphene nanocomposites indicates a strong pipeline of future innovations and commercialization efforts.
Key Players Shaping the Graphene Nanocomposites Market Market
- Haydale Graphene Industries plc.
- Versarien plc
- GrapheneTech S L
- NanoXplore Inc
- Graphenea
- Applied Graphene Materials
- XG Sciences
- Directa Plus S p A
- Abalonyx AS
- Aztrong
Notable Milestones in Graphene Nanocomposites Market Sector
- January 2022: Haydale Graphene Industries plc. announced the incorporation of graphene nano-platelets (GNPs) in its cosmetic face mask sheets and PPE face masks, with iCraft utilizing Haydale's functionalized GNPs in its graphene-coated fabric, THERMiT.
- March 2021: Haydale Graphene Industries plc. was awarded a GBP 1.1 million loan facility by Innovate UK Loans Limited. With the support of Innovate UK, Haydale planned to expand its capacity to manufacture functionalized nanomaterials, including graphene, to over 30 tons per annum.
In-Depth Graphene Nanocomposites Market Market Outlook
The outlook for the graphene nanocomposites market is exceptionally positive, fueled by ongoing technological advancements and expanding application horizons. Growth accelerators such as scalable production techniques, cost reductions, and a supportive regulatory environment will continue to drive market expansion. Strategic collaborations between research institutions and industry players are fostering innovation and accelerating the commercialization of novel graphene-based solutions. The increasing global focus on sustainability and high-performance materials across diverse sectors, from renewable energy to advanced healthcare, presents a significant long-term opportunity for the widespread adoption of graphene nanocomposites, solidifying its position as a cornerstone of future material science.
Graphene Nanocomposites Market Segmentation
-
1. Type
- 1.1. Graphene Oxide (GO)
- 1.2. Graphene Nano Platelets (GNP)
- 1.3. Other Types
-
2. End-user Industry
- 2.1. Electrical and Electronics
- 2.2. Medical
- 2.3. Automotive and Aerospace
- 2.4. Building and Construction
- 2.5. Packaging
- 2.6. Other End-user Industries
Graphene Nanocomposites Market Segmentation By Geography
-
1. Asia Pacific
- 1.1. China
- 1.2. India
- 1.3. Japan
- 1.4. South Korea
- 1.5. Rest of Asia Pacific
-
2. North America
- 2.1. United States
- 2.2. Canada
- 2.3. Mexico
-
3. Europe
- 3.1. Germany
- 3.2. United Kingdom
- 3.3. Italy
- 3.4. France
- 3.5. Rest of Europe
-
4. South America
- 4.1. Brazil
- 4.2. Argentina
- 4.3. Rest of South America
-
5. Middle East and Africa
- 5.1. Saudi Arabia
- 5.2. South Africa
- 5.3. Rest of Middle East and Africa
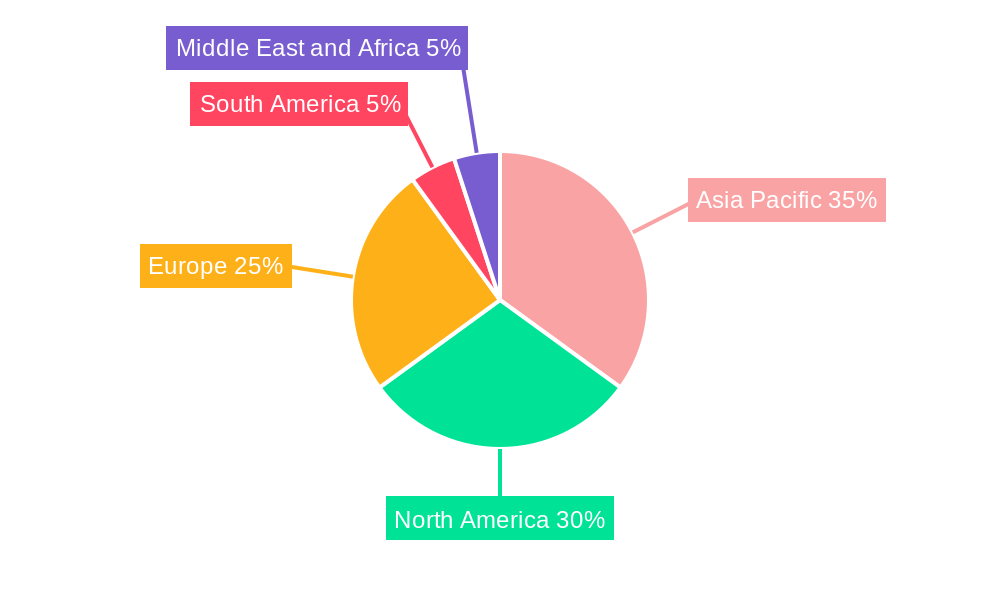
Graphene Nanocomposites Market Regional Market Share
Geographic Coverage of Graphene Nanocomposites Market
Graphene Nanocomposites Market REPORT HIGHLIGHTS
| Aspects | Details |
|---|---|
| Study Period | 2020-2034 |
| Base Year | 2025 |
| Estimated Year | 2026 |
| Forecast Period | 2026-2034 |
| Historical Period | 2020-2025 |
| Growth Rate | CAGR of 25.4% from 2020-2034 |
| Segmentation |
|
Table of Contents
- 1. Introduction
- 1.1. Research Scope
- 1.2. Market Segmentation
- 1.3. Research Objective
- 1.4. Definitions and Assumptions
- 2. Executive Summary
- 2.1. Market Snapshot
- 3. Market Dynamics
- 3.1. Market Drivers
- 3.2. Market Restrains
- 3.3. Market Trends
- 3.4. Market Opportunities
- 4. Market Factor Analysis
- 4.1. Porters Five Forces
- 4.1.1. Bargaining Power of Suppliers
- 4.1.2. Bargaining Power of Buyers
- 4.1.3. Threat of New Entrants
- 4.1.4. Threat of Substitutes
- 4.1.5. Competitive Rivalry
- 4.2. PESTEL analysis
- 4.3. BCG Analysis
- 4.3.1. Stars (High Growth, High Market Share)
- 4.3.2. Cash Cows (Low Growth, High Market Share)
- 4.3.3. Question Mark (High Growth, Low Market Share)
- 4.3.4. Dogs (Low Growth, Low Market Share)
- 4.4. Ansoff Matrix Analysis
- 4.5. Supply Chain Analysis
- 4.6. Regulatory Landscape
- 4.7. Current Market Potential and Opportunity Assessment (TAM–SAM–SOM Framework)
- 4.8. VDR Analyst Note
- 4.1. Porters Five Forces
- 5. Market Analysis, Insights and Forecast 2021-2033
- 5.1. Market Analysis, Insights and Forecast - by Type
- 5.1.1. Graphene Oxide (GO)
- 5.1.2. Graphene Nano Platelets (GNP)
- 5.1.3. Other Types
- 5.2. Market Analysis, Insights and Forecast - by End-user Industry
- 5.2.1. Electrical and Electronics
- 5.2.2. Medical
- 5.2.3. Automotive and Aerospace
- 5.2.4. Building and Construction
- 5.2.5. Packaging
- 5.2.6. Other End-user Industries
- 5.3. Market Analysis, Insights and Forecast - by Region
- 5.3.1. Asia Pacific
- 5.3.2. North America
- 5.3.3. Europe
- 5.3.4. South America
- 5.3.5. Middle East and Africa
- 5.1. Market Analysis, Insights and Forecast - by Type
- 6. Global Graphene Nanocomposites Market Analysis, Insights and Forecast, 2021-2033
- 6.1. Market Analysis, Insights and Forecast - by Type
- 6.1.1. Graphene Oxide (GO)
- 6.1.2. Graphene Nano Platelets (GNP)
- 6.1.3. Other Types
- 6.2. Market Analysis, Insights and Forecast - by End-user Industry
- 6.2.1. Electrical and Electronics
- 6.2.2. Medical
- 6.2.3. Automotive and Aerospace
- 6.2.4. Building and Construction
- 6.2.5. Packaging
- 6.2.6. Other End-user Industries
- 6.1. Market Analysis, Insights and Forecast - by Type
- 7. Asia Pacific Graphene Nanocomposites Market Analysis, Insights and Forecast, 2021-2033
- 7.1. Market Analysis, Insights and Forecast - by Type
- 7.1.1. Graphene Oxide (GO)
- 7.1.2. Graphene Nano Platelets (GNP)
- 7.1.3. Other Types
- 7.2. Market Analysis, Insights and Forecast - by End-user Industry
- 7.2.1. Electrical and Electronics
- 7.2.2. Medical
- 7.2.3. Automotive and Aerospace
- 7.2.4. Building and Construction
- 7.2.5. Packaging
- 7.2.6. Other End-user Industries
- 7.1. Market Analysis, Insights and Forecast - by Type
- 8. North America Graphene Nanocomposites Market Analysis, Insights and Forecast, 2021-2033
- 8.1. Market Analysis, Insights and Forecast - by Type
- 8.1.1. Graphene Oxide (GO)
- 8.1.2. Graphene Nano Platelets (GNP)
- 8.1.3. Other Types
- 8.2. Market Analysis, Insights and Forecast - by End-user Industry
- 8.2.1. Electrical and Electronics
- 8.2.2. Medical
- 8.2.3. Automotive and Aerospace
- 8.2.4. Building and Construction
- 8.2.5. Packaging
- 8.2.6. Other End-user Industries
- 8.1. Market Analysis, Insights and Forecast - by Type
- 9. Europe Graphene Nanocomposites Market Analysis, Insights and Forecast, 2021-2033
- 9.1. Market Analysis, Insights and Forecast - by Type
- 9.1.1. Graphene Oxide (GO)
- 9.1.2. Graphene Nano Platelets (GNP)
- 9.1.3. Other Types
- 9.2. Market Analysis, Insights and Forecast - by End-user Industry
- 9.2.1. Electrical and Electronics
- 9.2.2. Medical
- 9.2.3. Automotive and Aerospace
- 9.2.4. Building and Construction
- 9.2.5. Packaging
- 9.2.6. Other End-user Industries
- 9.1. Market Analysis, Insights and Forecast - by Type
- 10. South America Graphene Nanocomposites Market Analysis, Insights and Forecast, 2021-2033
- 10.1. Market Analysis, Insights and Forecast - by Type
- 10.1.1. Graphene Oxide (GO)
- 10.1.2. Graphene Nano Platelets (GNP)
- 10.1.3. Other Types
- 10.2. Market Analysis, Insights and Forecast - by End-user Industry
- 10.2.1. Electrical and Electronics
- 10.2.2. Medical
- 10.2.3. Automotive and Aerospace
- 10.2.4. Building and Construction
- 10.2.5. Packaging
- 10.2.6. Other End-user Industries
- 10.1. Market Analysis, Insights and Forecast - by Type
- 11. Middle East and Africa Graphene Nanocomposites Market Analysis, Insights and Forecast, 2021-2033
- 11.1. Market Analysis, Insights and Forecast - by Type
- 11.1.1. Graphene Oxide (GO)
- 11.1.2. Graphene Nano Platelets (GNP)
- 11.1.3. Other Types
- 11.2. Market Analysis, Insights and Forecast - by End-user Industry
- 11.2.1. Electrical and Electronics
- 11.2.2. Medical
- 11.2.3. Automotive and Aerospace
- 11.2.4. Building and Construction
- 11.2.5. Packaging
- 11.2.6. Other End-user Industries
- 11.1. Market Analysis, Insights and Forecast - by Type
- 12. Competitive Analysis
- 12.1. Company Profiles
- 12.1.1 Haydale Graphene Industries plc
- 12.1.1.1. Company Overview
- 12.1.1.2. Products
- 12.1.1.3. Company Financials
- 12.1.1.4. SWOT Analysis
- 12.1.2 Versarien plc
- 12.1.2.1. Company Overview
- 12.1.2.2. Products
- 12.1.2.3. Company Financials
- 12.1.2.4. SWOT Analysis
- 12.1.3 GrapheneTech S L
- 12.1.3.1. Company Overview
- 12.1.3.2. Products
- 12.1.3.3. Company Financials
- 12.1.3.4. SWOT Analysis
- 12.1.4 NanoXplore Inc
- 12.1.4.1. Company Overview
- 12.1.4.2. Products
- 12.1.4.3. Company Financials
- 12.1.4.4. SWOT Analysis
- 12.1.5 Graphenea
- 12.1.5.1. Company Overview
- 12.1.5.2. Products
- 12.1.5.3. Company Financials
- 12.1.5.4. SWOT Analysis
- 12.1.6 Applied Graphene Materials
- 12.1.6.1. Company Overview
- 12.1.6.2. Products
- 12.1.6.3. Company Financials
- 12.1.6.4. SWOT Analysis
- 12.1.7 XG Sciences
- 12.1.7.1. Company Overview
- 12.1.7.2. Products
- 12.1.7.3. Company Financials
- 12.1.7.4. SWOT Analysis
- 12.1.8 Directa Plus S p A
- 12.1.8.1. Company Overview
- 12.1.8.2. Products
- 12.1.8.3. Company Financials
- 12.1.8.4. SWOT Analysis
- 12.1.9 Abalonyx AS
- 12.1.9.1. Company Overview
- 12.1.9.2. Products
- 12.1.9.3. Company Financials
- 12.1.9.4. SWOT Analysis
- 12.1.10 Aztrong*List Not Exhaustive
- 12.1.10.1. Company Overview
- 12.1.10.2. Products
- 12.1.10.3. Company Financials
- 12.1.10.4. SWOT Analysis
- 12.1.1 Haydale Graphene Industries plc
- 12.2. Market Entropy
- 12.2.1 Company's Key Areas Served
- 12.2.2 Recent Developments
- 12.3. Company Market Share Analysis 2025
- 12.3.1 Top 5 Companies Market Share Analysis
- 12.3.2 Top 3 Companies Market Share Analysis
- 12.4. List of Potential Customers
- 13. Research Methodology
List of Figures
- Figure 1: Global Graphene Nanocomposites Market Revenue Breakdown (million, %) by Region 2025 & 2033
- Figure 2: Asia Pacific Graphene Nanocomposites Market Revenue (million), by Type 2025 & 2033
- Figure 3: Asia Pacific Graphene Nanocomposites Market Revenue Share (%), by Type 2025 & 2033
- Figure 4: Asia Pacific Graphene Nanocomposites Market Revenue (million), by End-user Industry 2025 & 2033
- Figure 5: Asia Pacific Graphene Nanocomposites Market Revenue Share (%), by End-user Industry 2025 & 2033
- Figure 6: Asia Pacific Graphene Nanocomposites Market Revenue (million), by Country 2025 & 2033
- Figure 7: Asia Pacific Graphene Nanocomposites Market Revenue Share (%), by Country 2025 & 2033
- Figure 8: North America Graphene Nanocomposites Market Revenue (million), by Type 2025 & 2033
- Figure 9: North America Graphene Nanocomposites Market Revenue Share (%), by Type 2025 & 2033
- Figure 10: North America Graphene Nanocomposites Market Revenue (million), by End-user Industry 2025 & 2033
- Figure 11: North America Graphene Nanocomposites Market Revenue Share (%), by End-user Industry 2025 & 2033
- Figure 12: North America Graphene Nanocomposites Market Revenue (million), by Country 2025 & 2033
- Figure 13: North America Graphene Nanocomposites Market Revenue Share (%), by Country 2025 & 2033
- Figure 14: Europe Graphene Nanocomposites Market Revenue (million), by Type 2025 & 2033
- Figure 15: Europe Graphene Nanocomposites Market Revenue Share (%), by Type 2025 & 2033
- Figure 16: Europe Graphene Nanocomposites Market Revenue (million), by End-user Industry 2025 & 2033
- Figure 17: Europe Graphene Nanocomposites Market Revenue Share (%), by End-user Industry 2025 & 2033
- Figure 18: Europe Graphene Nanocomposites Market Revenue (million), by Country 2025 & 2033
- Figure 19: Europe Graphene Nanocomposites Market Revenue Share (%), by Country 2025 & 2033
- Figure 20: South America Graphene Nanocomposites Market Revenue (million), by Type 2025 & 2033
- Figure 21: South America Graphene Nanocomposites Market Revenue Share (%), by Type 2025 & 2033
- Figure 22: South America Graphene Nanocomposites Market Revenue (million), by End-user Industry 2025 & 2033
- Figure 23: South America Graphene Nanocomposites Market Revenue Share (%), by End-user Industry 2025 & 2033
- Figure 24: South America Graphene Nanocomposites Market Revenue (million), by Country 2025 & 2033
- Figure 25: South America Graphene Nanocomposites Market Revenue Share (%), by Country 2025 & 2033
- Figure 26: Middle East and Africa Graphene Nanocomposites Market Revenue (million), by Type 2025 & 2033
- Figure 27: Middle East and Africa Graphene Nanocomposites Market Revenue Share (%), by Type 2025 & 2033
- Figure 28: Middle East and Africa Graphene Nanocomposites Market Revenue (million), by End-user Industry 2025 & 2033
- Figure 29: Middle East and Africa Graphene Nanocomposites Market Revenue Share (%), by End-user Industry 2025 & 2033
- Figure 30: Middle East and Africa Graphene Nanocomposites Market Revenue (million), by Country 2025 & 2033
- Figure 31: Middle East and Africa Graphene Nanocomposites Market Revenue Share (%), by Country 2025 & 2033
List of Tables
- Table 1: Global Graphene Nanocomposites Market Revenue million Forecast, by Type 2020 & 2033
- Table 2: Global Graphene Nanocomposites Market Revenue million Forecast, by End-user Industry 2020 & 2033
- Table 3: Global Graphene Nanocomposites Market Revenue million Forecast, by Region 2020 & 2033
- Table 4: Global Graphene Nanocomposites Market Revenue million Forecast, by Type 2020 & 2033
- Table 5: Global Graphene Nanocomposites Market Revenue million Forecast, by End-user Industry 2020 & 2033
- Table 6: Global Graphene Nanocomposites Market Revenue million Forecast, by Country 2020 & 2033
- Table 7: China Graphene Nanocomposites Market Revenue (million) Forecast, by Application 2020 & 2033
- Table 8: India Graphene Nanocomposites Market Revenue (million) Forecast, by Application 2020 & 2033
- Table 9: Japan Graphene Nanocomposites Market Revenue (million) Forecast, by Application 2020 & 2033
- Table 10: South Korea Graphene Nanocomposites Market Revenue (million) Forecast, by Application 2020 & 2033
- Table 11: Rest of Asia Pacific Graphene Nanocomposites Market Revenue (million) Forecast, by Application 2020 & 2033
- Table 12: Global Graphene Nanocomposites Market Revenue million Forecast, by Type 2020 & 2033
- Table 13: Global Graphene Nanocomposites Market Revenue million Forecast, by End-user Industry 2020 & 2033
- Table 14: Global Graphene Nanocomposites Market Revenue million Forecast, by Country 2020 & 2033
- Table 15: United States Graphene Nanocomposites Market Revenue (million) Forecast, by Application 2020 & 2033
- Table 16: Canada Graphene Nanocomposites Market Revenue (million) Forecast, by Application 2020 & 2033
- Table 17: Mexico Graphene Nanocomposites Market Revenue (million) Forecast, by Application 2020 & 2033
- Table 18: Global Graphene Nanocomposites Market Revenue million Forecast, by Type 2020 & 2033
- Table 19: Global Graphene Nanocomposites Market Revenue million Forecast, by End-user Industry 2020 & 2033
- Table 20: Global Graphene Nanocomposites Market Revenue million Forecast, by Country 2020 & 2033
- Table 21: Germany Graphene Nanocomposites Market Revenue (million) Forecast, by Application 2020 & 2033
- Table 22: United Kingdom Graphene Nanocomposites Market Revenue (million) Forecast, by Application 2020 & 2033
- Table 23: Italy Graphene Nanocomposites Market Revenue (million) Forecast, by Application 2020 & 2033
- Table 24: France Graphene Nanocomposites Market Revenue (million) Forecast, by Application 2020 & 2033
- Table 25: Rest of Europe Graphene Nanocomposites Market Revenue (million) Forecast, by Application 2020 & 2033
- Table 26: Global Graphene Nanocomposites Market Revenue million Forecast, by Type 2020 & 2033
- Table 27: Global Graphene Nanocomposites Market Revenue million Forecast, by End-user Industry 2020 & 2033
- Table 28: Global Graphene Nanocomposites Market Revenue million Forecast, by Country 2020 & 2033
- Table 29: Brazil Graphene Nanocomposites Market Revenue (million) Forecast, by Application 2020 & 2033
- Table 30: Argentina Graphene Nanocomposites Market Revenue (million) Forecast, by Application 2020 & 2033
- Table 31: Rest of South America Graphene Nanocomposites Market Revenue (million) Forecast, by Application 2020 & 2033
- Table 32: Global Graphene Nanocomposites Market Revenue million Forecast, by Type 2020 & 2033
- Table 33: Global Graphene Nanocomposites Market Revenue million Forecast, by End-user Industry 2020 & 2033
- Table 34: Global Graphene Nanocomposites Market Revenue million Forecast, by Country 2020 & 2033
- Table 35: Saudi Arabia Graphene Nanocomposites Market Revenue (million) Forecast, by Application 2020 & 2033
- Table 36: South Africa Graphene Nanocomposites Market Revenue (million) Forecast, by Application 2020 & 2033
- Table 37: Rest of Middle East and Africa Graphene Nanocomposites Market Revenue (million) Forecast, by Application 2020 & 2033
Frequently Asked Questions
1. What is the projected Compound Annual Growth Rate (CAGR) of the Graphene Nanocomposites Market?
The projected CAGR is approximately 25.4%.
2. Which companies are prominent players in the Graphene Nanocomposites Market?
Key companies in the market include Haydale Graphene Industries plc, Versarien plc, GrapheneTech S L, NanoXplore Inc, Graphenea, Applied Graphene Materials, XG Sciences, Directa Plus S p A, Abalonyx AS, Aztrong*List Not Exhaustive.
3. What are the main segments of the Graphene Nanocomposites Market?
The market segments include Type, End-user Industry.
4. Can you provide details about the market size?
The market size is estimated to be USD 38.1 million as of 2022.
5. What are some drivers contributing to market growth?
Rising Applications from Electronic Sector; Increasing Adoption in Biomedical Devices.
6. What are the notable trends driving market growth?
Rising Demand from Electrical and Electronics End-user Industries.
7. Are there any restraints impacting market growth?
Rising Applications from Electronic Sector; Increasing Adoption in Biomedical Devices.
8. Can you provide examples of recent developments in the market?
In January 2022, Haydale Graphene Industries plc., announced the incorporation of graphene nano-platelets (GNPs) in its cosmetic face mask sheets and PPE face masks, iCraft is using Haydale's functionalized GNPs in its graphene-coated fabric, THERMiT.
9. What pricing options are available for accessing the report?
Pricing options include single-user, multi-user, and enterprise licenses priced at USD 4750, USD 5250, and USD 8750 respectively.
10. Is the market size provided in terms of value or volume?
The market size is provided in terms of value, measured in million.
11. Are there any specific market keywords associated with the report?
Yes, the market keyword associated with the report is "Graphene Nanocomposites Market," which aids in identifying and referencing the specific market segment covered.
12. How do I determine which pricing option suits my needs best?
The pricing options vary based on user requirements and access needs. Individual users may opt for single-user licenses, while businesses requiring broader access may choose multi-user or enterprise licenses for cost-effective access to the report.
13. Are there any additional resources or data provided in the Graphene Nanocomposites Market report?
While the report offers comprehensive insights, it's advisable to review the specific contents or supplementary materials provided to ascertain if additional resources or data are available.
14. How can I stay updated on further developments or reports in the Graphene Nanocomposites Market?
To stay informed about further developments, trends, and reports in the Graphene Nanocomposites Market, consider subscribing to industry newsletters, following relevant companies and organizations, or regularly checking reputable industry news sources and publications.
Methodology
Step 1 - Identification of Relevant Samples Size from Population Database


Step 2 - Approaches for Defining Global Market Size (Value, Volume* & Price*)

Note*: In applicable scenarios
Step 3 - Data Sources
Primary Research
- Web Analytics
- Survey Reports
- Research Institute
- Latest Research Reports
- Opinion Leaders
Secondary Research
- Annual Reports
- White Paper
- Latest Press Release
- Industry Association
- Paid Database
- Investor Presentations

Step 4 - Data Triangulation
Involves using different sources of information in order to increase the validity of a study
These sources are likely to be stakeholders in a program - participants, other researchers, program staff, other community members, and so on.
Then we put all data in single framework & apply various statistical tools to find out the dynamic on the market.
During the analysis stage, feedback from the stakeholder groups would be compared to determine areas of agreement as well as areas of divergence