

Key Insights
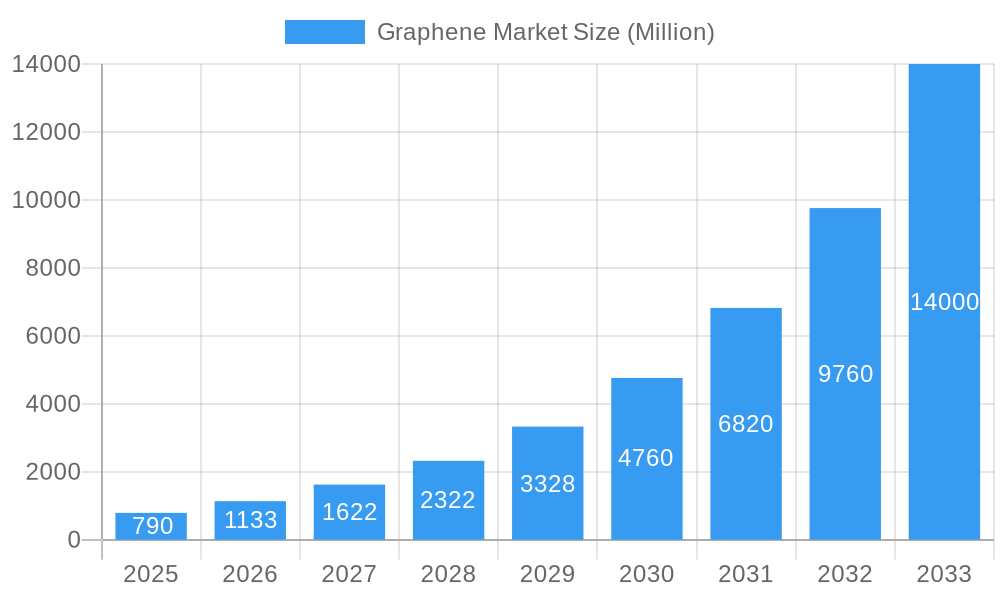
The graphene market, valued at $0.79 billion in 2025, is experiencing explosive growth, projected to expand at a compound annual growth rate (CAGR) of 43.64% from 2025 to 2033. This remarkable expansion is driven by the material's exceptional properties – high electrical conductivity, strength, and flexibility – making it ideal for a wide range of applications across diverse sectors. Key drivers include the increasing demand for lightweight and high-performance materials in the electronics and telecommunications industries, particularly in advanced semiconductors and flexible electronics. The burgeoning biomedical and healthcare sector is also contributing significantly, with graphene finding use in biosensors, drug delivery systems, and regenerative medicine. Furthermore, the energy sector's adoption of graphene for improved battery technology and solar cells fuels market growth. While challenges exist, such as high production costs and scalability issues, ongoing research and development efforts are addressing these limitations, paving the way for wider commercialization. The market segmentation reveals strong growth across all product types (graphene sheets and films, nanoribbons, nanoplatelets, graphene oxide, etc.) and end-user industries, with Asia-Pacific, North America, and Europe representing the leading regional markets.
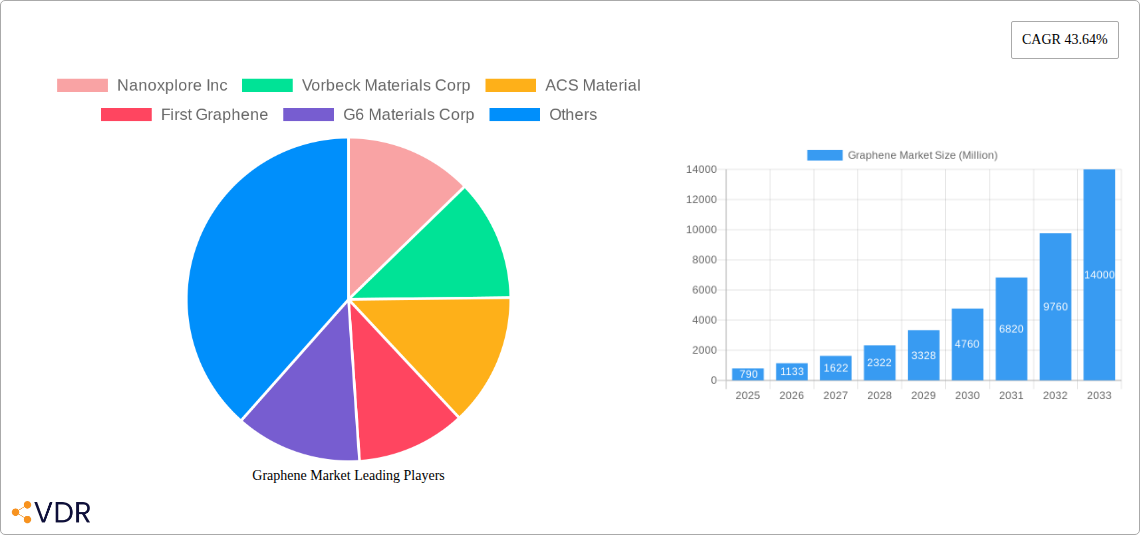
Graphene Market Market Size (In Million)
The competitive landscape is dynamic, with numerous companies like Nanoxplore Inc., Vorbeck Materials Corp., and ACS Material leading innovation and production. However, the market is also witnessing the emergence of new players, particularly in Asia, fueling competition and further driving innovation. The forecast period (2025-2033) suggests a substantial market expansion, with significant growth opportunities arising from advancements in manufacturing techniques, decreasing production costs, and expanding applications in emerging technologies such as flexible displays, wearable electronics, and advanced composites. The continued focus on sustainable and environmentally friendly materials will further propel graphene adoption across various industries. Successful navigation of regulatory hurdles and the development of standardized testing protocols are crucial for unlocking the full potential of this transformative material.
Graphene Market Company Market Share
Graphene Market: A Comprehensive Report (2019-2033)
This in-depth report provides a comprehensive analysis of the Graphene Market, encompassing market dynamics, growth trends, regional dominance, product landscape, key players, and future outlook. The study period spans from 2019 to 2033, with 2025 serving as the base and estimated year. The report segments the market by Product Type (Graphene Sheets and Films, Nanoribbons, Nanoplatelets, Graphene Oxide, Other Product Types) and End-user Industry (Electronics and Telecommunication, Bio-medical and Healthcare, Energy, Aerospace and Defense, Other End-user Industries), offering granular insights into this rapidly evolving market valued at xx Million units in 2025.
Graphene Market Market Dynamics & Structure
The graphene market is characterized by moderate concentration, with several key players vying for market share. Technological innovation, particularly in synthesis methods and application development, is a significant driver, while regulatory frameworks concerning material safety and environmental impact play a crucial role. Competitive substitutes, such as carbon nanotubes, exist, but graphene's unique properties offer distinct advantages in several applications. M&A activity, as evidenced by recent deals, reflects consolidation efforts and a race for market dominance.
- Market Concentration: Moderately concentrated, with top 5 players holding approximately xx% market share in 2025.
- Technological Innovation: Focus on scalable production methods, improved quality control, and tailored material properties for specific applications.
- Regulatory Frameworks: Emerging regulations concerning material safety and environmental impact could influence market growth.
- Competitive Substitutes: Carbon nanotubes and other advanced materials pose some competition, but graphene's unique attributes maintain its edge.
- End-User Demographics: Strong demand from electronics and energy sectors, with growing interest from biomedical and aerospace industries.
- M&A Trends: Increasing M&A activity indicates consolidation and efforts to secure supply chains and expand application portfolios. An estimated xx M&A deals were recorded between 2019 and 2024.
Graphene Market Growth Trends & Insights
The global graphene market is experiencing a robust expansion, propelled by its increasing integration across a wide spectrum of industries. Between 2019 and 2024, the market witnessed significant momentum, and this upward trajectory is set to continue. Projections indicate a compelling Compound Annual Growth Rate (CAGR) of [Insert specific CAGR]% during the forecast period from 2025 to 2033. This growth is anticipated to culminate in a market valuation of [Insert specific value] Million units by 2033. The primary catalysts for this surge include continuous technological breakthroughs that enhance graphene's quality and drive down production expenses. Furthermore, the expanding utility of graphene in high-growth sectors such as advanced electronics, cutting-edge energy storage solutions, and innovative biomedical applications is a key factor. Shifting consumer preferences towards sustainable, eco-friendly, and superior-performance materials are also significantly contributing to market expansion. While market penetration is currently at a nascent stage, it is expected to accelerate considerably as production costs decrease and greater awareness of graphene's unique properties spreads.
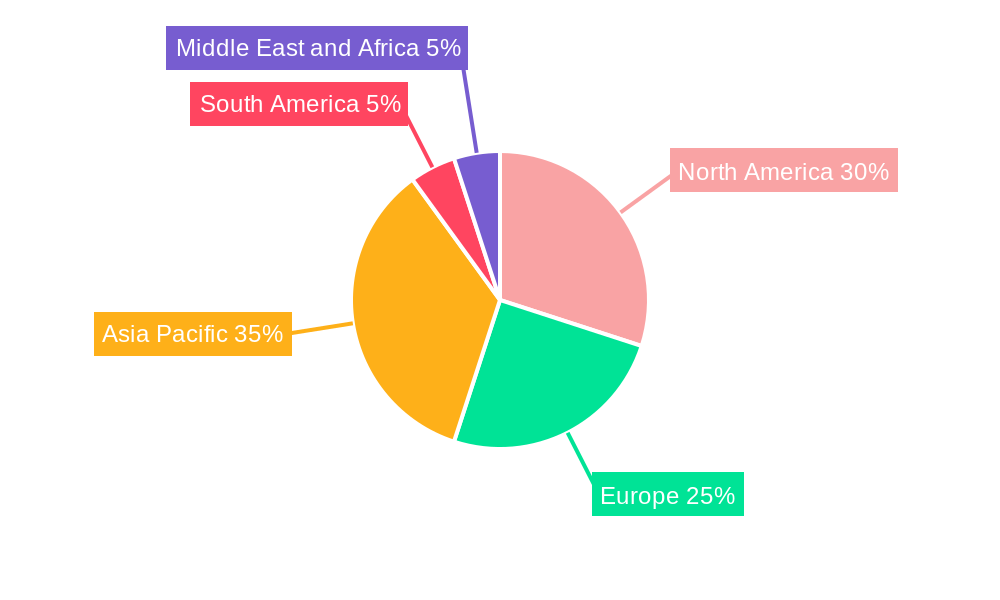
Dominant Regions, Countries, or Segments in Graphene Market
The Asia-Pacific region currently commands the largest share of the graphene market. This dominance is attributed to its extensive manufacturing capabilities, substantial government backing for advanced materials research, and strong demand originating from its thriving electronics and energy sectors. In terms of product types, Graphene Sheets and Films emerge as the leading segment, owing to their inherent versatility and well-established application frameworks. When considering end-user industries, the electronics and telecommunication sector stands out as the primary consumer, closely followed by the energy and biomedical fields.
- Dominant Regions & Their Contributions:
- Asia-Pacific: Characterized by unwavering government support, highly developed manufacturing infrastructures, and a voracious appetite from the electronics and energy industries.
- North America: Distinguished by significant investments in Research and Development (R&D), a strong presence of pioneering companies, and an escalating adoption rate across diverse applications.
- Europe: Demonstrates a clear emphasis on sustainable material solutions and a growing commitment to fostering graphene research initiatives.
- Dominant Segments:
- Product Type: Graphene Sheets and Films are at the forefront due to their broad applicability and mature production methodologies.
- End-user Industry: The Electronics and Telecommunication sector continues to lead, driven by graphene's critical role in the development of advanced transistors, highly sensitive sensors, and flexible display technologies.
Graphene Market Product Landscape
The graphene market offers a diverse range of products, including graphene sheets and films, nanoribbons, nanoplatelets, graphene oxide, and other derivatives. Continuous innovation focuses on enhancing material properties like conductivity, strength, and flexibility to meet diverse application requirements. The unique selling propositions of graphene, such as its exceptional electrical conductivity and mechanical strength, coupled with advancements in production techniques, are driving its adoption across various sectors.
Key Drivers, Barriers & Challenges in Graphene Market
Key Drivers: A primary impetus for market growth is the escalating demand for high-performance materials in critical sectors like electronics, energy, and biomedicine. Technological advancements that reduce production costs and enhance material quality are indispensable drivers. Furthermore, supportive government policies and an increase in R&D investments are acting as significant catalysts for market expansion.
Key Challenges: Despite the promising outlook, the graphene market faces several hurdles. High production costs, challenges in achieving scalability for mass production, and a lack of standardized material properties are significant barriers to widespread adoption. Complex supply chain dynamics and the necessity for stringent quality control mechanisms also present obstacles. The competitive landscape, marked by the availability of alternative materials, and regulatory uncertainties further add to the market's complexities. It is estimated that a reduction of [Insert specific percentage]% in production costs is essential to achieve mass adoption by the year 2030.
Emerging Opportunities in Graphene Market
Untapped markets within the realms of flexible electronics, advanced energy storage solutions, and efficient water purification technologies present substantial avenues for future growth. Groundbreaking innovations in composite materials, sophisticated biomedical devices, and highly sensitive sensors are paving the way for novel graphene applications. The evolving consumer preference for sustainable, eco-friendly, and high-performance products is also playing a pivotal role in shaping the market's future trajectory.
Growth Accelerators in the Graphene Market Industry
Technological breakthroughs in large-scale graphene production methods, strategic partnerships between material producers and end-users, and the expansion into new application areas are crucial accelerators. Increasing R&D investments and government support for advanced materials development significantly contribute to market growth.
Key Players Shaping the Graphene Market Market
- Nanoxplore Inc
- Vorbeck Materials Corp
- ACS Material
- First Graphene
- G6 Materials Corp
- Changzhou Two-Dimensional Carbon Technology Co Ltd
- Morsh (Ningbo Moxi Technology Co Ltd)
- The Sixth Element (Changzhou) Materials Technology Co Ltd
- Perpetuus Advanced Materials PLC
- Xiamen Knano Graphene Technology Corporation Limited
- Neograf
- Universal Matter
- Grafoid Inc
- Graphene Production
- Global Graphene Group
- Graphenano Group
- Thomas Swan & Co Ltd
- Haydale Graphene Industries PLC
- Graphenea
- Elcora Advanced Materials Corp
- Versarien PLC
- Graphene Manufacturing Group Ltd
Notable Milestones in Graphene Market Sector
- March 2023: Universal Matter acquired Applied Graphene Materials, strengthening its market position.
- February 2023: Global Graphene Group's subsidiary signed a business combination agreement to develop battery materials using graphene.
In-Depth Graphene Market Market Outlook
The graphene market is poised for impressive long-term growth. This optimistic outlook is underpinned by continuous technological advancements, strategic collaborations between industry players, and the successful expansion of graphene into a multitude of new applications. Crucial to capitalizing on this potential will be sustained investments in R&D, ongoing improvements in production efficiency, and targeted marketing strategies aimed at key industrial sectors. These efforts will be vital for capturing significant market share and ensuring sustained long-term profitability. The future of graphene is exceptionally bright, with a projected market value of [Insert specific value] Million units by 2033, offering compelling opportunities for businesses to leverage the transformative capabilities of this remarkable material.
Graphene Market Segmentation
-
1. Product Type
- 1.1. Graphene Sheets and Films
- 1.2. Nanoribbons
- 1.3. Nanoplatelets
- 1.4. Graphene Oxide
- 1.5. Other Product Types
-
2. End-user Industry
- 2.1. Electronics and Telecommunication
- 2.2. Bio-medical and Healthcare
- 2.3. Energy
- 2.4. Aerospace and Defense
- 2.5. Other End-user Industries
Graphene Market Segmentation By Geography
-
1. Asia Pacific
- 1.1. China
- 1.2. India
- 1.3. Japan
- 1.4. South Korea
- 1.5. Malaysia
- 1.6. Thailand
- 1.7. Indonesia
- 1.8. Vietnam
- 1.9. Rest of Asia Pacific
-
2. North America
- 2.1. United States
- 2.2. Canada
- 2.3. Mexico
-
3. Europe
- 3.1. Germany
- 3.2. United Kingdom
- 3.3. France
- 3.4. Italy
- 3.5. Spain
- 3.6. NORDIC Countries
- 3.7. Turkey
- 3.8. Russia
- 3.9. Rest of Europe
-
4. South America
- 4.1. Brazil
- 4.2. Argentina
- 4.3. Colombia
- 4.4. Rest of South America
-
5. Middle East and Africa
- 5.1. Saudi Arabia
- 5.2. Qatar
- 5.3. United Arab Emirates
- 5.4. Nigeria
- 5.5. Egypt
- 5.6. South Africa
- 5.7. Rest of Middle East and Africa
Graphene Market Regional Market Share
Geographic Coverage of Graphene Market
Graphene Market REPORT HIGHLIGHTS
| Aspects | Details |
|---|---|
| Study Period | 2020-2034 |
| Base Year | 2025 |
| Estimated Year | 2026 |
| Forecast Period | 2026-2034 |
| Historical Period | 2020-2025 |
| Growth Rate | CAGR of 43.64% from 2020-2034 |
| Segmentation |
|
Table of Contents
- 1. Introduction
- 1.1. Research Scope
- 1.2. Market Segmentation
- 1.3. Research Objective
- 1.4. Definitions and Assumptions
- 2. Executive Summary
- 2.1. Market Snapshot
- 3. Market Dynamics
- 3.1. Market Drivers
- 3.2. Market Restrains
- 3.3. Market Trends
- 3.4. Market Opportunities
- 4. Market Factor Analysis
- 4.1. Porters Five Forces
- 4.1.1. Bargaining Power of Suppliers
- 4.1.2. Bargaining Power of Buyers
- 4.1.3. Threat of New Entrants
- 4.1.4. Threat of Substitutes
- 4.1.5. Competitive Rivalry
- 4.2. PESTEL analysis
- 4.3. BCG Analysis
- 4.3.1. Stars (High Growth, High Market Share)
- 4.3.2. Cash Cows (Low Growth, High Market Share)
- 4.3.3. Question Mark (High Growth, Low Market Share)
- 4.3.4. Dogs (Low Growth, Low Market Share)
- 4.4. Ansoff Matrix Analysis
- 4.5. Supply Chain Analysis
- 4.6. Regulatory Landscape
- 4.7. Current Market Potential and Opportunity Assessment (TAM–SAM–SOM Framework)
- 4.8. VDR Analyst Note
- 4.1. Porters Five Forces
- 5. Market Analysis, Insights and Forecast 2021-2033
- 5.1. Market Analysis, Insights and Forecast - by Product Type
- 5.1.1. Graphene Sheets and Films
- 5.1.2. Nanoribbons
- 5.1.3. Nanoplatelets
- 5.1.4. Graphene Oxide
- 5.1.5. Other Product Types
- 5.2. Market Analysis, Insights and Forecast - by End-user Industry
- 5.2.1. Electronics and Telecommunication
- 5.2.2. Bio-medical and Healthcare
- 5.2.3. Energy
- 5.2.4. Aerospace and Defense
- 5.2.5. Other End-user Industries
- 5.3. Market Analysis, Insights and Forecast - by Region
- 5.3.1. Asia Pacific
- 5.3.2. North America
- 5.3.3. Europe
- 5.3.4. South America
- 5.3.5. Middle East and Africa
- 5.1. Market Analysis, Insights and Forecast - by Product Type
- 6. Global Graphene Market Analysis, Insights and Forecast, 2021-2033
- 6.1. Market Analysis, Insights and Forecast - by Product Type
- 6.1.1. Graphene Sheets and Films
- 6.1.2. Nanoribbons
- 6.1.3. Nanoplatelets
- 6.1.4. Graphene Oxide
- 6.1.5. Other Product Types
- 6.2. Market Analysis, Insights and Forecast - by End-user Industry
- 6.2.1. Electronics and Telecommunication
- 6.2.2. Bio-medical and Healthcare
- 6.2.3. Energy
- 6.2.4. Aerospace and Defense
- 6.2.5. Other End-user Industries
- 6.1. Market Analysis, Insights and Forecast - by Product Type
- 7. Asia Pacific Graphene Market Analysis, Insights and Forecast, 2021-2033
- 7.1. Market Analysis, Insights and Forecast - by Product Type
- 7.1.1. Graphene Sheets and Films
- 7.1.2. Nanoribbons
- 7.1.3. Nanoplatelets
- 7.1.4. Graphene Oxide
- 7.1.5. Other Product Types
- 7.2. Market Analysis, Insights and Forecast - by End-user Industry
- 7.2.1. Electronics and Telecommunication
- 7.2.2. Bio-medical and Healthcare
- 7.2.3. Energy
- 7.2.4. Aerospace and Defense
- 7.2.5. Other End-user Industries
- 7.1. Market Analysis, Insights and Forecast - by Product Type
- 8. North America Graphene Market Analysis, Insights and Forecast, 2021-2033
- 8.1. Market Analysis, Insights and Forecast - by Product Type
- 8.1.1. Graphene Sheets and Films
- 8.1.2. Nanoribbons
- 8.1.3. Nanoplatelets
- 8.1.4. Graphene Oxide
- 8.1.5. Other Product Types
- 8.2. Market Analysis, Insights and Forecast - by End-user Industry
- 8.2.1. Electronics and Telecommunication
- 8.2.2. Bio-medical and Healthcare
- 8.2.3. Energy
- 8.2.4. Aerospace and Defense
- 8.2.5. Other End-user Industries
- 8.1. Market Analysis, Insights and Forecast - by Product Type
- 9. Europe Graphene Market Analysis, Insights and Forecast, 2021-2033
- 9.1. Market Analysis, Insights and Forecast - by Product Type
- 9.1.1. Graphene Sheets and Films
- 9.1.2. Nanoribbons
- 9.1.3. Nanoplatelets
- 9.1.4. Graphene Oxide
- 9.1.5. Other Product Types
- 9.2. Market Analysis, Insights and Forecast - by End-user Industry
- 9.2.1. Electronics and Telecommunication
- 9.2.2. Bio-medical and Healthcare
- 9.2.3. Energy
- 9.2.4. Aerospace and Defense
- 9.2.5. Other End-user Industries
- 9.1. Market Analysis, Insights and Forecast - by Product Type
- 10. South America Graphene Market Analysis, Insights and Forecast, 2021-2033
- 10.1. Market Analysis, Insights and Forecast - by Product Type
- 10.1.1. Graphene Sheets and Films
- 10.1.2. Nanoribbons
- 10.1.3. Nanoplatelets
- 10.1.4. Graphene Oxide
- 10.1.5. Other Product Types
- 10.2. Market Analysis, Insights and Forecast - by End-user Industry
- 10.2.1. Electronics and Telecommunication
- 10.2.2. Bio-medical and Healthcare
- 10.2.3. Energy
- 10.2.4. Aerospace and Defense
- 10.2.5. Other End-user Industries
- 10.1. Market Analysis, Insights and Forecast - by Product Type
- 11. Middle East and Africa Graphene Market Analysis, Insights and Forecast, 2021-2033
- 11.1. Market Analysis, Insights and Forecast - by Product Type
- 11.1.1. Graphene Sheets and Films
- 11.1.2. Nanoribbons
- 11.1.3. Nanoplatelets
- 11.1.4. Graphene Oxide
- 11.1.5. Other Product Types
- 11.2. Market Analysis, Insights and Forecast - by End-user Industry
- 11.2.1. Electronics and Telecommunication
- 11.2.2. Bio-medical and Healthcare
- 11.2.3. Energy
- 11.2.4. Aerospace and Defense
- 11.2.5. Other End-user Industries
- 11.1. Market Analysis, Insights and Forecast - by Product Type
- 12. Competitive Analysis
- 12.1. Company Profiles
- 12.1.1 Nanoxplore Inc
- 12.1.1.1. Company Overview
- 12.1.1.2. Products
- 12.1.1.3. Company Financials
- 12.1.1.4. SWOT Analysis
- 12.1.2 Vorbeck Materials Corp
- 12.1.2.1. Company Overview
- 12.1.2.2. Products
- 12.1.2.3. Company Financials
- 12.1.2.4. SWOT Analysis
- 12.1.3 ACS Material
- 12.1.3.1. Company Overview
- 12.1.3.2. Products
- 12.1.3.3. Company Financials
- 12.1.3.4. SWOT Analysis
- 12.1.4 First Graphene
- 12.1.4.1. Company Overview
- 12.1.4.2. Products
- 12.1.4.3. Company Financials
- 12.1.4.4. SWOT Analysis
- 12.1.5 G6 Materials Corp
- 12.1.5.1. Company Overview
- 12.1.5.2. Products
- 12.1.5.3. Company Financials
- 12.1.5.4. SWOT Analysis
- 12.1.6 Changzhou Two-Dimensional Carbon Technology Co Ltd
- 12.1.6.1. Company Overview
- 12.1.6.2. Products
- 12.1.6.3. Company Financials
- 12.1.6.4. SWOT Analysis
- 12.1.7 Morsh (Ningbo Moxi Technology Co Ltd)
- 12.1.7.1. Company Overview
- 12.1.7.2. Products
- 12.1.7.3. Company Financials
- 12.1.7.4. SWOT Analysis
- 12.1.8 The Sixth Element (Changzhou) Materials Technology Co Ltd
- 12.1.8.1. Company Overview
- 12.1.8.2. Products
- 12.1.8.3. Company Financials
- 12.1.8.4. SWOT Analysis
- 12.1.9 Perpetuus Advanced Materials PLC
- 12.1.9.1. Company Overview
- 12.1.9.2. Products
- 12.1.9.3. Company Financials
- 12.1.9.4. SWOT Analysis
- 12.1.10 Xiamen Knano Graphene Technology Corporation Limited*List Not Exhaustive
- 12.1.10.1. Company Overview
- 12.1.10.2. Products
- 12.1.10.3. Company Financials
- 12.1.10.4. SWOT Analysis
- 12.1.11 Neograf
- 12.1.11.1. Company Overview
- 12.1.11.2. Products
- 12.1.11.3. Company Financials
- 12.1.11.4. SWOT Analysis
- 12.1.12 Universal Matter
- 12.1.12.1. Company Overview
- 12.1.12.2. Products
- 12.1.12.3. Company Financials
- 12.1.12.4. SWOT Analysis
- 12.1.13 Grafoid Inc
- 12.1.13.1. Company Overview
- 12.1.13.2. Products
- 12.1.13.3. Company Financials
- 12.1.13.4. SWOT Analysis
- 12.1.14 Graphene Production
- 12.1.14.1. Company Overview
- 12.1.14.2. Products
- 12.1.14.3. Company Financials
- 12.1.14.4. SWOT Analysis
- 12.1.15 Global Graphene Group
- 12.1.15.1. Company Overview
- 12.1.15.2. Products
- 12.1.15.3. Company Financials
- 12.1.15.4. SWOT Analysis
- 12.1.16 Graphenano Group
- 12.1.16.1. Company Overview
- 12.1.16.2. Products
- 12.1.16.3. Company Financials
- 12.1.16.4. SWOT Analysis
- 12.1.17 Thomas Swan & Co Ltd
- 12.1.17.1. Company Overview
- 12.1.17.2. Products
- 12.1.17.3. Company Financials
- 12.1.17.4. SWOT Analysis
- 12.1.18 Haydale Graphene Industries PLC
- 12.1.18.1. Company Overview
- 12.1.18.2. Products
- 12.1.18.3. Company Financials
- 12.1.18.4. SWOT Analysis
- 12.1.19 Graphenea
- 12.1.19.1. Company Overview
- 12.1.19.2. Products
- 12.1.19.3. Company Financials
- 12.1.19.4. SWOT Analysis
- 12.1.20 Elcora Advanced Materials Corp
- 12.1.20.1. Company Overview
- 12.1.20.2. Products
- 12.1.20.3. Company Financials
- 12.1.20.4. SWOT Analysis
- 12.1.21 Versarien PLC
- 12.1.21.1. Company Overview
- 12.1.21.2. Products
- 12.1.21.3. Company Financials
- 12.1.21.4. SWOT Analysis
- 12.1.22 Graphene Manufacturing Group Ltd
- 12.1.22.1. Company Overview
- 12.1.22.2. Products
- 12.1.22.3. Company Financials
- 12.1.22.4. SWOT Analysis
- 12.1.1 Nanoxplore Inc
- 12.2. Market Entropy
- 12.2.1 Company's Key Areas Served
- 12.2.2 Recent Developments
- 12.3. Company Market Share Analysis 2025
- 12.3.1 Top 5 Companies Market Share Analysis
- 12.3.2 Top 3 Companies Market Share Analysis
- 12.4. List of Potential Customers
- 13. Research Methodology
List of Figures
- Figure 1: Global Graphene Market Revenue Breakdown (Million, %) by Region 2025 & 2033
- Figure 2: Asia Pacific Graphene Market Revenue (Million), by Product Type 2025 & 2033
- Figure 3: Asia Pacific Graphene Market Revenue Share (%), by Product Type 2025 & 2033
- Figure 4: Asia Pacific Graphene Market Revenue (Million), by End-user Industry 2025 & 2033
- Figure 5: Asia Pacific Graphene Market Revenue Share (%), by End-user Industry 2025 & 2033
- Figure 6: Asia Pacific Graphene Market Revenue (Million), by Country 2025 & 2033
- Figure 7: Asia Pacific Graphene Market Revenue Share (%), by Country 2025 & 2033
- Figure 8: North America Graphene Market Revenue (Million), by Product Type 2025 & 2033
- Figure 9: North America Graphene Market Revenue Share (%), by Product Type 2025 & 2033
- Figure 10: North America Graphene Market Revenue (Million), by End-user Industry 2025 & 2033
- Figure 11: North America Graphene Market Revenue Share (%), by End-user Industry 2025 & 2033
- Figure 12: North America Graphene Market Revenue (Million), by Country 2025 & 2033
- Figure 13: North America Graphene Market Revenue Share (%), by Country 2025 & 2033
- Figure 14: Europe Graphene Market Revenue (Million), by Product Type 2025 & 2033
- Figure 15: Europe Graphene Market Revenue Share (%), by Product Type 2025 & 2033
- Figure 16: Europe Graphene Market Revenue (Million), by End-user Industry 2025 & 2033
- Figure 17: Europe Graphene Market Revenue Share (%), by End-user Industry 2025 & 2033
- Figure 18: Europe Graphene Market Revenue (Million), by Country 2025 & 2033
- Figure 19: Europe Graphene Market Revenue Share (%), by Country 2025 & 2033
- Figure 20: South America Graphene Market Revenue (Million), by Product Type 2025 & 2033
- Figure 21: South America Graphene Market Revenue Share (%), by Product Type 2025 & 2033
- Figure 22: South America Graphene Market Revenue (Million), by End-user Industry 2025 & 2033
- Figure 23: South America Graphene Market Revenue Share (%), by End-user Industry 2025 & 2033
- Figure 24: South America Graphene Market Revenue (Million), by Country 2025 & 2033
- Figure 25: South America Graphene Market Revenue Share (%), by Country 2025 & 2033
- Figure 26: Middle East and Africa Graphene Market Revenue (Million), by Product Type 2025 & 2033
- Figure 27: Middle East and Africa Graphene Market Revenue Share (%), by Product Type 2025 & 2033
- Figure 28: Middle East and Africa Graphene Market Revenue (Million), by End-user Industry 2025 & 2033
- Figure 29: Middle East and Africa Graphene Market Revenue Share (%), by End-user Industry 2025 & 2033
- Figure 30: Middle East and Africa Graphene Market Revenue (Million), by Country 2025 & 2033
- Figure 31: Middle East and Africa Graphene Market Revenue Share (%), by Country 2025 & 2033
List of Tables
- Table 1: Global Graphene Market Revenue Million Forecast, by Product Type 2020 & 2033
- Table 2: Global Graphene Market Revenue Million Forecast, by End-user Industry 2020 & 2033
- Table 3: Global Graphene Market Revenue Million Forecast, by Region 2020 & 2033
- Table 4: Global Graphene Market Revenue Million Forecast, by Product Type 2020 & 2033
- Table 5: Global Graphene Market Revenue Million Forecast, by End-user Industry 2020 & 2033
- Table 6: Global Graphene Market Revenue Million Forecast, by Country 2020 & 2033
- Table 7: China Graphene Market Revenue (Million) Forecast, by Application 2020 & 2033
- Table 8: India Graphene Market Revenue (Million) Forecast, by Application 2020 & 2033
- Table 9: Japan Graphene Market Revenue (Million) Forecast, by Application 2020 & 2033
- Table 10: South Korea Graphene Market Revenue (Million) Forecast, by Application 2020 & 2033
- Table 11: Malaysia Graphene Market Revenue (Million) Forecast, by Application 2020 & 2033
- Table 12: Thailand Graphene Market Revenue (Million) Forecast, by Application 2020 & 2033
- Table 13: Indonesia Graphene Market Revenue (Million) Forecast, by Application 2020 & 2033
- Table 14: Vietnam Graphene Market Revenue (Million) Forecast, by Application 2020 & 2033
- Table 15: Rest of Asia Pacific Graphene Market Revenue (Million) Forecast, by Application 2020 & 2033
- Table 16: Global Graphene Market Revenue Million Forecast, by Product Type 2020 & 2033
- Table 17: Global Graphene Market Revenue Million Forecast, by End-user Industry 2020 & 2033
- Table 18: Global Graphene Market Revenue Million Forecast, by Country 2020 & 2033
- Table 19: United States Graphene Market Revenue (Million) Forecast, by Application 2020 & 2033
- Table 20: Canada Graphene Market Revenue (Million) Forecast, by Application 2020 & 2033
- Table 21: Mexico Graphene Market Revenue (Million) Forecast, by Application 2020 & 2033
- Table 22: Global Graphene Market Revenue Million Forecast, by Product Type 2020 & 2033
- Table 23: Global Graphene Market Revenue Million Forecast, by End-user Industry 2020 & 2033
- Table 24: Global Graphene Market Revenue Million Forecast, by Country 2020 & 2033
- Table 25: Germany Graphene Market Revenue (Million) Forecast, by Application 2020 & 2033
- Table 26: United Kingdom Graphene Market Revenue (Million) Forecast, by Application 2020 & 2033
- Table 27: France Graphene Market Revenue (Million) Forecast, by Application 2020 & 2033
- Table 28: Italy Graphene Market Revenue (Million) Forecast, by Application 2020 & 2033
- Table 29: Spain Graphene Market Revenue (Million) Forecast, by Application 2020 & 2033
- Table 30: NORDIC Countries Graphene Market Revenue (Million) Forecast, by Application 2020 & 2033
- Table 31: Turkey Graphene Market Revenue (Million) Forecast, by Application 2020 & 2033
- Table 32: Russia Graphene Market Revenue (Million) Forecast, by Application 2020 & 2033
- Table 33: Rest of Europe Graphene Market Revenue (Million) Forecast, by Application 2020 & 2033
- Table 34: Global Graphene Market Revenue Million Forecast, by Product Type 2020 & 2033
- Table 35: Global Graphene Market Revenue Million Forecast, by End-user Industry 2020 & 2033
- Table 36: Global Graphene Market Revenue Million Forecast, by Country 2020 & 2033
- Table 37: Brazil Graphene Market Revenue (Million) Forecast, by Application 2020 & 2033
- Table 38: Argentina Graphene Market Revenue (Million) Forecast, by Application 2020 & 2033
- Table 39: Colombia Graphene Market Revenue (Million) Forecast, by Application 2020 & 2033
- Table 40: Rest of South America Graphene Market Revenue (Million) Forecast, by Application 2020 & 2033
- Table 41: Global Graphene Market Revenue Million Forecast, by Product Type 2020 & 2033
- Table 42: Global Graphene Market Revenue Million Forecast, by End-user Industry 2020 & 2033
- Table 43: Global Graphene Market Revenue Million Forecast, by Country 2020 & 2033
- Table 44: Saudi Arabia Graphene Market Revenue (Million) Forecast, by Application 2020 & 2033
- Table 45: Qatar Graphene Market Revenue (Million) Forecast, by Application 2020 & 2033
- Table 46: United Arab Emirates Graphene Market Revenue (Million) Forecast, by Application 2020 & 2033
- Table 47: Nigeria Graphene Market Revenue (Million) Forecast, by Application 2020 & 2033
- Table 48: Egypt Graphene Market Revenue (Million) Forecast, by Application 2020 & 2033
- Table 49: South Africa Graphene Market Revenue (Million) Forecast, by Application 2020 & 2033
- Table 50: Rest of Middle East and Africa Graphene Market Revenue (Million) Forecast, by Application 2020 & 2033
Frequently Asked Questions
1. What is the projected Compound Annual Growth Rate (CAGR) of the Graphene Market?
The projected CAGR is approximately 43.64%.
2. Which companies are prominent players in the Graphene Market?
Key companies in the market include Nanoxplore Inc, Vorbeck Materials Corp, ACS Material, First Graphene, G6 Materials Corp, Changzhou Two-Dimensional Carbon Technology Co Ltd, Morsh (Ningbo Moxi Technology Co Ltd), The Sixth Element (Changzhou) Materials Technology Co Ltd, Perpetuus Advanced Materials PLC, Xiamen Knano Graphene Technology Corporation Limited*List Not Exhaustive, Neograf, Universal Matter, Grafoid Inc, Graphene Production, Global Graphene Group, Graphenano Group, Thomas Swan & Co Ltd, Haydale Graphene Industries PLC, Graphenea, Elcora Advanced Materials Corp, Versarien PLC, Graphene Manufacturing Group Ltd.
3. What are the main segments of the Graphene Market?
The market segments include Product Type, End-user Industry.
4. Can you provide details about the market size?
The market size is estimated to be USD 0.79 Million as of 2022.
5. What are some drivers contributing to market growth?
Graphene Aiding the Aerospace Industry; Rising Demand for Printed Electronics.
6. What are the notable trends driving market growth?
Electronics and Telecommunication Segment to Dominate the Market.
7. Are there any restraints impacting market growth?
Higher Costs of Technology.
8. Can you provide examples of recent developments in the market?
In March 2023, Universal Matter UK Limited, a wholly-owned subsidiary of Universal Matter Inc., announced the acquisition of Applied Graphene Materials UK Limited and Applied Graphene Materials LLC, the principal operating subsidiaries of Applied Graphene Materials PLC. Through the acquisition, the company has strengthened its market presence.
9. What pricing options are available for accessing the report?
Pricing options include single-user, multi-user, and enterprise licenses priced at USD 4750, USD 5250, and USD 8750 respectively.
10. Is the market size provided in terms of value or volume?
The market size is provided in terms of value, measured in Million.
11. Are there any specific market keywords associated with the report?
Yes, the market keyword associated with the report is "Graphene Market," which aids in identifying and referencing the specific market segment covered.
12. How do I determine which pricing option suits my needs best?
The pricing options vary based on user requirements and access needs. Individual users may opt for single-user licenses, while businesses requiring broader access may choose multi-user or enterprise licenses for cost-effective access to the report.
13. Are there any additional resources or data provided in the Graphene Market report?
While the report offers comprehensive insights, it's advisable to review the specific contents or supplementary materials provided to ascertain if additional resources or data are available.
14. How can I stay updated on further developments or reports in the Graphene Market?
To stay informed about further developments, trends, and reports in the Graphene Market, consider subscribing to industry newsletters, following relevant companies and organizations, or regularly checking reputable industry news sources and publications.
Methodology
Step 1 - Identification of Relevant Samples Size from Population Database


Step 2 - Approaches for Defining Global Market Size (Value, Volume* & Price*)

Note*: In applicable scenarios
Step 3 - Data Sources
Primary Research
- Web Analytics
- Survey Reports
- Research Institute
- Latest Research Reports
- Opinion Leaders
Secondary Research
- Annual Reports
- White Paper
- Latest Press Release
- Industry Association
- Paid Database
- Investor Presentations

Step 4 - Data Triangulation
Involves using different sources of information in order to increase the validity of a study
These sources are likely to be stakeholders in a program - participants, other researchers, program staff, other community members, and so on.
Then we put all data in single framework & apply various statistical tools to find out the dynamic on the market.
During the analysis stage, feedback from the stakeholder groups would be compared to determine areas of agreement as well as areas of divergence