

Key Insights
The global glucagon injectable market is experiencing robust growth, driven by increasing prevalence of hypoglycemia, particularly among diabetic patients, and rising awareness about the importance of emergency treatment for severe hypoglycemic events. The market is segmented by application (hospital pharmacies, retail pharmacies, online pharmacies, others), and by type (children, adults), reflecting the diverse needs of patients and healthcare settings. Hospital pharmacies currently hold a significant share, but the retail and online pharmacy segments are expected to witness considerable expansion fueled by increasing accessibility and convenience. The market is witnessing a gradual shift towards pre-filled syringes and auto-injectors, improving ease of administration and patient compliance, particularly for emergency use. Technological advancements in drug delivery systems, alongside growing research and development activities aimed at improving glucagon formulations, are key drivers of market growth. While the market faces constraints such as stringent regulatory approvals and high manufacturing costs, the overall outlook remains positive, with significant growth potential in both developed and emerging markets. The competitive landscape is characterized by a mix of established pharmaceutical companies and emerging biotech firms, contributing to innovation and competitive pricing. Growth is anticipated across all regions, with North America and Europe currently dominating the market, while Asia-Pacific is poised for significant expansion in the coming years due to rising diabetes prevalence and increasing healthcare spending.
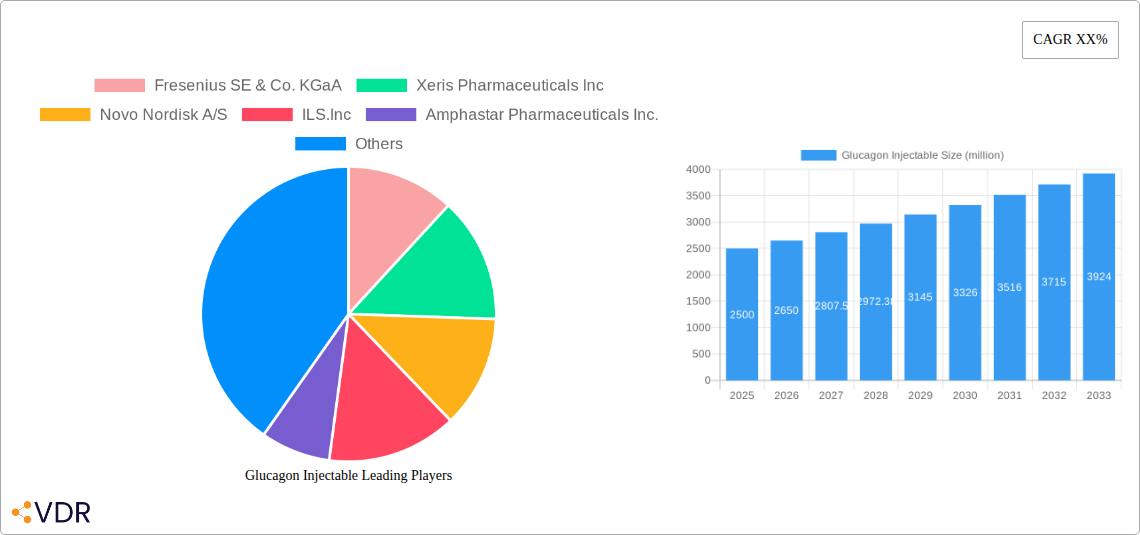
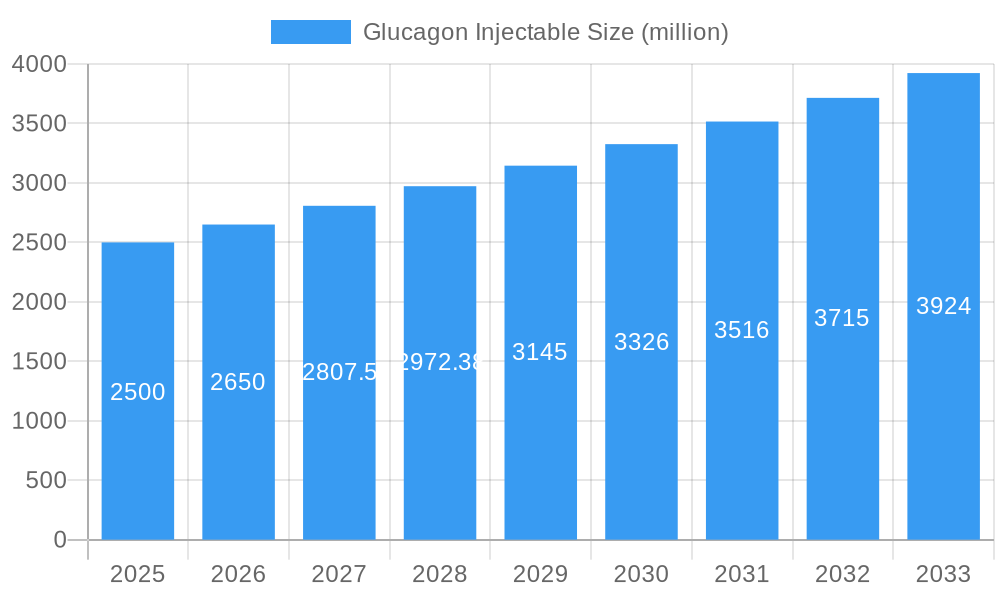
Glucagon Injectable Market Size (In Billion)
The forecast period (2025-2033) suggests a consistent upward trajectory, driven by factors mentioned above. Market expansion is expected to be particularly pronounced in regions with high diabetes prevalence and improving healthcare infrastructure. Furthermore, strategic partnerships and collaborations between pharmaceutical companies and healthcare providers are expected to accelerate market penetration and improve patient access to glucagon injectables. The development of novel glucagon formulations with enhanced efficacy and safety profiles will likely create new opportunities for market growth and contribute to improved patient outcomes in the management of hypoglycemia. While pricing remains a factor, the overall market value is expected to grow substantially throughout the forecast period.
Glucagon Injectable Company Market Share
Glucagon Injectable Market Report: 2019-2033
This comprehensive report provides a detailed analysis of the Glucagon Injectable market, offering invaluable insights for industry professionals, investors, and strategic decision-makers. The report covers the period from 2019 to 2033, with a focus on the forecast period of 2025-2033 and a base year of 2025. The analysis incorporates data from key market segments (Application: Hospital Pharmacies, Retail Pharmacies, Online Pharmacies, Others; Types: Children, Adults) and leading companies, including Fresenius SE & Co. KGaA, Xeris Pharmaceuticals Inc, Novo Nordisk A/S, ILS.Inc, Amphastar Pharmaceuticals Inc., Lilly USA, LLC, Zealand Pharma A/S, and Avalon Pharma Pvt. Ltd. The market is projected to reach xx million units by 2033.
Glucagon Injectable Market Dynamics & Structure
The Glucagon Injectable market is characterized by a moderately concentrated landscape, with a few key players holding significant market share. Technological innovation, particularly in formulation and delivery systems (e.g., pre-filled syringes, auto-injectors), is a major driver. Regulatory frameworks, varying across regions, significantly impact market access and product approvals. Competitive substitutes, such as alternative hypoglycemic agents, exert pressure on market growth. End-user demographics, with a growing elderly population and increasing prevalence of diabetes, are key factors. M&A activity has been moderate, with xx deals recorded between 2019 and 2024, primarily focused on expanding product portfolios and geographical reach.
- Market Concentration: Moderately concentrated, with top 5 players holding approximately xx% market share in 2024.
- Technological Innovation: Focus on improved formulation stability, ease of administration, and pre-filled devices.
- Regulatory Landscape: Stringent regulatory approvals vary across regions, impacting market entry.
- Competitive Substitutes: Alternative hypoglycemic treatments pose a competitive challenge.
- M&A Activity: xx deals recorded between 2019 and 2024, driving market consolidation.
Glucagon Injectable Growth Trends & Insights
The Glucagon Injectable market experienced significant growth between 2019 and 2024, driven by factors such as the increasing prevalence of diabetes and hypoglycemia, rising healthcare expenditure, and growing awareness among patients and healthcare professionals. The market size expanded from xx million units in 2019 to xx million units in 2024, registering a CAGR of xx%. This growth is expected to continue throughout the forecast period, albeit at a slightly moderated pace, reaching xx million units by 2033, with a projected CAGR of xx%. Technological advancements, particularly in the development of more convenient and user-friendly delivery systems, are expected to further boost adoption rates. Shifting consumer preferences towards self-administered therapies will also contribute to market expansion. Increased penetration in emerging markets will also drive future growth.
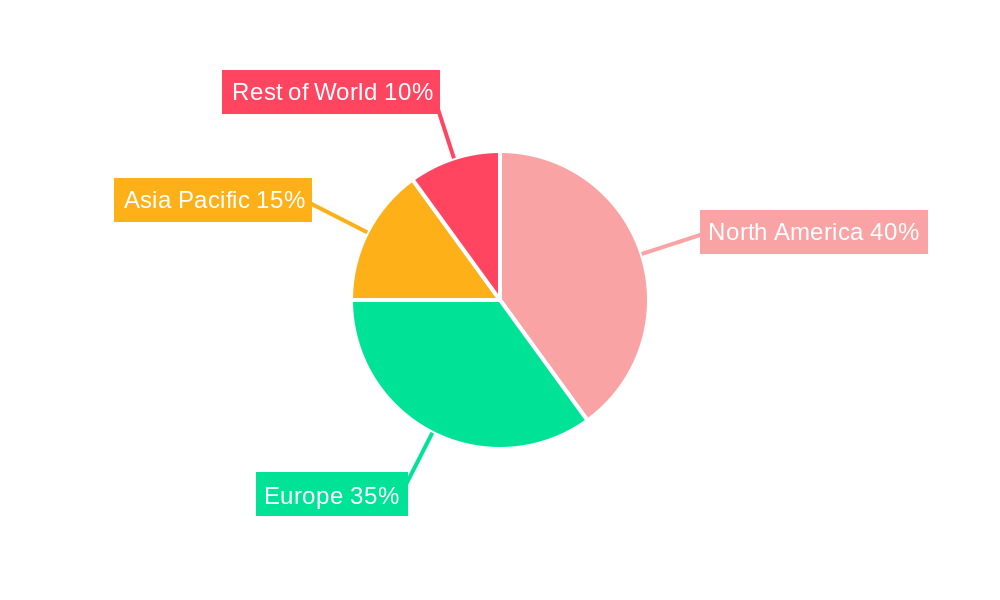
Dominant Regions, Countries, or Segments in Glucagon Injectable
North America currently holds the largest market share in the Glucagon Injectable market, driven by high diabetes prevalence, advanced healthcare infrastructure, and robust regulatory frameworks. Within North America, the United States dominates due to high per capita income and healthcare expenditure. Europe follows as a significant market, fueled by a large aging population and increasing healthcare investments. The Asia-Pacific region presents substantial growth potential, although market penetration remains relatively low compared to developed regions. Within application segments, Hospital Pharmacies lead the market owing to higher volumes of usage and specialized administration practices, followed by Retail Pharmacies. The adult segment dominates due to higher prevalence of diabetes and associated hypoglycemic events.
- North America: High prevalence of diabetes, advanced healthcare infrastructure.
- Europe: Large aging population, increased healthcare spending.
- Asia-Pacific: High growth potential, increasing diabetes prevalence.
- Application Segment: Hospital Pharmacies (largest market share due to higher volumes).
- Type Segment: Adults (largest market share due to higher diabetes prevalence).
Glucagon Injectable Product Landscape
The Glucagon Injectable market features a range of products, including pre-filled syringes, auto-injectors, and powder for reconstitution. Recent innovations focus on improved stability, ease of administration, and reduced injection pain. Pre-filled syringes and auto-injectors offer enhanced convenience and improved patient compliance compared to traditional powder formulations. The unique selling propositions center around improved efficacy, safety, and user-friendliness. Technological advancements are driven by advancements in formulation and delivery systems.
Key Drivers, Barriers & Challenges in Glucagon Injectable
Key Drivers: The increasing prevalence of diabetes, rising healthcare expenditure, and growing awareness of hypoglycemia are key drivers. Technological advancements in delivery systems and improved formulation stability enhance market growth. Favorable regulatory environments in certain regions also contribute.
Key Challenges: High cost of glucagon injectables limits affordability. Complex regulatory pathways in some markets hamper product approvals. Intense competition from established players and emerging companies creates challenges.
Emerging Opportunities in Glucagon Injectable
Emerging markets, particularly in Asia and Africa, present untapped growth potential. The development of novel formulations with enhanced stability and longer shelf life represents a significant opportunity. Expanding usage into new therapeutic areas, coupled with advancements in personalized medicine, could also fuel growth.
Growth Accelerators in the Glucagon Injectable Industry
Strategic partnerships between pharmaceutical companies and healthcare providers will facilitate market access and distribution. Technological breakthroughs in formulation and delivery systems will drive adoption. Further penetration into emerging markets will contribute to long-term market expansion.
Key Players Shaping the Glucagon Injectable Market
- Fresenius SE & Co. KGaA
- Xeris Pharmaceuticals Inc
- Novo Nordisk A/S
- ILS.Inc
- Amphastar Pharmaceuticals Inc.
- Lilly USA, LLC
- Zealand Pharma A/S
- Avalon Pharma Pvt. Ltd.
Notable Milestones in Glucagon Injectable Sector
- 2020: Xeris Pharmaceuticals receives FDA approval for its glucagon injection pen.
- 2021: Novo Nordisk launches a new glucagon formulation with improved stability.
- 2022: Amphastar Pharmaceuticals expands its glucagon product distribution network.
- 2023: Several companies announce investments in R&D for improved glucagon delivery systems.
In-Depth Glucagon Injectable Market Outlook
The Glucagon Injectable market is poised for continued growth, driven by technological advancements, expanding global reach, and increasing prevalence of diabetes and related conditions. Strategic partnerships, further R&D investments in novel formulations, and successful market penetration in emerging economies present significant strategic opportunities for stakeholders.
Glucagon Injectable Segmentation
-
1. Application
- 1.1. Hospital Pharmacies
- 1.2. Retail Pharmacies
- 1.3. Online Pharmacies
- 1.4. Others
-
2. Types
- 2.1. Children
- 2.2. Adults
Glucagon Injectable Segmentation By Geography
-
1. North America
- 1.1. United States
- 1.2. Canada
- 1.3. Mexico
-
2. South America
- 2.1. Brazil
- 2.2. Argentina
- 2.3. Rest of South America
-
3. Europe
- 3.1. United Kingdom
- 3.2. Germany
- 3.3. France
- 3.4. Italy
- 3.5. Spain
- 3.6. Russia
- 3.7. Benelux
- 3.8. Nordics
- 3.9. Rest of Europe
-
4. Middle East & Africa
- 4.1. Turkey
- 4.2. Israel
- 4.3. GCC
- 4.4. North Africa
- 4.5. South Africa
- 4.6. Rest of Middle East & Africa
-
5. Asia Pacific
- 5.1. China
- 5.2. India
- 5.3. Japan
- 5.4. South Korea
- 5.5. ASEAN
- 5.6. Oceania
- 5.7. Rest of Asia Pacific
Glucagon Injectable Regional Market Share
Geographic Coverage of Glucagon Injectable
Glucagon Injectable REPORT HIGHLIGHTS
| Aspects | Details |
|---|---|
| Study Period | 2020-2034 |
| Base Year | 2025 |
| Estimated Year | 2026 |
| Forecast Period | 2026-2034 |
| Historical Period | 2020-2025 |
| Growth Rate | CAGR of XX% from 2020-2034 |
| Segmentation |
|
Table of Contents
- 1. Introduction
- 1.1. Research Scope
- 1.2. Market Segmentation
- 1.3. Research Objective
- 1.4. Definitions and Assumptions
- 2. Executive Summary
- 2.1. Market Snapshot
- 3. Market Dynamics
- 3.1. Market Drivers
- 3.2. Market Restrains
- 3.3. Market Trends
- 3.4. Market Opportunities
- 4. Market Factor Analysis
- 4.1. Porters Five Forces
- 4.1.1. Bargaining Power of Suppliers
- 4.1.2. Bargaining Power of Buyers
- 4.1.3. Threat of New Entrants
- 4.1.4. Threat of Substitutes
- 4.1.5. Competitive Rivalry
- 4.2. PESTEL analysis
- 4.3. BCG Analysis
- 4.3.1. Stars (High Growth, High Market Share)
- 4.3.2. Cash Cows (Low Growth, High Market Share)
- 4.3.3. Question Mark (High Growth, Low Market Share)
- 4.3.4. Dogs (Low Growth, Low Market Share)
- 4.4. Ansoff Matrix Analysis
- 4.5. Supply Chain Analysis
- 4.6. Regulatory Landscape
- 4.7. Current Market Potential and Opportunity Assessment (TAM–SAM–SOM Framework)
- 4.8. VDR Analyst Note
- 4.1. Porters Five Forces
- 5. Market Analysis, Insights and Forecast 2021-2033
- 5.1. Market Analysis, Insights and Forecast - by Application
- 5.1.1. Hospital Pharmacies
- 5.1.2. Retail Pharmacies
- 5.1.3. Online Pharmacies
- 5.1.4. Others
- 5.2. Market Analysis, Insights and Forecast - by Types
- 5.2.1. Children
- 5.2.2. Adults
- 5.3. Market Analysis, Insights and Forecast - by Region
- 5.3.1. North America
- 5.3.2. South America
- 5.3.3. Europe
- 5.3.4. Middle East & Africa
- 5.3.5. Asia Pacific
- 5.1. Market Analysis, Insights and Forecast - by Application
- 6. Global Glucagon Injectable Analysis, Insights and Forecast, 2021-2033
- 6.1. Market Analysis, Insights and Forecast - by Application
- 6.1.1. Hospital Pharmacies
- 6.1.2. Retail Pharmacies
- 6.1.3. Online Pharmacies
- 6.1.4. Others
- 6.2. Market Analysis, Insights and Forecast - by Types
- 6.2.1. Children
- 6.2.2. Adults
- 6.1. Market Analysis, Insights and Forecast - by Application
- 7. North America Glucagon Injectable Analysis, Insights and Forecast, 2021-2033
- 7.1. Market Analysis, Insights and Forecast - by Application
- 7.1.1. Hospital Pharmacies
- 7.1.2. Retail Pharmacies
- 7.1.3. Online Pharmacies
- 7.1.4. Others
- 7.2. Market Analysis, Insights and Forecast - by Types
- 7.2.1. Children
- 7.2.2. Adults
- 7.1. Market Analysis, Insights and Forecast - by Application
- 8. South America Glucagon Injectable Analysis, Insights and Forecast, 2021-2033
- 8.1. Market Analysis, Insights and Forecast - by Application
- 8.1.1. Hospital Pharmacies
- 8.1.2. Retail Pharmacies
- 8.1.3. Online Pharmacies
- 8.1.4. Others
- 8.2. Market Analysis, Insights and Forecast - by Types
- 8.2.1. Children
- 8.2.2. Adults
- 8.1. Market Analysis, Insights and Forecast - by Application
- 9. Europe Glucagon Injectable Analysis, Insights and Forecast, 2021-2033
- 9.1. Market Analysis, Insights and Forecast - by Application
- 9.1.1. Hospital Pharmacies
- 9.1.2. Retail Pharmacies
- 9.1.3. Online Pharmacies
- 9.1.4. Others
- 9.2. Market Analysis, Insights and Forecast - by Types
- 9.2.1. Children
- 9.2.2. Adults
- 9.1. Market Analysis, Insights and Forecast - by Application
- 10. Middle East & Africa Glucagon Injectable Analysis, Insights and Forecast, 2021-2033
- 10.1. Market Analysis, Insights and Forecast - by Application
- 10.1.1. Hospital Pharmacies
- 10.1.2. Retail Pharmacies
- 10.1.3. Online Pharmacies
- 10.1.4. Others
- 10.2. Market Analysis, Insights and Forecast - by Types
- 10.2.1. Children
- 10.2.2. Adults
- 10.1. Market Analysis, Insights and Forecast - by Application
- 11. Asia Pacific Glucagon Injectable Analysis, Insights and Forecast, 2021-2033
- 11.1. Market Analysis, Insights and Forecast - by Application
- 11.1.1. Hospital Pharmacies
- 11.1.2. Retail Pharmacies
- 11.1.3. Online Pharmacies
- 11.1.4. Others
- 11.2. Market Analysis, Insights and Forecast - by Types
- 11.2.1. Children
- 11.2.2. Adults
- 11.1. Market Analysis, Insights and Forecast - by Application
- 12. Competitive Analysis
- 12.1. Company Profiles
- 12.1.1 Fresenius SE & Co. KGaA
- 12.1.1.1. Company Overview
- 12.1.1.2. Products
- 12.1.1.3. Company Financials
- 12.1.1.4. SWOT Analysis
- 12.1.2 Xeris Pharmaceuticals Inc
- 12.1.2.1. Company Overview
- 12.1.2.2. Products
- 12.1.2.3. Company Financials
- 12.1.2.4. SWOT Analysis
- 12.1.3 Novo Nordisk A/S
- 12.1.3.1. Company Overview
- 12.1.3.2. Products
- 12.1.3.3. Company Financials
- 12.1.3.4. SWOT Analysis
- 12.1.4 ILS.Inc
- 12.1.4.1. Company Overview
- 12.1.4.2. Products
- 12.1.4.3. Company Financials
- 12.1.4.4. SWOT Analysis
- 12.1.5 Amphastar Pharmaceuticals Inc.
- 12.1.5.1. Company Overview
- 12.1.5.2. Products
- 12.1.5.3. Company Financials
- 12.1.5.4. SWOT Analysis
- 12.1.6 Lilly USA
- 12.1.6.1. Company Overview
- 12.1.6.2. Products
- 12.1.6.3. Company Financials
- 12.1.6.4. SWOT Analysis
- 12.1.7 LLC
- 12.1.7.1. Company Overview
- 12.1.7.2. Products
- 12.1.7.3. Company Financials
- 12.1.7.4. SWOT Analysis
- 12.1.8 Zealand Pharma A/S.
- 12.1.8.1. Company Overview
- 12.1.8.2. Products
- 12.1.8.3. Company Financials
- 12.1.8.4. SWOT Analysis
- 12.1.9 Avalon Pharma Pvt. Ltd.
- 12.1.9.1. Company Overview
- 12.1.9.2. Products
- 12.1.9.3. Company Financials
- 12.1.9.4. SWOT Analysis
- 12.1.1 Fresenius SE & Co. KGaA
- 12.2. Market Entropy
- 12.2.1 Company's Key Areas Served
- 12.2.2 Recent Developments
- 12.3. Company Market Share Analysis 2025
- 12.3.1 Top 5 Companies Market Share Analysis
- 12.3.2 Top 3 Companies Market Share Analysis
- 12.4. List of Potential Customers
- 13. Research Methodology
List of Figures
- Figure 1: Global Glucagon Injectable Revenue Breakdown (million, %) by Region 2025 & 2033
- Figure 2: Global Glucagon Injectable Volume Breakdown (K, %) by Region 2025 & 2033
- Figure 3: North America Glucagon Injectable Revenue (million), by Application 2025 & 2033
- Figure 4: North America Glucagon Injectable Volume (K), by Application 2025 & 2033
- Figure 5: North America Glucagon Injectable Revenue Share (%), by Application 2025 & 2033
- Figure 6: North America Glucagon Injectable Volume Share (%), by Application 2025 & 2033
- Figure 7: North America Glucagon Injectable Revenue (million), by Types 2025 & 2033
- Figure 8: North America Glucagon Injectable Volume (K), by Types 2025 & 2033
- Figure 9: North America Glucagon Injectable Revenue Share (%), by Types 2025 & 2033
- Figure 10: North America Glucagon Injectable Volume Share (%), by Types 2025 & 2033
- Figure 11: North America Glucagon Injectable Revenue (million), by Country 2025 & 2033
- Figure 12: North America Glucagon Injectable Volume (K), by Country 2025 & 2033
- Figure 13: North America Glucagon Injectable Revenue Share (%), by Country 2025 & 2033
- Figure 14: North America Glucagon Injectable Volume Share (%), by Country 2025 & 2033
- Figure 15: South America Glucagon Injectable Revenue (million), by Application 2025 & 2033
- Figure 16: South America Glucagon Injectable Volume (K), by Application 2025 & 2033
- Figure 17: South America Glucagon Injectable Revenue Share (%), by Application 2025 & 2033
- Figure 18: South America Glucagon Injectable Volume Share (%), by Application 2025 & 2033
- Figure 19: South America Glucagon Injectable Revenue (million), by Types 2025 & 2033
- Figure 20: South America Glucagon Injectable Volume (K), by Types 2025 & 2033
- Figure 21: South America Glucagon Injectable Revenue Share (%), by Types 2025 & 2033
- Figure 22: South America Glucagon Injectable Volume Share (%), by Types 2025 & 2033
- Figure 23: South America Glucagon Injectable Revenue (million), by Country 2025 & 2033
- Figure 24: South America Glucagon Injectable Volume (K), by Country 2025 & 2033
- Figure 25: South America Glucagon Injectable Revenue Share (%), by Country 2025 & 2033
- Figure 26: South America Glucagon Injectable Volume Share (%), by Country 2025 & 2033
- Figure 27: Europe Glucagon Injectable Revenue (million), by Application 2025 & 2033
- Figure 28: Europe Glucagon Injectable Volume (K), by Application 2025 & 2033
- Figure 29: Europe Glucagon Injectable Revenue Share (%), by Application 2025 & 2033
- Figure 30: Europe Glucagon Injectable Volume Share (%), by Application 2025 & 2033
- Figure 31: Europe Glucagon Injectable Revenue (million), by Types 2025 & 2033
- Figure 32: Europe Glucagon Injectable Volume (K), by Types 2025 & 2033
- Figure 33: Europe Glucagon Injectable Revenue Share (%), by Types 2025 & 2033
- Figure 34: Europe Glucagon Injectable Volume Share (%), by Types 2025 & 2033
- Figure 35: Europe Glucagon Injectable Revenue (million), by Country 2025 & 2033
- Figure 36: Europe Glucagon Injectable Volume (K), by Country 2025 & 2033
- Figure 37: Europe Glucagon Injectable Revenue Share (%), by Country 2025 & 2033
- Figure 38: Europe Glucagon Injectable Volume Share (%), by Country 2025 & 2033
- Figure 39: Middle East & Africa Glucagon Injectable Revenue (million), by Application 2025 & 2033
- Figure 40: Middle East & Africa Glucagon Injectable Volume (K), by Application 2025 & 2033
- Figure 41: Middle East & Africa Glucagon Injectable Revenue Share (%), by Application 2025 & 2033
- Figure 42: Middle East & Africa Glucagon Injectable Volume Share (%), by Application 2025 & 2033
- Figure 43: Middle East & Africa Glucagon Injectable Revenue (million), by Types 2025 & 2033
- Figure 44: Middle East & Africa Glucagon Injectable Volume (K), by Types 2025 & 2033
- Figure 45: Middle East & Africa Glucagon Injectable Revenue Share (%), by Types 2025 & 2033
- Figure 46: Middle East & Africa Glucagon Injectable Volume Share (%), by Types 2025 & 2033
- Figure 47: Middle East & Africa Glucagon Injectable Revenue (million), by Country 2025 & 2033
- Figure 48: Middle East & Africa Glucagon Injectable Volume (K), by Country 2025 & 2033
- Figure 49: Middle East & Africa Glucagon Injectable Revenue Share (%), by Country 2025 & 2033
- Figure 50: Middle East & Africa Glucagon Injectable Volume Share (%), by Country 2025 & 2033
- Figure 51: Asia Pacific Glucagon Injectable Revenue (million), by Application 2025 & 2033
- Figure 52: Asia Pacific Glucagon Injectable Volume (K), by Application 2025 & 2033
- Figure 53: Asia Pacific Glucagon Injectable Revenue Share (%), by Application 2025 & 2033
- Figure 54: Asia Pacific Glucagon Injectable Volume Share (%), by Application 2025 & 2033
- Figure 55: Asia Pacific Glucagon Injectable Revenue (million), by Types 2025 & 2033
- Figure 56: Asia Pacific Glucagon Injectable Volume (K), by Types 2025 & 2033
- Figure 57: Asia Pacific Glucagon Injectable Revenue Share (%), by Types 2025 & 2033
- Figure 58: Asia Pacific Glucagon Injectable Volume Share (%), by Types 2025 & 2033
- Figure 59: Asia Pacific Glucagon Injectable Revenue (million), by Country 2025 & 2033
- Figure 60: Asia Pacific Glucagon Injectable Volume (K), by Country 2025 & 2033
- Figure 61: Asia Pacific Glucagon Injectable Revenue Share (%), by Country 2025 & 2033
- Figure 62: Asia Pacific Glucagon Injectable Volume Share (%), by Country 2025 & 2033
List of Tables
- Table 1: Global Glucagon Injectable Revenue million Forecast, by Application 2020 & 2033
- Table 2: Global Glucagon Injectable Volume K Forecast, by Application 2020 & 2033
- Table 3: Global Glucagon Injectable Revenue million Forecast, by Types 2020 & 2033
- Table 4: Global Glucagon Injectable Volume K Forecast, by Types 2020 & 2033
- Table 5: Global Glucagon Injectable Revenue million Forecast, by Region 2020 & 2033
- Table 6: Global Glucagon Injectable Volume K Forecast, by Region 2020 & 2033
- Table 7: Global Glucagon Injectable Revenue million Forecast, by Application 2020 & 2033
- Table 8: Global Glucagon Injectable Volume K Forecast, by Application 2020 & 2033
- Table 9: Global Glucagon Injectable Revenue million Forecast, by Types 2020 & 2033
- Table 10: Global Glucagon Injectable Volume K Forecast, by Types 2020 & 2033
- Table 11: Global Glucagon Injectable Revenue million Forecast, by Country 2020 & 2033
- Table 12: Global Glucagon Injectable Volume K Forecast, by Country 2020 & 2033
- Table 13: United States Glucagon Injectable Revenue (million) Forecast, by Application 2020 & 2033
- Table 14: United States Glucagon Injectable Volume (K) Forecast, by Application 2020 & 2033
- Table 15: Canada Glucagon Injectable Revenue (million) Forecast, by Application 2020 & 2033
- Table 16: Canada Glucagon Injectable Volume (K) Forecast, by Application 2020 & 2033
- Table 17: Mexico Glucagon Injectable Revenue (million) Forecast, by Application 2020 & 2033
- Table 18: Mexico Glucagon Injectable Volume (K) Forecast, by Application 2020 & 2033
- Table 19: Global Glucagon Injectable Revenue million Forecast, by Application 2020 & 2033
- Table 20: Global Glucagon Injectable Volume K Forecast, by Application 2020 & 2033
- Table 21: Global Glucagon Injectable Revenue million Forecast, by Types 2020 & 2033
- Table 22: Global Glucagon Injectable Volume K Forecast, by Types 2020 & 2033
- Table 23: Global Glucagon Injectable Revenue million Forecast, by Country 2020 & 2033
- Table 24: Global Glucagon Injectable Volume K Forecast, by Country 2020 & 2033
- Table 25: Brazil Glucagon Injectable Revenue (million) Forecast, by Application 2020 & 2033
- Table 26: Brazil Glucagon Injectable Volume (K) Forecast, by Application 2020 & 2033
- Table 27: Argentina Glucagon Injectable Revenue (million) Forecast, by Application 2020 & 2033
- Table 28: Argentina Glucagon Injectable Volume (K) Forecast, by Application 2020 & 2033
- Table 29: Rest of South America Glucagon Injectable Revenue (million) Forecast, by Application 2020 & 2033
- Table 30: Rest of South America Glucagon Injectable Volume (K) Forecast, by Application 2020 & 2033
- Table 31: Global Glucagon Injectable Revenue million Forecast, by Application 2020 & 2033
- Table 32: Global Glucagon Injectable Volume K Forecast, by Application 2020 & 2033
- Table 33: Global Glucagon Injectable Revenue million Forecast, by Types 2020 & 2033
- Table 34: Global Glucagon Injectable Volume K Forecast, by Types 2020 & 2033
- Table 35: Global Glucagon Injectable Revenue million Forecast, by Country 2020 & 2033
- Table 36: Global Glucagon Injectable Volume K Forecast, by Country 2020 & 2033
- Table 37: United Kingdom Glucagon Injectable Revenue (million) Forecast, by Application 2020 & 2033
- Table 38: United Kingdom Glucagon Injectable Volume (K) Forecast, by Application 2020 & 2033
- Table 39: Germany Glucagon Injectable Revenue (million) Forecast, by Application 2020 & 2033
- Table 40: Germany Glucagon Injectable Volume (K) Forecast, by Application 2020 & 2033
- Table 41: France Glucagon Injectable Revenue (million) Forecast, by Application 2020 & 2033
- Table 42: France Glucagon Injectable Volume (K) Forecast, by Application 2020 & 2033
- Table 43: Italy Glucagon Injectable Revenue (million) Forecast, by Application 2020 & 2033
- Table 44: Italy Glucagon Injectable Volume (K) Forecast, by Application 2020 & 2033
- Table 45: Spain Glucagon Injectable Revenue (million) Forecast, by Application 2020 & 2033
- Table 46: Spain Glucagon Injectable Volume (K) Forecast, by Application 2020 & 2033
- Table 47: Russia Glucagon Injectable Revenue (million) Forecast, by Application 2020 & 2033
- Table 48: Russia Glucagon Injectable Volume (K) Forecast, by Application 2020 & 2033
- Table 49: Benelux Glucagon Injectable Revenue (million) Forecast, by Application 2020 & 2033
- Table 50: Benelux Glucagon Injectable Volume (K) Forecast, by Application 2020 & 2033
- Table 51: Nordics Glucagon Injectable Revenue (million) Forecast, by Application 2020 & 2033
- Table 52: Nordics Glucagon Injectable Volume (K) Forecast, by Application 2020 & 2033
- Table 53: Rest of Europe Glucagon Injectable Revenue (million) Forecast, by Application 2020 & 2033
- Table 54: Rest of Europe Glucagon Injectable Volume (K) Forecast, by Application 2020 & 2033
- Table 55: Global Glucagon Injectable Revenue million Forecast, by Application 2020 & 2033
- Table 56: Global Glucagon Injectable Volume K Forecast, by Application 2020 & 2033
- Table 57: Global Glucagon Injectable Revenue million Forecast, by Types 2020 & 2033
- Table 58: Global Glucagon Injectable Volume K Forecast, by Types 2020 & 2033
- Table 59: Global Glucagon Injectable Revenue million Forecast, by Country 2020 & 2033
- Table 60: Global Glucagon Injectable Volume K Forecast, by Country 2020 & 2033
- Table 61: Turkey Glucagon Injectable Revenue (million) Forecast, by Application 2020 & 2033
- Table 62: Turkey Glucagon Injectable Volume (K) Forecast, by Application 2020 & 2033
- Table 63: Israel Glucagon Injectable Revenue (million) Forecast, by Application 2020 & 2033
- Table 64: Israel Glucagon Injectable Volume (K) Forecast, by Application 2020 & 2033
- Table 65: GCC Glucagon Injectable Revenue (million) Forecast, by Application 2020 & 2033
- Table 66: GCC Glucagon Injectable Volume (K) Forecast, by Application 2020 & 2033
- Table 67: North Africa Glucagon Injectable Revenue (million) Forecast, by Application 2020 & 2033
- Table 68: North Africa Glucagon Injectable Volume (K) Forecast, by Application 2020 & 2033
- Table 69: South Africa Glucagon Injectable Revenue (million) Forecast, by Application 2020 & 2033
- Table 70: South Africa Glucagon Injectable Volume (K) Forecast, by Application 2020 & 2033
- Table 71: Rest of Middle East & Africa Glucagon Injectable Revenue (million) Forecast, by Application 2020 & 2033
- Table 72: Rest of Middle East & Africa Glucagon Injectable Volume (K) Forecast, by Application 2020 & 2033
- Table 73: Global Glucagon Injectable Revenue million Forecast, by Application 2020 & 2033
- Table 74: Global Glucagon Injectable Volume K Forecast, by Application 2020 & 2033
- Table 75: Global Glucagon Injectable Revenue million Forecast, by Types 2020 & 2033
- Table 76: Global Glucagon Injectable Volume K Forecast, by Types 2020 & 2033
- Table 77: Global Glucagon Injectable Revenue million Forecast, by Country 2020 & 2033
- Table 78: Global Glucagon Injectable Volume K Forecast, by Country 2020 & 2033
- Table 79: China Glucagon Injectable Revenue (million) Forecast, by Application 2020 & 2033
- Table 80: China Glucagon Injectable Volume (K) Forecast, by Application 2020 & 2033
- Table 81: India Glucagon Injectable Revenue (million) Forecast, by Application 2020 & 2033
- Table 82: India Glucagon Injectable Volume (K) Forecast, by Application 2020 & 2033
- Table 83: Japan Glucagon Injectable Revenue (million) Forecast, by Application 2020 & 2033
- Table 84: Japan Glucagon Injectable Volume (K) Forecast, by Application 2020 & 2033
- Table 85: South Korea Glucagon Injectable Revenue (million) Forecast, by Application 2020 & 2033
- Table 86: South Korea Glucagon Injectable Volume (K) Forecast, by Application 2020 & 2033
- Table 87: ASEAN Glucagon Injectable Revenue (million) Forecast, by Application 2020 & 2033
- Table 88: ASEAN Glucagon Injectable Volume (K) Forecast, by Application 2020 & 2033
- Table 89: Oceania Glucagon Injectable Revenue (million) Forecast, by Application 2020 & 2033
- Table 90: Oceania Glucagon Injectable Volume (K) Forecast, by Application 2020 & 2033
- Table 91: Rest of Asia Pacific Glucagon Injectable Revenue (million) Forecast, by Application 2020 & 2033
- Table 92: Rest of Asia Pacific Glucagon Injectable Volume (K) Forecast, by Application 2020 & 2033
Frequently Asked Questions
1. What is the projected Compound Annual Growth Rate (CAGR) of the Glucagon Injectable?
The projected CAGR is approximately XX%.
2. Which companies are prominent players in the Glucagon Injectable?
Key companies in the market include Fresenius SE & Co. KGaA, Xeris Pharmaceuticals Inc, Novo Nordisk A/S, ILS.Inc, Amphastar Pharmaceuticals Inc., Lilly USA, LLC, Zealand Pharma A/S., Avalon Pharma Pvt. Ltd..
3. What are the main segments of the Glucagon Injectable?
The market segments include Application, Types.
4. Can you provide details about the market size?
The market size is estimated to be USD XXX million as of 2022.
5. What are some drivers contributing to market growth?
N/A
6. What are the notable trends driving market growth?
N/A
7. Are there any restraints impacting market growth?
N/A
8. Can you provide examples of recent developments in the market?
N/A
9. What pricing options are available for accessing the report?
Pricing options include single-user, multi-user, and enterprise licenses priced at USD 3350.00, USD 5025.00, and USD 6700.00 respectively.
10. Is the market size provided in terms of value or volume?
The market size is provided in terms of value, measured in million and volume, measured in K.
11. Are there any specific market keywords associated with the report?
Yes, the market keyword associated with the report is "Glucagon Injectable," which aids in identifying and referencing the specific market segment covered.
12. How do I determine which pricing option suits my needs best?
The pricing options vary based on user requirements and access needs. Individual users may opt for single-user licenses, while businesses requiring broader access may choose multi-user or enterprise licenses for cost-effective access to the report.
13. Are there any additional resources or data provided in the Glucagon Injectable report?
While the report offers comprehensive insights, it's advisable to review the specific contents or supplementary materials provided to ascertain if additional resources or data are available.
14. How can I stay updated on further developments or reports in the Glucagon Injectable?
To stay informed about further developments, trends, and reports in the Glucagon Injectable, consider subscribing to industry newsletters, following relevant companies and organizations, or regularly checking reputable industry news sources and publications.
Methodology
Step 1 - Identification of Relevant Samples Size from Population Database


Step 2 - Approaches for Defining Global Market Size (Value, Volume* & Price*)

Note*: In applicable scenarios
Step 3 - Data Sources
Primary Research
- Web Analytics
- Survey Reports
- Research Institute
- Latest Research Reports
- Opinion Leaders
Secondary Research
- Annual Reports
- White Paper
- Latest Press Release
- Industry Association
- Paid Database
- Investor Presentations

Step 4 - Data Triangulation
Involves using different sources of information in order to increase the validity of a study
These sources are likely to be stakeholders in a program - participants, other researchers, program staff, other community members, and so on.
Then we put all data in single framework & apply various statistical tools to find out the dynamic on the market.
During the analysis stage, feedback from the stakeholder groups would be compared to determine areas of agreement as well as areas of divergence