

Key Insights
The Global Shipping Container Market is projected to reach $12.32 billion by 2025, with a projected Compound Annual Growth Rate (CAGR) of 3.4%. This expansion is fueled by increasing global trade volumes, the demand for efficient logistics, and the growth of intermodal transportation. The rise of e-commerce and the need for specialized containers, such as refrigerated and high cube units, are also key drivers. Government initiatives supporting trade and infrastructure development further enhance market adoption.
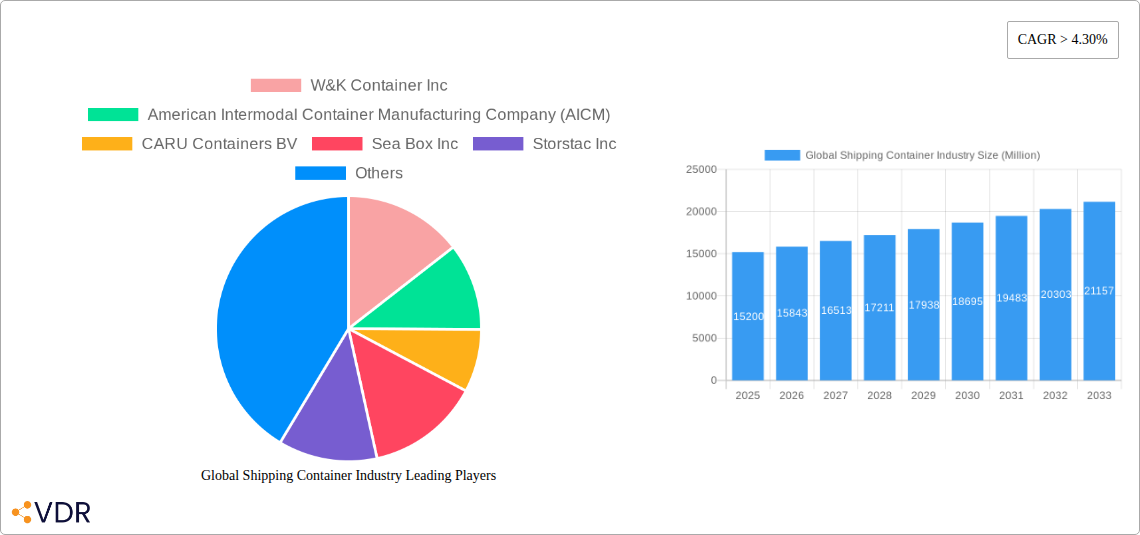
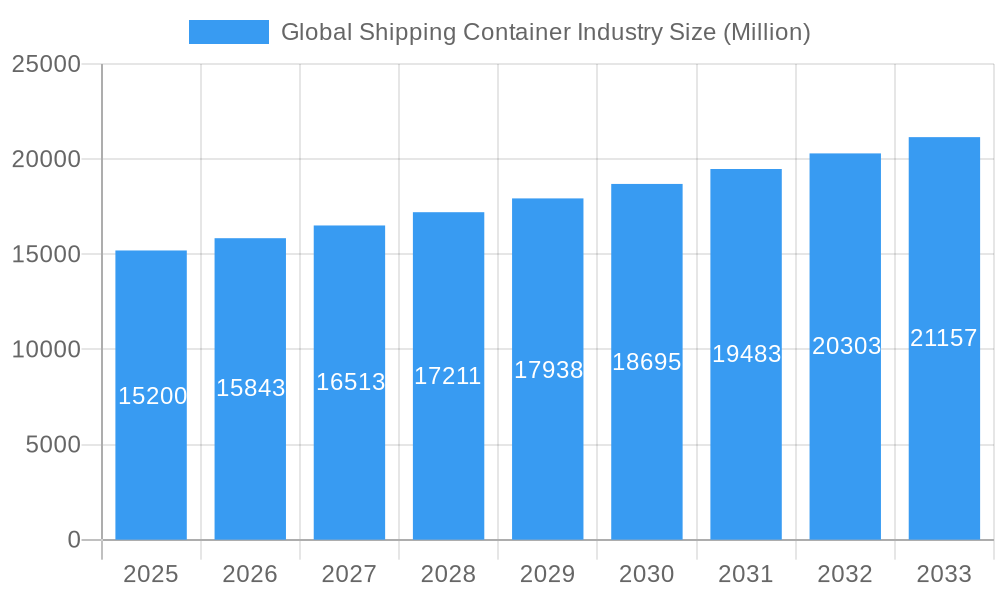
Global Shipping Container Industry Market Size (In Billion)
Market challenges include fluctuations in raw material costs, geopolitical tensions impacting supply chains, and environmental regulations requiring investment in sustainable practices. Despite these factors, the continuous demand for goods movement and technological advancements in container design and manufacturing are expected to drive growth. The market is segmented by size (20ft, 40ft, High Cube) and type (Dry Storage, Refrigerated, Tank), addressing diverse logistical needs.
Global Shipping Container Industry Company Market Share
Unlocking Global Trade: Comprehensive Report on the Shipping Container Industry (2019–2033)
Global shipping container market size expected to witness robust growth, driven by increasing international trade volumes and the demand for efficient logistics solutions. This in-depth report offers a definitive analysis of the shipping container industry, covering container manufacturing market trends, intermodal container market dynamics, and the vital role of cold chain logistics. Explore the dry storage container market, the burgeoning refrigerated container market, and the specialized tank container market. With a detailed forecast period from 2025–2033, build your strategy around critical insights into container logistics, container fleet management, and the future of container shipping.
Global Shipping Container Industry Market Dynamics & Structure
The global shipping container industry is characterized by a moderately concentrated market, with key players like China International Marine Containers Co Ltd and Maersk Container Industry AS holding significant influence. Technological innovation is primarily driven by the need for enhanced durability, lighter materials, and smart container solutions for real-time tracking and monitoring. Regulatory frameworks, such as international maritime safety standards and environmental regulations, play a crucial role in shaping manufacturing processes and product specifications. Competitive product substitutes include specialized cargo handling equipment and advancements in direct shipping models, though the ubiquity of standardized containers remains a strong competitive advantage. End-user demographics span a wide range, from multinational logistics giants and shipping lines to individual businesses relying on international trade. Mergers and acquisitions (M&A) trends, while experiencing recent notable developments like the abandoned CIMC-Maersk merger, continue to influence market consolidation and technological integration.
- Market Concentration: Dominated by a few large players, with regional manufacturing hubs in Asia.
- Technological Drivers: Focus on smart containers, durable materials, and sustainable manufacturing.
- Regulatory Frameworks: IMO regulations, environmental standards, and trade agreements.
- Competitive Substitutes: Advances in direct shipping, specialized cargo solutions.
- End-User Demographics: Global trade participants, logistics providers, manufacturing sectors.
- M&A Trends: Strategic alliances and divestitures influencing market structure.
Global Shipping Container Industry Growth Trends & Insights
The global shipping container industry is projected to expand significantly, driven by a persistent increase in international trade and the ever-growing need for efficient and secure global logistics. The market size of shipping containers is expected to ascend to new heights as economies worldwide become more interconnected. Adoption rates for various container types, from standard dry storage containers to specialized refrigerated containers for perishable goods and tank containers for liquid and gas transport, are evolving in response to shifting trade patterns and consumer demands. Technological disruptions are continually reshaping the landscape, with the integration of IoT devices for smart container capabilities, offering enhanced visibility, security, and inventory management. This digital transformation is not merely an upgrade but a fundamental shift in how cargo is tracked and managed throughout its journey. Consumer behavior shifts, particularly the rise of e-commerce and its global reach, are indirectly boosting demand for containers by fueling the volume of goods transported across borders. The overall CAGR of the market is influenced by these multifaceted factors, with specific metrics highlighting increased efficiency and reduced transit times as key indicators of market penetration. The container manufacturing market is a direct beneficiary of these trends, with ongoing investments in production capacity and technological advancements to meet the escalating demand. Understanding these evolving dynamics is crucial for stakeholders looking to navigate and capitalize on the future trajectory of the intermodal container market.
Dominant Regions, Countries, or Segments in Global Shipping Container Industry
The global shipping container industry is currently witnessing its most robust growth and dominance stemming from Asia-Pacific, particularly China. This region's ascendancy is attributed to its unparalleled manufacturing capabilities, extensive port infrastructure, and its pivotal role in global supply chains. Among the container segments, Large Containers (40 Feet) and High Cube Containers are currently the most dominant, reflecting the prevailing trade patterns that favor bulk shipments and higher volume cargo. The Dry Storage Container segment remains the workhorse of the industry, representing the largest market share due to its versatility and widespread use across various commodities. However, the Refrigerated Container market is experiencing significant growth, propelled by the increasing global demand for temperature-sensitive goods such as pharmaceuticals, fresh produce, and frozen foods, driven by evolving consumer lifestyles and sophisticated cold chain logistics requirements. Economic policies supporting export-oriented manufacturing, coupled with substantial government investments in port development and intermodal connectivity within Asia-Pacific, have created a fertile ground for expansion. Market share within this region is heavily skewed towards Chinese manufacturers, but other Southeast Asian nations are also steadily increasing their production capacities. The growth potential in this region is immense, fueled by ongoing industrialization and a continued reliance on global trade for economic prosperity. The increasing complexity of supply chains and the need for specialized transport solutions also point towards a sustained upward trajectory for segments like refrigerated and tank containers.
- Dominant Region: Asia-Pacific (especially China)
- Leading Segments (by volume):
- Large Container (40 Feet)
- High Cube Container
- Dry Storage Container
- High Growth Segment: Refrigerated Container
- Key Drivers:
- Manufacturing Hubs & Export-Oriented Economies
- Advanced Port Infrastructure & Connectivity
- Supportive Government Policies
- Growing Demand for Temperature-Controlled Goods
Global Shipping Container Industry Product Landscape
The product landscape of the global shipping container industry is characterized by continuous innovation aimed at enhancing efficiency, durability, and functionality. Key product developments include the introduction of lightweight yet robust steel alloys for increased payload capacity and reduced fuel consumption. Smart container technology, integrating GPS tracking, temperature sensors, and shock detectors, is becoming a standard offering for high-value cargo and sensitive shipments. Furthermore, specialized containers such as modular offshore containers designed for harsh environments and custom-built units for unique industrial applications are expanding the market's reach. The performance metrics being optimized include tensile strength, corrosion resistance, and thermal insulation, ensuring cargo integrity under diverse environmental conditions.
Key Drivers, Barriers & Challenges in Global Shipping Container Industry
The global shipping container industry is propelled by several key drivers, including the sustained growth of international trade, the expansion of e-commerce, and the increasing demand for efficient global supply chains. Technological advancements in manufacturing, such as the use of advanced materials and automation, also contribute to market expansion. Government initiatives promoting trade and investment, alongside infrastructure development in emerging economies, further accelerate growth.
However, the industry faces significant barriers and challenges. Fluctuations in global economic conditions and trade policies can impact demand. Supply chain disruptions, as witnessed during recent global events, pose a major threat to the availability and pricing of containers. Intense competition among manufacturers can lead to price wars and pressure on profit margins. Regulatory hurdles related to environmental standards and safety compliance can increase operational costs. Furthermore, the high capital investment required for manufacturing facilities and the cyclical nature of the industry present substantial financial challenges.
Emerging Opportunities in Global Shipping Container Industry
Emerging opportunities within the shipping container market are diverse and promising. The growing emphasis on sustainable logistics presents a significant opportunity for manufacturers developing eco-friendly containers, utilizing recycled materials, and optimizing designs for reduced carbon footprints. The expansion of specialized cargo transport, particularly in the refrigerated container market driven by the pharmaceutical and food industries, offers substantial growth potential. The increasing adoption of smart container technologies, providing real-time data and enhanced security, is opening avenues for value-added services and data analytics solutions. Furthermore, the development of modular and multi-purpose container designs caters to niche markets and emerging logistical needs in sectors like construction and disaster relief. Untapped markets in developing economies with expanding trade ties also represent significant growth prospects.
Growth Accelerators in the Global Shipping Container Industry Industry
Several catalysts are accelerating the long-term growth of the global shipping container industry. Technological breakthroughs in materials science are enabling the production of lighter, stronger, and more durable containers, thereby improving payload capacity and reducing transportation costs. Strategic partnerships between container manufacturers, shipping lines, and technology providers are fostering innovation in smart container solutions and integrated logistics platforms. Market expansion strategies, particularly the focus on emerging economies with burgeoning trade volumes, are creating new demand centers. The ongoing digitalization of the shipping industry, including the adoption of blockchain for enhanced transparency and efficiency, is also a significant growth accelerator, streamlining operations and improving cargo visibility.
Key Players Shaping the Global Shipping Container Industry Market
- W&K Container Inc
- American Intermodal Container Manufacturing Company (AICM)
- CARU Containers BV
- Sea Box Inc
- Storstac Inc
- China International Marine Containers Co Ltd
- Singamas Container Holdings Limited
- Valisons & Co
- CXIC (Changzhou Xinhuachang Int'l Containers) Co Ltd
- YMC Container Solutions
- Ritveyraaj Cargo Shipping Containers
- Maersk Container Industry AS
- TLS Offshore Containers International Pvt Ltd
- Dong Fang International Container (Hong Kong) Co Ltd
- China Eastern Containers
Notable Milestones in Global Shipping Container Industry Sector
- August 2022: China International Marine Containers (CIMC) and Maersk Container Industry announced the abandonment of their planned merger due to significant regulatory challenges. This development underscores the scrutiny faced by major players in consolidating the global cold supply chain.
- September 2021: CIMC had previously agreed to acquire Maersk's refrigerated container business for USD 987.3 million, a deal that highlighted the strategic importance of the refrigerated container segment and potential market concentration concerns.
- May 2022: Mazagon Dock Shipbuilders entered the container manufacturing business by securing an order from Container Corporation of India Ltd (CONCOR) for 2,500 cargo-carrying steel boxes.
- May 2022: The CONCOR order involved the introduction of 12-foot containers in India, a move aimed at addressing the persistent container shortage issues faced by Indian exporters, particularly highlighted during the COVID-19 pandemic.
- May 2022: The cost of the steel boxes for the CONCOR order was estimated between INR 35 million (USD 0.43 million) and INR 40 million (USD 0.49 million) per unit, with the total deal valued at approximately INR 1 million (USD 12.18 million).
In-Depth Global Shipping Container Industry Market Outlook
The global shipping container industry is poised for sustained growth, driven by robust international trade flows and the increasing demand for efficient and reliable logistics solutions. Growth accelerators such as technological innovation in smart containers, advancements in manufacturing materials, and the expansion of specialized segments like refrigerated and tank containers will continue to shape the market. Emerging opportunities in sustainable container development and untapped geographical markets offer significant potential for strategic expansion. Stakeholders can leverage the increasing digitalization of the shipping sector and evolving consumer preferences for globalized e-commerce to capitalize on future market dynamics. The outlook remains positive, with a focus on resilience, sustainability, and technological integration as key pillars for success.
Global Shipping Container Industry Segmentation
-
1. Size
- 1.1. Small Container (20 Feet)
- 1.2. Large Container (40 Feet)
- 1.3. High Cube Container
-
2. Type
- 2.1. Dry Storage Container
- 2.2. Refrigerated Container
- 2.3. Tank Container
Global Shipping Container Industry Segmentation By Geography
-
1. North America
- 1.1. United States
- 1.2. Canada
-
2. Europe
- 2.1. Germany
- 2.2. United Kingdom
- 2.3. France
- 2.4. Rest of Europe
-
3. Asia Pacific
- 3.1. China
- 3.2. Japan
- 3.3. India
- 3.4. Rest of Asia Pacific
-
4. Middle East and Africa
- 4.1. South Africa
- 4.2. United Arab Emirates
- 4.3. Saudi Arabia
- 4.4. Rest of the Middle East and Africa
-
5. Latin America
- 5.1. Mexico
- 5.2. Brazil
- 5.3. Argentina
- 5.4. Rest of the Latin America
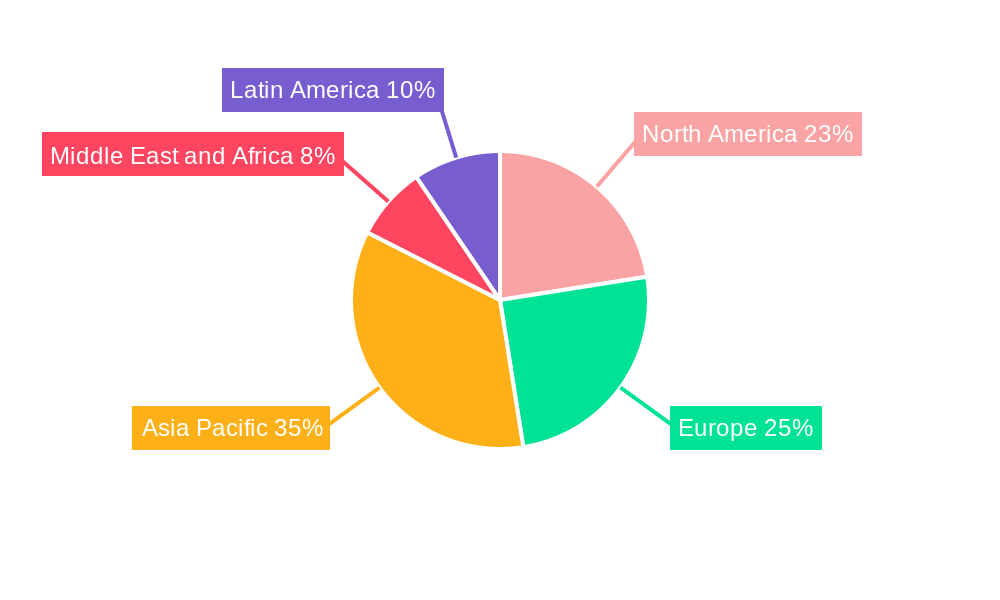
Global Shipping Container Industry Regional Market Share
Geographic Coverage of Global Shipping Container Industry
Global Shipping Container Industry REPORT HIGHLIGHTS
| Aspects | Details |
|---|---|
| Study Period | 2020-2034 |
| Base Year | 2025 |
| Estimated Year | 2026 |
| Forecast Period | 2026-2034 |
| Historical Period | 2020-2025 |
| Growth Rate | CAGR of 3.4% from 2020-2034 |
| Segmentation |
|
Table of Contents
- 1. Introduction
- 1.1. Research Scope
- 1.2. Market Segmentation
- 1.3. Research Objective
- 1.4. Definitions and Assumptions
- 2. Executive Summary
- 2.1. Market Snapshot
- 3. Market Dynamics
- 3.1. Market Drivers
- 3.2. Market Restrains
- 3.3. Market Trends
- 3.4. Market Opportunities
- 4. Market Factor Analysis
- 4.1. Porters Five Forces
- 4.1.1. Bargaining Power of Suppliers
- 4.1.2. Bargaining Power of Buyers
- 4.1.3. Threat of New Entrants
- 4.1.4. Threat of Substitutes
- 4.1.5. Competitive Rivalry
- 4.2. PESTEL analysis
- 4.3. BCG Analysis
- 4.3.1. Stars (High Growth, High Market Share)
- 4.3.2. Cash Cows (Low Growth, High Market Share)
- 4.3.3. Question Mark (High Growth, Low Market Share)
- 4.3.4. Dogs (Low Growth, Low Market Share)
- 4.4. Ansoff Matrix Analysis
- 4.5. Supply Chain Analysis
- 4.6. Regulatory Landscape
- 4.7. Current Market Potential and Opportunity Assessment (TAM–SAM–SOM Framework)
- 4.8. VDR Analyst Note
- 4.1. Porters Five Forces
- 5. Market Analysis, Insights and Forecast 2021-2033
- 5.1. Market Analysis, Insights and Forecast - by Size
- 5.1.1. Small Container (20 Feet)
- 5.1.2. Large Container (40 Feet)
- 5.1.3. High Cube Container
- 5.2. Market Analysis, Insights and Forecast - by Type
- 5.2.1. Dry Storage Container
- 5.2.2. Refrigerated Container
- 5.2.3. Tank Container
- 5.3. Market Analysis, Insights and Forecast - by Region
- 5.3.1. North America
- 5.3.2. Europe
- 5.3.3. Asia Pacific
- 5.3.4. Middle East and Africa
- 5.3.5. Latin America
- 5.1. Market Analysis, Insights and Forecast - by Size
- 6. Global Shipping Container Industry Analysis, Insights and Forecast, 2021-2033
- 6.1. Market Analysis, Insights and Forecast - by Size
- 6.1.1. Small Container (20 Feet)
- 6.1.2. Large Container (40 Feet)
- 6.1.3. High Cube Container
- 6.2. Market Analysis, Insights and Forecast - by Type
- 6.2.1. Dry Storage Container
- 6.2.2. Refrigerated Container
- 6.2.3. Tank Container
- 6.1. Market Analysis, Insights and Forecast - by Size
- 7. North America Global Shipping Container Industry Analysis, Insights and Forecast, 2021-2033
- 7.1. Market Analysis, Insights and Forecast - by Size
- 7.1.1. Small Container (20 Feet)
- 7.1.2. Large Container (40 Feet)
- 7.1.3. High Cube Container
- 7.2. Market Analysis, Insights and Forecast - by Type
- 7.2.1. Dry Storage Container
- 7.2.2. Refrigerated Container
- 7.2.3. Tank Container
- 7.1. Market Analysis, Insights and Forecast - by Size
- 8. Europe Global Shipping Container Industry Analysis, Insights and Forecast, 2021-2033
- 8.1. Market Analysis, Insights and Forecast - by Size
- 8.1.1. Small Container (20 Feet)
- 8.1.2. Large Container (40 Feet)
- 8.1.3. High Cube Container
- 8.2. Market Analysis, Insights and Forecast - by Type
- 8.2.1. Dry Storage Container
- 8.2.2. Refrigerated Container
- 8.2.3. Tank Container
- 8.1. Market Analysis, Insights and Forecast - by Size
- 9. Asia Pacific Global Shipping Container Industry Analysis, Insights and Forecast, 2021-2033
- 9.1. Market Analysis, Insights and Forecast - by Size
- 9.1.1. Small Container (20 Feet)
- 9.1.2. Large Container (40 Feet)
- 9.1.3. High Cube Container
- 9.2. Market Analysis, Insights and Forecast - by Type
- 9.2.1. Dry Storage Container
- 9.2.2. Refrigerated Container
- 9.2.3. Tank Container
- 9.1. Market Analysis, Insights and Forecast - by Size
- 10. Middle East and Africa Global Shipping Container Industry Analysis, Insights and Forecast, 2021-2033
- 10.1. Market Analysis, Insights and Forecast - by Size
- 10.1.1. Small Container (20 Feet)
- 10.1.2. Large Container (40 Feet)
- 10.1.3. High Cube Container
- 10.2. Market Analysis, Insights and Forecast - by Type
- 10.2.1. Dry Storage Container
- 10.2.2. Refrigerated Container
- 10.2.3. Tank Container
- 10.1. Market Analysis, Insights and Forecast - by Size
- 11. Latin America Global Shipping Container Industry Analysis, Insights and Forecast, 2021-2033
- 11.1. Market Analysis, Insights and Forecast - by Size
- 11.1.1. Small Container (20 Feet)
- 11.1.2. Large Container (40 Feet)
- 11.1.3. High Cube Container
- 11.2. Market Analysis, Insights and Forecast - by Type
- 11.2.1. Dry Storage Container
- 11.2.2. Refrigerated Container
- 11.2.3. Tank Container
- 11.1. Market Analysis, Insights and Forecast - by Size
- 12. Competitive Analysis
- 12.1. Company Profiles
- 12.1.1 W&K Container Inc
- 12.1.1.1. Company Overview
- 12.1.1.2. Products
- 12.1.1.3. Company Financials
- 12.1.1.4. SWOT Analysis
- 12.1.2 American Intermodal Container Manufacturing Company (AICM)
- 12.1.2.1. Company Overview
- 12.1.2.2. Products
- 12.1.2.3. Company Financials
- 12.1.2.4. SWOT Analysis
- 12.1.3 CARU Containers BV
- 12.1.3.1. Company Overview
- 12.1.3.2. Products
- 12.1.3.3. Company Financials
- 12.1.3.4. SWOT Analysis
- 12.1.4 Sea Box Inc
- 12.1.4.1. Company Overview
- 12.1.4.2. Products
- 12.1.4.3. Company Financials
- 12.1.4.4. SWOT Analysis
- 12.1.5 Storstac Inc
- 12.1.5.1. Company Overview
- 12.1.5.2. Products
- 12.1.5.3. Company Financials
- 12.1.5.4. SWOT Analysis
- 12.1.6 China International Marine Containers Co Ltd
- 12.1.6.1. Company Overview
- 12.1.6.2. Products
- 12.1.6.3. Company Financials
- 12.1.6.4. SWOT Analysis
- 12.1.7 Singamas Container Holdings Limited
- 12.1.7.1. Company Overview
- 12.1.7.2. Products
- 12.1.7.3. Company Financials
- 12.1.7.4. SWOT Analysis
- 12.1.8 Valisons & Co
- 12.1.8.1. Company Overview
- 12.1.8.2. Products
- 12.1.8.3. Company Financials
- 12.1.8.4. SWOT Analysis
- 12.1.9 CXIC (Changzhou Xinhuachang Int'l Containers) Co Ltd
- 12.1.9.1. Company Overview
- 12.1.9.2. Products
- 12.1.9.3. Company Financials
- 12.1.9.4. SWOT Analysis
- 12.1.10 YMC Container Solutions
- 12.1.10.1. Company Overview
- 12.1.10.2. Products
- 12.1.10.3. Company Financials
- 12.1.10.4. SWOT Analysis
- 12.1.11 Ritveyraaj Cargo Shipping Containers**List Not Exhaustive
- 12.1.11.1. Company Overview
- 12.1.11.2. Products
- 12.1.11.3. Company Financials
- 12.1.11.4. SWOT Analysis
- 12.1.12 Maersk Container Industry AS
- 12.1.12.1. Company Overview
- 12.1.12.2. Products
- 12.1.12.3. Company Financials
- 12.1.12.4. SWOT Analysis
- 12.1.13 TLS Offshore Containers International Pvt Ltd
- 12.1.13.1. Company Overview
- 12.1.13.2. Products
- 12.1.13.3. Company Financials
- 12.1.13.4. SWOT Analysis
- 12.1.14 Dong Fang International Container (Hong Kong) Co Ltd
- 12.1.14.1. Company Overview
- 12.1.14.2. Products
- 12.1.14.3. Company Financials
- 12.1.14.4. SWOT Analysis
- 12.1.15 China Eastern Containers
- 12.1.15.1. Company Overview
- 12.1.15.2. Products
- 12.1.15.3. Company Financials
- 12.1.15.4. SWOT Analysis
- 12.1.1 W&K Container Inc
- 12.2. Market Entropy
- 12.2.1 Company's Key Areas Served
- 12.2.2 Recent Developments
- 12.3. Company Market Share Analysis 2025
- 12.3.1 Top 5 Companies Market Share Analysis
- 12.3.2 Top 3 Companies Market Share Analysis
- 12.4. List of Potential Customers
- 13. Research Methodology
List of Figures
- Figure 1: Global Global Shipping Container Industry Revenue Breakdown (billion, %) by Region 2025 & 2033
- Figure 2: North America Global Shipping Container Industry Revenue (billion), by Size 2025 & 2033
- Figure 3: North America Global Shipping Container Industry Revenue Share (%), by Size 2025 & 2033
- Figure 4: North America Global Shipping Container Industry Revenue (billion), by Type 2025 & 2033
- Figure 5: North America Global Shipping Container Industry Revenue Share (%), by Type 2025 & 2033
- Figure 6: North America Global Shipping Container Industry Revenue (billion), by Country 2025 & 2033
- Figure 7: North America Global Shipping Container Industry Revenue Share (%), by Country 2025 & 2033
- Figure 8: Europe Global Shipping Container Industry Revenue (billion), by Size 2025 & 2033
- Figure 9: Europe Global Shipping Container Industry Revenue Share (%), by Size 2025 & 2033
- Figure 10: Europe Global Shipping Container Industry Revenue (billion), by Type 2025 & 2033
- Figure 11: Europe Global Shipping Container Industry Revenue Share (%), by Type 2025 & 2033
- Figure 12: Europe Global Shipping Container Industry Revenue (billion), by Country 2025 & 2033
- Figure 13: Europe Global Shipping Container Industry Revenue Share (%), by Country 2025 & 2033
- Figure 14: Asia Pacific Global Shipping Container Industry Revenue (billion), by Size 2025 & 2033
- Figure 15: Asia Pacific Global Shipping Container Industry Revenue Share (%), by Size 2025 & 2033
- Figure 16: Asia Pacific Global Shipping Container Industry Revenue (billion), by Type 2025 & 2033
- Figure 17: Asia Pacific Global Shipping Container Industry Revenue Share (%), by Type 2025 & 2033
- Figure 18: Asia Pacific Global Shipping Container Industry Revenue (billion), by Country 2025 & 2033
- Figure 19: Asia Pacific Global Shipping Container Industry Revenue Share (%), by Country 2025 & 2033
- Figure 20: Middle East and Africa Global Shipping Container Industry Revenue (billion), by Size 2025 & 2033
- Figure 21: Middle East and Africa Global Shipping Container Industry Revenue Share (%), by Size 2025 & 2033
- Figure 22: Middle East and Africa Global Shipping Container Industry Revenue (billion), by Type 2025 & 2033
- Figure 23: Middle East and Africa Global Shipping Container Industry Revenue Share (%), by Type 2025 & 2033
- Figure 24: Middle East and Africa Global Shipping Container Industry Revenue (billion), by Country 2025 & 2033
- Figure 25: Middle East and Africa Global Shipping Container Industry Revenue Share (%), by Country 2025 & 2033
- Figure 26: Latin America Global Shipping Container Industry Revenue (billion), by Size 2025 & 2033
- Figure 27: Latin America Global Shipping Container Industry Revenue Share (%), by Size 2025 & 2033
- Figure 28: Latin America Global Shipping Container Industry Revenue (billion), by Type 2025 & 2033
- Figure 29: Latin America Global Shipping Container Industry Revenue Share (%), by Type 2025 & 2033
- Figure 30: Latin America Global Shipping Container Industry Revenue (billion), by Country 2025 & 2033
- Figure 31: Latin America Global Shipping Container Industry Revenue Share (%), by Country 2025 & 2033
List of Tables
- Table 1: Global Shipping Container Industry Revenue billion Forecast, by Size 2020 & 2033
- Table 2: Global Shipping Container Industry Revenue billion Forecast, by Type 2020 & 2033
- Table 3: Global Shipping Container Industry Revenue billion Forecast, by Region 2020 & 2033
- Table 4: Global Shipping Container Industry Revenue billion Forecast, by Size 2020 & 2033
- Table 5: Global Shipping Container Industry Revenue billion Forecast, by Type 2020 & 2033
- Table 6: Global Shipping Container Industry Revenue billion Forecast, by Country 2020 & 2033
- Table 7: United States Global Shipping Container Industry Revenue (billion) Forecast, by Application 2020 & 2033
- Table 8: Canada Global Shipping Container Industry Revenue (billion) Forecast, by Application 2020 & 2033
- Table 9: Global Shipping Container Industry Revenue billion Forecast, by Size 2020 & 2033
- Table 10: Global Shipping Container Industry Revenue billion Forecast, by Type 2020 & 2033
- Table 11: Global Shipping Container Industry Revenue billion Forecast, by Country 2020 & 2033
- Table 12: Germany Global Shipping Container Industry Revenue (billion) Forecast, by Application 2020 & 2033
- Table 13: United Kingdom Global Shipping Container Industry Revenue (billion) Forecast, by Application 2020 & 2033
- Table 14: France Global Shipping Container Industry Revenue (billion) Forecast, by Application 2020 & 2033
- Table 15: Rest of Europe Global Shipping Container Industry Revenue (billion) Forecast, by Application 2020 & 2033
- Table 16: Global Shipping Container Industry Revenue billion Forecast, by Size 2020 & 2033
- Table 17: Global Shipping Container Industry Revenue billion Forecast, by Type 2020 & 2033
- Table 18: Global Shipping Container Industry Revenue billion Forecast, by Country 2020 & 2033
- Table 19: China Global Shipping Container Industry Revenue (billion) Forecast, by Application 2020 & 2033
- Table 20: Japan Global Shipping Container Industry Revenue (billion) Forecast, by Application 2020 & 2033
- Table 21: India Global Shipping Container Industry Revenue (billion) Forecast, by Application 2020 & 2033
- Table 22: Rest of Asia Pacific Global Shipping Container Industry Revenue (billion) Forecast, by Application 2020 & 2033
- Table 23: Global Shipping Container Industry Revenue billion Forecast, by Size 2020 & 2033
- Table 24: Global Shipping Container Industry Revenue billion Forecast, by Type 2020 & 2033
- Table 25: Global Shipping Container Industry Revenue billion Forecast, by Country 2020 & 2033
- Table 26: South Africa Global Shipping Container Industry Revenue (billion) Forecast, by Application 2020 & 2033
- Table 27: United Arab Emirates Global Shipping Container Industry Revenue (billion) Forecast, by Application 2020 & 2033
- Table 28: Saudi Arabia Global Shipping Container Industry Revenue (billion) Forecast, by Application 2020 & 2033
- Table 29: Rest of the Middle East and Africa Global Shipping Container Industry Revenue (billion) Forecast, by Application 2020 & 2033
- Table 30: Global Shipping Container Industry Revenue billion Forecast, by Size 2020 & 2033
- Table 31: Global Shipping Container Industry Revenue billion Forecast, by Type 2020 & 2033
- Table 32: Global Shipping Container Industry Revenue billion Forecast, by Country 2020 & 2033
- Table 33: Mexico Global Shipping Container Industry Revenue (billion) Forecast, by Application 2020 & 2033
- Table 34: Brazil Global Shipping Container Industry Revenue (billion) Forecast, by Application 2020 & 2033
- Table 35: Argentina Global Shipping Container Industry Revenue (billion) Forecast, by Application 2020 & 2033
- Table 36: Rest of the Latin America Global Shipping Container Industry Revenue (billion) Forecast, by Application 2020 & 2033
Frequently Asked Questions
1. What is the projected Compound Annual Growth Rate (CAGR) of the Global Shipping Container Industry?
The projected CAGR is approximately 3.4%.
2. Which companies are prominent players in the Global Shipping Container Industry?
Key companies in the market include W&K Container Inc, American Intermodal Container Manufacturing Company (AICM), CARU Containers BV, Sea Box Inc, Storstac Inc, China International Marine Containers Co Ltd, Singamas Container Holdings Limited, Valisons & Co, CXIC (Changzhou Xinhuachang Int'l Containers) Co Ltd, YMC Container Solutions, Ritveyraaj Cargo Shipping Containers**List Not Exhaustive, Maersk Container Industry AS, TLS Offshore Containers International Pvt Ltd, Dong Fang International Container (Hong Kong) Co Ltd, China Eastern Containers.
3. What are the main segments of the Global Shipping Container Industry?
The market segments include Size, Type.
4. Can you provide details about the market size?
The market size is estimated to be USD 12.32 billion as of 2022.
5. What are some drivers contributing to market growth?
4.; Increasing Consumption of Frozen Food Driving the Market.
6. What are the notable trends driving market growth?
Increase in Demand for Cargo Transportation through Ships Driving the Market.
7. Are there any restraints impacting market growth?
4.; Constantly Increasing Fuel Costs.
8. Can you provide examples of recent developments in the market?
August 2022: Global shipping container suppliers China International Marine Containers and Maersk Container Industry in a joint statement said they have abandoned a merger plan, citing significant regulatory challenges. China International Marine Containers (CIMC) in September 2021 had agreed to buy the Danish shipping company AP Moeller - Maersk refrigerated containers maker for USD 987.3 million. The U.S. Justice Department said the deal would have combined two of the world's four suppliers of refrigerated shipping containers and further concentrated the global cold supply chain.
9. What pricing options are available for accessing the report?
Pricing options include single-user, multi-user, and enterprise licenses priced at USD 4750, USD 5250, and USD 8750 respectively.
10. Is the market size provided in terms of value or volume?
The market size is provided in terms of value, measured in billion.
11. Are there any specific market keywords associated with the report?
Yes, the market keyword associated with the report is "Global Shipping Container Industry," which aids in identifying and referencing the specific market segment covered.
12. How do I determine which pricing option suits my needs best?
The pricing options vary based on user requirements and access needs. Individual users may opt for single-user licenses, while businesses requiring broader access may choose multi-user or enterprise licenses for cost-effective access to the report.
13. Are there any additional resources or data provided in the Global Shipping Container Industry report?
While the report offers comprehensive insights, it's advisable to review the specific contents or supplementary materials provided to ascertain if additional resources or data are available.
14. How can I stay updated on further developments or reports in the Global Shipping Container Industry?
To stay informed about further developments, trends, and reports in the Global Shipping Container Industry, consider subscribing to industry newsletters, following relevant companies and organizations, or regularly checking reputable industry news sources and publications.
Methodology
Step 1 - Identification of Relevant Samples Size from Population Database


Step 2 - Approaches for Defining Global Market Size (Value, Volume* & Price*)

Note*: In applicable scenarios
Step 3 - Data Sources
Primary Research
- Web Analytics
- Survey Reports
- Research Institute
- Latest Research Reports
- Opinion Leaders
Secondary Research
- Annual Reports
- White Paper
- Latest Press Release
- Industry Association
- Paid Database
- Investor Presentations

Step 4 - Data Triangulation
Involves using different sources of information in order to increase the validity of a study
These sources are likely to be stakeholders in a program - participants, other researchers, program staff, other community members, and so on.
Then we put all data in single framework & apply various statistical tools to find out the dynamic on the market.
During the analysis stage, feedback from the stakeholder groups would be compared to determine areas of agreement as well as areas of divergence