

Key Insights
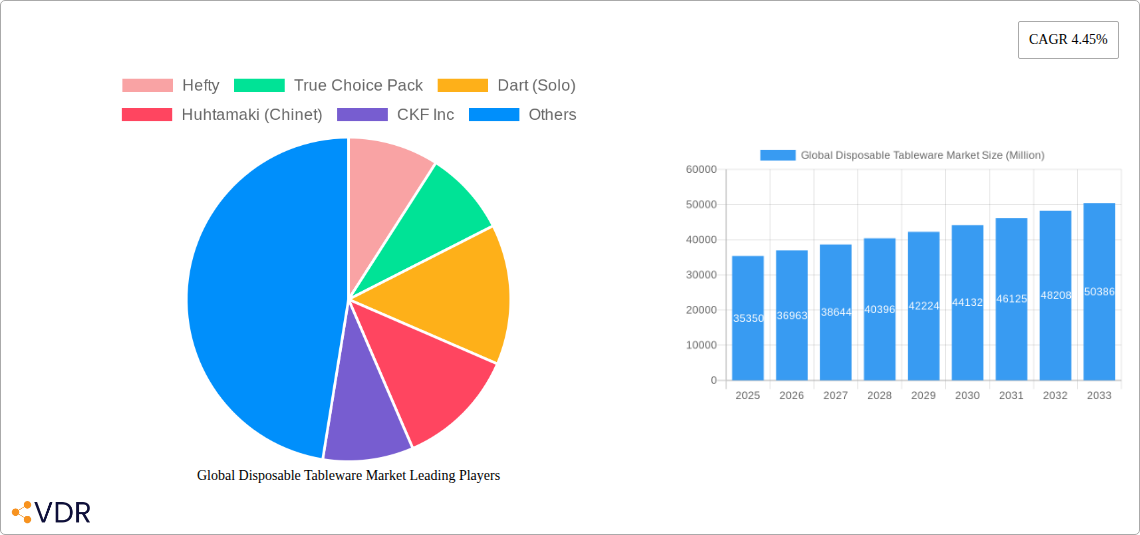
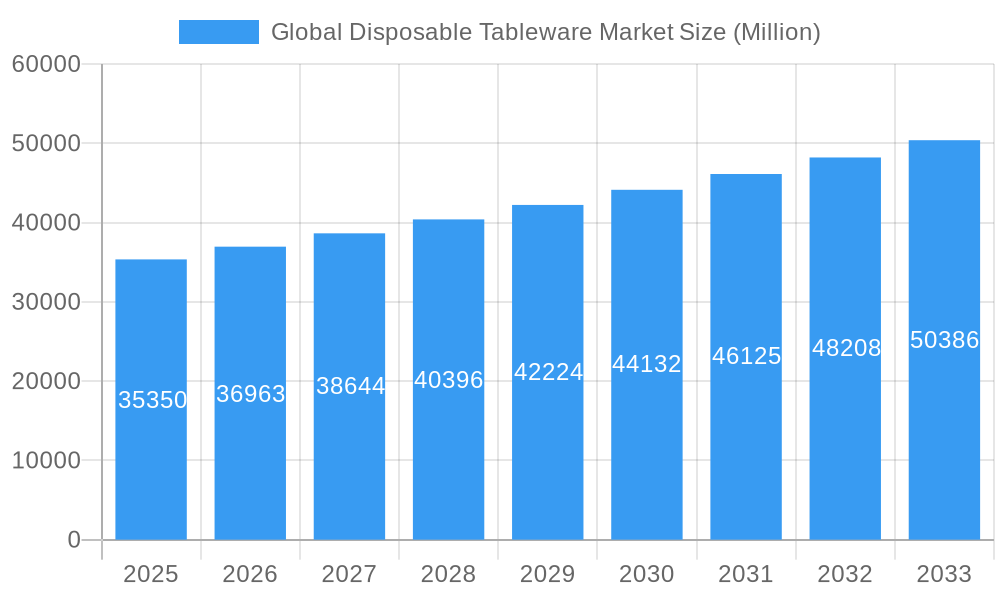
The global disposable tableware market, valued at $35.35 billion in 2025, is projected to experience robust growth, exhibiting a compound annual growth rate (CAGR) of 4.45% from 2025 to 2033. This expansion is fueled by several key drivers. The rising popularity of takeaway and delivery services, particularly within the burgeoning food delivery sector, significantly boosts demand for convenient and hygienic disposable tableware. Furthermore, increasing urbanization and a fast-paced lifestyle contribute to the preference for single-use products, reducing time spent on cleaning and washing. The convenience factor is particularly appealing to busy individuals and families. Growth is also influenced by the expanding tourism and hospitality industries, which rely heavily on disposable tableware for hygiene and efficiency. However, environmental concerns surrounding the disposal of plastic tableware and increasing regulations regarding plastic waste pose significant challenges. This is leading to a rise in demand for eco-friendly alternatives such as biodegradable and compostable options, creating a significant opportunity for manufacturers to innovate and cater to environmentally conscious consumers. Market segmentation reveals strong performance across various product types (disposable cups, plates, bowls, and silverware), application segments (residential and commercial), and distribution channels (hypermarkets, convenience stores, and online retailers). North America currently holds a substantial market share, but the Asia-Pacific region is expected to witness rapid growth driven by rising disposable incomes and changing consumer habits.
Global Disposable Tableware Market Market Size (In Billion)
Competitive dynamics within the market are characterized by the presence of both established multinational corporations like Huhtamaki and Dart (Solo), and smaller regional players. Companies are focusing on product diversification, expanding their product portfolios to include eco-friendly options and catering to the growing demand for sustainable solutions. Strategic partnerships, mergers, and acquisitions are expected to shape the market landscape in the coming years. The ongoing innovation in materials and manufacturing processes, coupled with the focus on sustainability, is expected to further drive market expansion and transform the industry towards more environmentally responsible practices. The market's future growth will depend heavily on the balance between the convenience offered by disposable tableware and the growing awareness of its environmental impact, necessitating innovative and sustainable solutions.
Global Disposable Tableware Market Company Market Share
Global Disposable Tableware Market Report: 2019-2033
This comprehensive report provides a detailed analysis of the global disposable tableware market, covering the period 2019-2033. It offers invaluable insights into market dynamics, growth trends, key players, and emerging opportunities for businesses operating within this dynamic sector. The report segments the market by product type (disposable cups, plates, bowls, silverware, and others), application (residential and commercial), distribution channel (hypermarkets, convenience stores, online, and others), and region (North America, Europe, Asia-Pacific, South America, and Middle East & Africa). This granular analysis allows for a precise understanding of the market's complexities and presents strategic opportunities for growth. The market size is valued at xx Million units in 2025 and is projected to experience significant growth during the forecast period (2025-2033).
Global Disposable Tableware Market Dynamics & Structure
The global disposable tableware market is characterized by moderate concentration, with key players such as Hefty, True Choice Pack, Dart (Solo), Huhtamaki (Chinet), CKF Inc, Natural Tableware, Letica, Dixie, Solia, Lollicup USA, and International Paper holding significant market share. However, the presence of numerous smaller regional players contributes to a competitive landscape. Technological innovation, primarily focused on sustainability and eco-friendly materials (e.g., biodegradable and compostable options), is a major driver. Stringent regulatory frameworks concerning plastic waste are impacting material choices and packaging designs. The market also faces competition from reusable tableware, particularly in the commercial sector.
- Market Concentration: Moderately concentrated, with a few dominant players and numerous smaller competitors. Market share data for 2025 is as follows: Hefty (xx%), Huhtamaki (xx%), Dart (Solo) (xx%), others (xx%).
- Technological Innovation: Focus on biodegradable and compostable materials, improved designs for functionality and aesthetics, and advanced manufacturing processes.
- Regulatory Framework: Growing pressure to reduce plastic waste is driving demand for sustainable alternatives and influencing product development.
- Competitive Substitutes: Reusable tableware poses a significant competitive threat, particularly in the commercial segment.
- End-User Demographics: Growing urbanization and changing lifestyles are contributing to increased demand, particularly in developing economies.
- M&A Trends: A moderate level of M&A activity is observed, with larger companies acquiring smaller players to expand their product portfolios and market reach. xx M&A deals were recorded in the period 2019-2024.
Global Disposable Tableware Market Growth Trends & Insights
The global disposable tableware market is experiencing steady growth, driven by factors such as rising disposable incomes, increasing urbanization, and the convenience associated with disposable products. The market witnessed a CAGR of xx% during the historical period (2019-2024), and is projected to maintain a CAGR of xx% during the forecast period (2025-2033). This growth is influenced by changing consumer preferences, technological advancements in material science, and increasing demand from the food service industry. The market penetration of eco-friendly disposable tableware is gradually increasing, reflecting growing environmental awareness. The adoption rate of sustainable options is expected to accelerate due to regulatory pressures and consumer demand.
Dominant Regions, Countries, or Segments in Global Disposable Tableware Market
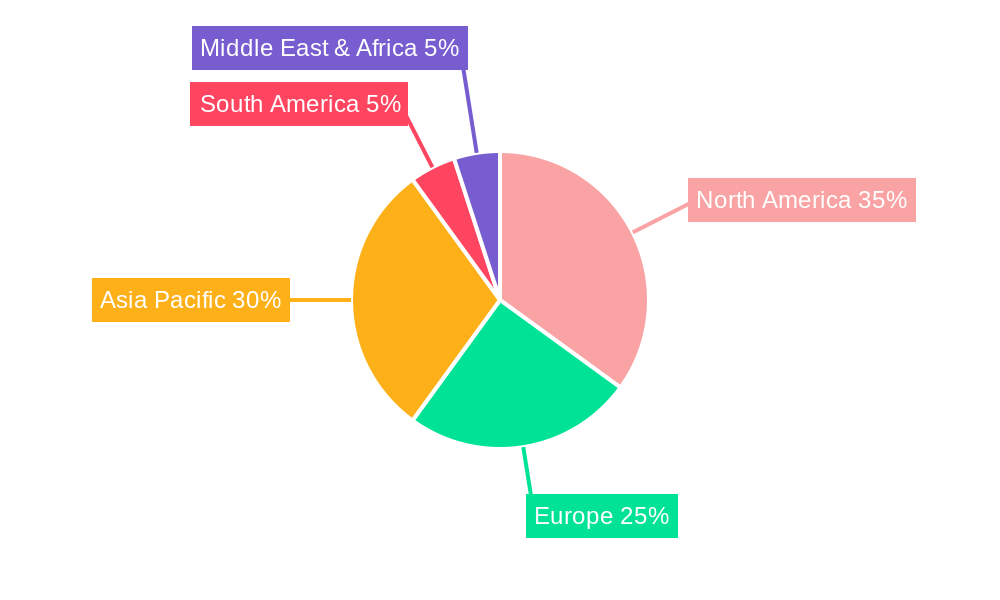
North America currently leads the global disposable tableware market, fueled by high disposable incomes, a robust food service industry, and well-established retail infrastructure. Following closely is the Asia-Pacific region, which is experiencing rapid growth due to accelerating urbanization, a burgeoning population, and an expanding food service sector. Within product segments, disposable plates and cups remain dominant, owing to their ubiquitous use in both household and commercial settings. The commercial sector, encompassing a wide array of food service establishments like restaurants, cafes, and catering services, presents a more significant growth trajectory compared to the residential sector, primarily attributed to higher consumption volumes. Hypermarkets and supermarkets continue to be the primary distribution channels, leveraging their economies of scale and providing consumers with unparalleled convenience and accessibility.
- North America: Dominance is sustained by high consumer spending power, a thriving food service industry, and a sophisticated retail network.
- Asia-Pacific: This region is a key growth engine, propelled by rapid urbanization, a continuously expanding population, and the burgeoning food service industry.
- Europe: This mature market is increasingly characterized by a strong demand for sustainable and eco-friendly disposable tableware solutions, significantly influenced by stringent environmental regulations.
- Product Type: Disposable plates and cups continue to capture the largest market share, reflecting their widespread and consistent demand across both residential and commercial applications.
- Application: The commercial sector demonstrates a higher growth potential, driven by the sustained high consumption rates inherent in the dynamic food service industry.
- Distribution Channel: Hypermarkets and supermarkets maintain their leading position as the preferred distribution channels for disposable tableware.
Global Disposable Tableware Market Product Landscape
The disposable tableware market showcases diverse product offerings, ranging from basic paper plates and cups to more sophisticated designs made from advanced materials. Innovation focuses on enhancing aesthetics, functionality, and sustainability. Key features include improved durability, leak-proof designs for cups, and the incorporation of eco-friendly materials such as bagasse, bamboo, and PLA. Unique selling propositions include microwave-safe designs, elegant patterns and colors, and superior strength to accommodate diverse food types.
Key Drivers, Barriers & Challenges in Global Disposable Tableware Market
Key Drivers: Rising disposable incomes, increasing urbanization, growth of the food service industry, and convenience are primary drivers. Government initiatives promoting sustainable packaging are also accelerating the adoption of eco-friendly alternatives.
Key Challenges: Fluctuations in raw material prices, environmental concerns regarding plastic waste, competition from reusable tableware, and stringent regulations regarding packaging materials pose significant challenges. The impact on profitability is estimated at xx% in the short term.
Emerging Opportunities in Global Disposable Tableware Market
The disposable tableware market is ripe with emerging opportunities, particularly in the development, marketing, and widespread adoption of sustainable and biodegradable alternatives. Untapped markets in developing economies present substantial growth potential, offering new avenues for market penetration and expansion. Innovation in material science and product design is a critical driver, enabling the creation of more functional, aesthetically appealing, and environmentally responsible disposable tableware. Furthermore, the increasing demand for customization and personalized branding options is opening new avenues for manufacturers to cater to specific client needs and enhance brand recognition.
Growth Accelerators in the Global Disposable Tableware Market Industry
Technological advancements in material science and manufacturing processes are pivotal growth accelerators for the disposable tableware industry. These innovations are leading to the development of novel, high-performance, and more sustainable materials. Strategic partnerships and collaborations across the entire value chain, from raw material suppliers to end-users, are instrumental in enhancing operational efficiency, optimizing supply chains, and expanding market reach. Furthermore, strategic expansion into emerging markets, coupled with a keen focus on catering to the escalating demand for eco-friendly disposable tableware, will continue to be significant drivers of market growth.
Key Players Shaping the Global Disposable Tableware Market Market
- Hefty
- True Choice Pack
- Dart (Solo)
- Huhtamaki (Chinet)
- CKF Inc
- Natural Tableware
- Letica
- Dixie
- Solia
- Lollicup USA
- International Paper
Notable Milestones in Global Disposable Tableware Market Sector
- August 2023: Hefty relaunches its popular Hefty Zoo Pals plates, boosting appeal among families.
- February 2022: Huhtamaki collaborates with Carte D'OR, switching to recyclable paper ice cream packaging, reducing plastic waste.
In-Depth Global Disposable Tableware Market Market Outlook
The outlook for the global disposable tableware market is exceptionally promising, bolstered by a confluence of factors. Ongoing technological breakthroughs in material science and manufacturing are continuously enhancing product quality and sustainability. Shifting consumer preferences towards more environmentally conscious options are creating a significant demand for eco-friendly disposable tableware. The strategic expansion into new and emerging markets further contributes to market growth. The confluence of strategic partnerships, innovative material solutions, and evolving consumer demands is poised to unlock substantial opportunities for enhanced growth and profitability, paving the way for significant market expansion in the foreseeable future.
Global Disposable Tableware Market Segmentation
-
1. Product Type
- 1.1. Disposable Cups
- 1.2. Disposable Plates
- 1.3. Disposable Bowls
- 1.4. Disposable Silverware
- 1.5. Other Product Types
-
2. Application
- 2.1. Residential
- 2.2. Commercial
-
3. Distribution Channel
- 3.1. Hypermarkets and Supermarkets
- 3.2. Convenience Stores
- 3.3. Online
- 3.4. Other Distribution Channels
Global Disposable Tableware Market Segmentation By Geography
-
1. North America
- 1.1. United States
- 1.2. Canada
- 1.3. Mexico
-
2. South America
- 2.1. Brazil
- 2.2. Argentina
- 2.3. Rest of South America
-
3. Europe
- 3.1. United Kingdom
- 3.2. Germany
- 3.3. France
- 3.4. Italy
- 3.5. Spain
- 3.6. Russia
- 3.7. Benelux
- 3.8. Nordics
- 3.9. Rest of Europe
-
4. Middle East & Africa
- 4.1. Turkey
- 4.2. Israel
- 4.3. GCC
- 4.4. North Africa
- 4.5. South Africa
- 4.6. Rest of Middle East & Africa
-
5. Asia Pacific
- 5.1. China
- 5.2. India
- 5.3. Japan
- 5.4. South Korea
- 5.5. ASEAN
- 5.6. Oceania
- 5.7. Rest of Asia Pacific
Global Disposable Tableware Market Regional Market Share
Geographic Coverage of Global Disposable Tableware Market
Global Disposable Tableware Market REPORT HIGHLIGHTS
| Aspects | Details |
|---|---|
| Study Period | 2020-2034 |
| Base Year | 2025 |
| Estimated Year | 2026 |
| Forecast Period | 2026-2034 |
| Historical Period | 2020-2025 |
| Growth Rate | CAGR of 4.45% from 2020-2034 |
| Segmentation |
|
Table of Contents
- 1. Introduction
- 1.1. Research Scope
- 1.2. Market Segmentation
- 1.3. Research Objective
- 1.4. Definitions and Assumptions
- 2. Executive Summary
- 2.1. Market Snapshot
- 3. Market Dynamics
- 3.1. Market Drivers
- 3.2. Market Restrains
- 3.3. Market Trends
- 3.4. Market Opportunities
- 4. Market Factor Analysis
- 4.1. Porters Five Forces
- 4.1.1. Bargaining Power of Suppliers
- 4.1.2. Bargaining Power of Buyers
- 4.1.3. Threat of New Entrants
- 4.1.4. Threat of Substitutes
- 4.1.5. Competitive Rivalry
- 4.2. PESTEL analysis
- 4.3. BCG Analysis
- 4.3.1. Stars (High Growth, High Market Share)
- 4.3.2. Cash Cows (Low Growth, High Market Share)
- 4.3.3. Question Mark (High Growth, Low Market Share)
- 4.3.4. Dogs (Low Growth, Low Market Share)
- 4.4. Ansoff Matrix Analysis
- 4.5. Supply Chain Analysis
- 4.6. Regulatory Landscape
- 4.7. Current Market Potential and Opportunity Assessment (TAM–SAM–SOM Framework)
- 4.8. VDR Analyst Note
- 4.1. Porters Five Forces
- 5. Market Analysis, Insights and Forecast 2021-2033
- 5.1. Market Analysis, Insights and Forecast - by Product Type
- 5.1.1. Disposable Cups
- 5.1.2. Disposable Plates
- 5.1.3. Disposable Bowls
- 5.1.4. Disposable Silverware
- 5.1.5. Other Product Types
- 5.2. Market Analysis, Insights and Forecast - by Application
- 5.2.1. Residential
- 5.2.2. Commercial
- 5.3. Market Analysis, Insights and Forecast - by Distribution Channel
- 5.3.1. Hypermarkets and Supermarkets
- 5.3.2. Convenience Stores
- 5.3.3. Online
- 5.3.4. Other Distribution Channels
- 5.4. Market Analysis, Insights and Forecast - by Region
- 5.4.1. North America
- 5.4.2. South America
- 5.4.3. Europe
- 5.4.4. Middle East & Africa
- 5.4.5. Asia Pacific
- 5.1. Market Analysis, Insights and Forecast - by Product Type
- 6. Global Disposable Tableware Market Analysis, Insights and Forecast, 2021-2033
- 6.1. Market Analysis, Insights and Forecast - by Product Type
- 6.1.1. Disposable Cups
- 6.1.2. Disposable Plates
- 6.1.3. Disposable Bowls
- 6.1.4. Disposable Silverware
- 6.1.5. Other Product Types
- 6.2. Market Analysis, Insights and Forecast - by Application
- 6.2.1. Residential
- 6.2.2. Commercial
- 6.3. Market Analysis, Insights and Forecast - by Distribution Channel
- 6.3.1. Hypermarkets and Supermarkets
- 6.3.2. Convenience Stores
- 6.3.3. Online
- 6.3.4. Other Distribution Channels
- 6.1. Market Analysis, Insights and Forecast - by Product Type
- 7. North America Global Disposable Tableware Market Analysis, Insights and Forecast, 2021-2033
- 7.1. Market Analysis, Insights and Forecast - by Product Type
- 7.1.1. Disposable Cups
- 7.1.2. Disposable Plates
- 7.1.3. Disposable Bowls
- 7.1.4. Disposable Silverware
- 7.1.5. Other Product Types
- 7.2. Market Analysis, Insights and Forecast - by Application
- 7.2.1. Residential
- 7.2.2. Commercial
- 7.3. Market Analysis, Insights and Forecast - by Distribution Channel
- 7.3.1. Hypermarkets and Supermarkets
- 7.3.2. Convenience Stores
- 7.3.3. Online
- 7.3.4. Other Distribution Channels
- 7.1. Market Analysis, Insights and Forecast - by Product Type
- 8. South America Global Disposable Tableware Market Analysis, Insights and Forecast, 2021-2033
- 8.1. Market Analysis, Insights and Forecast - by Product Type
- 8.1.1. Disposable Cups
- 8.1.2. Disposable Plates
- 8.1.3. Disposable Bowls
- 8.1.4. Disposable Silverware
- 8.1.5. Other Product Types
- 8.2. Market Analysis, Insights and Forecast - by Application
- 8.2.1. Residential
- 8.2.2. Commercial
- 8.3. Market Analysis, Insights and Forecast - by Distribution Channel
- 8.3.1. Hypermarkets and Supermarkets
- 8.3.2. Convenience Stores
- 8.3.3. Online
- 8.3.4. Other Distribution Channels
- 8.1. Market Analysis, Insights and Forecast - by Product Type
- 9. Europe Global Disposable Tableware Market Analysis, Insights and Forecast, 2021-2033
- 9.1. Market Analysis, Insights and Forecast - by Product Type
- 9.1.1. Disposable Cups
- 9.1.2. Disposable Plates
- 9.1.3. Disposable Bowls
- 9.1.4. Disposable Silverware
- 9.1.5. Other Product Types
- 9.2. Market Analysis, Insights and Forecast - by Application
- 9.2.1. Residential
- 9.2.2. Commercial
- 9.3. Market Analysis, Insights and Forecast - by Distribution Channel
- 9.3.1. Hypermarkets and Supermarkets
- 9.3.2. Convenience Stores
- 9.3.3. Online
- 9.3.4. Other Distribution Channels
- 9.1. Market Analysis, Insights and Forecast - by Product Type
- 10. Middle East & Africa Global Disposable Tableware Market Analysis, Insights and Forecast, 2021-2033
- 10.1. Market Analysis, Insights and Forecast - by Product Type
- 10.1.1. Disposable Cups
- 10.1.2. Disposable Plates
- 10.1.3. Disposable Bowls
- 10.1.4. Disposable Silverware
- 10.1.5. Other Product Types
- 10.2. Market Analysis, Insights and Forecast - by Application
- 10.2.1. Residential
- 10.2.2. Commercial
- 10.3. Market Analysis, Insights and Forecast - by Distribution Channel
- 10.3.1. Hypermarkets and Supermarkets
- 10.3.2. Convenience Stores
- 10.3.3. Online
- 10.3.4. Other Distribution Channels
- 10.1. Market Analysis, Insights and Forecast - by Product Type
- 11. Asia Pacific Global Disposable Tableware Market Analysis, Insights and Forecast, 2021-2033
- 11.1. Market Analysis, Insights and Forecast - by Product Type
- 11.1.1. Disposable Cups
- 11.1.2. Disposable Plates
- 11.1.3. Disposable Bowls
- 11.1.4. Disposable Silverware
- 11.1.5. Other Product Types
- 11.2. Market Analysis, Insights and Forecast - by Application
- 11.2.1. Residential
- 11.2.2. Commercial
- 11.3. Market Analysis, Insights and Forecast - by Distribution Channel
- 11.3.1. Hypermarkets and Supermarkets
- 11.3.2. Convenience Stores
- 11.3.3. Online
- 11.3.4. Other Distribution Channels
- 11.1. Market Analysis, Insights and Forecast - by Product Type
- 12. Competitive Analysis
- 12.1. Company Profiles
- 12.1.1 Hefty
- 12.1.1.1. Company Overview
- 12.1.1.2. Products
- 12.1.1.3. Company Financials
- 12.1.1.4. SWOT Analysis
- 12.1.2 True Choice Pack
- 12.1.2.1. Company Overview
- 12.1.2.2. Products
- 12.1.2.3. Company Financials
- 12.1.2.4. SWOT Analysis
- 12.1.3 Dart (Solo)
- 12.1.3.1. Company Overview
- 12.1.3.2. Products
- 12.1.3.3. Company Financials
- 12.1.3.4. SWOT Analysis
- 12.1.4 Huhtamaki (Chinet)
- 12.1.4.1. Company Overview
- 12.1.4.2. Products
- 12.1.4.3. Company Financials
- 12.1.4.4. SWOT Analysis
- 12.1.5 CKF Inc
- 12.1.5.1. Company Overview
- 12.1.5.2. Products
- 12.1.5.3. Company Financials
- 12.1.5.4. SWOT Analysis
- 12.1.6 Natural Tableware
- 12.1.6.1. Company Overview
- 12.1.6.2. Products
- 12.1.6.3. Company Financials
- 12.1.6.4. SWOT Analysis
- 12.1.7 Letica**List Not Exhaustive
- 12.1.7.1. Company Overview
- 12.1.7.2. Products
- 12.1.7.3. Company Financials
- 12.1.7.4. SWOT Analysis
- 12.1.8 Dixie
- 12.1.8.1. Company Overview
- 12.1.8.2. Products
- 12.1.8.3. Company Financials
- 12.1.8.4. SWOT Analysis
- 12.1.9 Solia
- 12.1.9.1. Company Overview
- 12.1.9.2. Products
- 12.1.9.3. Company Financials
- 12.1.9.4. SWOT Analysis
- 12.1.10 Lollicup USA
- 12.1.10.1. Company Overview
- 12.1.10.2. Products
- 12.1.10.3. Company Financials
- 12.1.10.4. SWOT Analysis
- 12.1.11 International Paper
- 12.1.11.1. Company Overview
- 12.1.11.2. Products
- 12.1.11.3. Company Financials
- 12.1.11.4. SWOT Analysis
- 12.1.1 Hefty
- 12.2. Market Entropy
- 12.2.1 Company's Key Areas Served
- 12.2.2 Recent Developments
- 12.3. Company Market Share Analysis 2025
- 12.3.1 Top 5 Companies Market Share Analysis
- 12.3.2 Top 3 Companies Market Share Analysis
- 12.4. List of Potential Customers
- 13. Research Methodology
List of Figures
- Figure 1: Global Global Disposable Tableware Market Revenue Breakdown (Million, %) by Region 2025 & 2033
- Figure 2: North America Global Disposable Tableware Market Revenue (Million), by Product Type 2025 & 2033
- Figure 3: North America Global Disposable Tableware Market Revenue Share (%), by Product Type 2025 & 2033
- Figure 4: North America Global Disposable Tableware Market Revenue (Million), by Application 2025 & 2033
- Figure 5: North America Global Disposable Tableware Market Revenue Share (%), by Application 2025 & 2033
- Figure 6: North America Global Disposable Tableware Market Revenue (Million), by Distribution Channel 2025 & 2033
- Figure 7: North America Global Disposable Tableware Market Revenue Share (%), by Distribution Channel 2025 & 2033
- Figure 8: North America Global Disposable Tableware Market Revenue (Million), by Country 2025 & 2033
- Figure 9: North America Global Disposable Tableware Market Revenue Share (%), by Country 2025 & 2033
- Figure 10: South America Global Disposable Tableware Market Revenue (Million), by Product Type 2025 & 2033
- Figure 11: South America Global Disposable Tableware Market Revenue Share (%), by Product Type 2025 & 2033
- Figure 12: South America Global Disposable Tableware Market Revenue (Million), by Application 2025 & 2033
- Figure 13: South America Global Disposable Tableware Market Revenue Share (%), by Application 2025 & 2033
- Figure 14: South America Global Disposable Tableware Market Revenue (Million), by Distribution Channel 2025 & 2033
- Figure 15: South America Global Disposable Tableware Market Revenue Share (%), by Distribution Channel 2025 & 2033
- Figure 16: South America Global Disposable Tableware Market Revenue (Million), by Country 2025 & 2033
- Figure 17: South America Global Disposable Tableware Market Revenue Share (%), by Country 2025 & 2033
- Figure 18: Europe Global Disposable Tableware Market Revenue (Million), by Product Type 2025 & 2033
- Figure 19: Europe Global Disposable Tableware Market Revenue Share (%), by Product Type 2025 & 2033
- Figure 20: Europe Global Disposable Tableware Market Revenue (Million), by Application 2025 & 2033
- Figure 21: Europe Global Disposable Tableware Market Revenue Share (%), by Application 2025 & 2033
- Figure 22: Europe Global Disposable Tableware Market Revenue (Million), by Distribution Channel 2025 & 2033
- Figure 23: Europe Global Disposable Tableware Market Revenue Share (%), by Distribution Channel 2025 & 2033
- Figure 24: Europe Global Disposable Tableware Market Revenue (Million), by Country 2025 & 2033
- Figure 25: Europe Global Disposable Tableware Market Revenue Share (%), by Country 2025 & 2033
- Figure 26: Middle East & Africa Global Disposable Tableware Market Revenue (Million), by Product Type 2025 & 2033
- Figure 27: Middle East & Africa Global Disposable Tableware Market Revenue Share (%), by Product Type 2025 & 2033
- Figure 28: Middle East & Africa Global Disposable Tableware Market Revenue (Million), by Application 2025 & 2033
- Figure 29: Middle East & Africa Global Disposable Tableware Market Revenue Share (%), by Application 2025 & 2033
- Figure 30: Middle East & Africa Global Disposable Tableware Market Revenue (Million), by Distribution Channel 2025 & 2033
- Figure 31: Middle East & Africa Global Disposable Tableware Market Revenue Share (%), by Distribution Channel 2025 & 2033
- Figure 32: Middle East & Africa Global Disposable Tableware Market Revenue (Million), by Country 2025 & 2033
- Figure 33: Middle East & Africa Global Disposable Tableware Market Revenue Share (%), by Country 2025 & 2033
- Figure 34: Asia Pacific Global Disposable Tableware Market Revenue (Million), by Product Type 2025 & 2033
- Figure 35: Asia Pacific Global Disposable Tableware Market Revenue Share (%), by Product Type 2025 & 2033
- Figure 36: Asia Pacific Global Disposable Tableware Market Revenue (Million), by Application 2025 & 2033
- Figure 37: Asia Pacific Global Disposable Tableware Market Revenue Share (%), by Application 2025 & 2033
- Figure 38: Asia Pacific Global Disposable Tableware Market Revenue (Million), by Distribution Channel 2025 & 2033
- Figure 39: Asia Pacific Global Disposable Tableware Market Revenue Share (%), by Distribution Channel 2025 & 2033
- Figure 40: Asia Pacific Global Disposable Tableware Market Revenue (Million), by Country 2025 & 2033
- Figure 41: Asia Pacific Global Disposable Tableware Market Revenue Share (%), by Country 2025 & 2033
List of Tables
- Table 1: Global Disposable Tableware Market Revenue Million Forecast, by Product Type 2020 & 2033
- Table 2: Global Disposable Tableware Market Revenue Million Forecast, by Application 2020 & 2033
- Table 3: Global Disposable Tableware Market Revenue Million Forecast, by Distribution Channel 2020 & 2033
- Table 4: Global Disposable Tableware Market Revenue Million Forecast, by Region 2020 & 2033
- Table 5: Global Disposable Tableware Market Revenue Million Forecast, by Product Type 2020 & 2033
- Table 6: Global Disposable Tableware Market Revenue Million Forecast, by Application 2020 & 2033
- Table 7: Global Disposable Tableware Market Revenue Million Forecast, by Distribution Channel 2020 & 2033
- Table 8: Global Disposable Tableware Market Revenue Million Forecast, by Country 2020 & 2033
- Table 9: United States Global Disposable Tableware Market Revenue (Million) Forecast, by Application 2020 & 2033
- Table 10: Canada Global Disposable Tableware Market Revenue (Million) Forecast, by Application 2020 & 2033
- Table 11: Mexico Global Disposable Tableware Market Revenue (Million) Forecast, by Application 2020 & 2033
- Table 12: Global Disposable Tableware Market Revenue Million Forecast, by Product Type 2020 & 2033
- Table 13: Global Disposable Tableware Market Revenue Million Forecast, by Application 2020 & 2033
- Table 14: Global Disposable Tableware Market Revenue Million Forecast, by Distribution Channel 2020 & 2033
- Table 15: Global Disposable Tableware Market Revenue Million Forecast, by Country 2020 & 2033
- Table 16: Brazil Global Disposable Tableware Market Revenue (Million) Forecast, by Application 2020 & 2033
- Table 17: Argentina Global Disposable Tableware Market Revenue (Million) Forecast, by Application 2020 & 2033
- Table 18: Rest of South America Global Disposable Tableware Market Revenue (Million) Forecast, by Application 2020 & 2033
- Table 19: Global Disposable Tableware Market Revenue Million Forecast, by Product Type 2020 & 2033
- Table 20: Global Disposable Tableware Market Revenue Million Forecast, by Application 2020 & 2033
- Table 21: Global Disposable Tableware Market Revenue Million Forecast, by Distribution Channel 2020 & 2033
- Table 22: Global Disposable Tableware Market Revenue Million Forecast, by Country 2020 & 2033
- Table 23: United Kingdom Global Disposable Tableware Market Revenue (Million) Forecast, by Application 2020 & 2033
- Table 24: Germany Global Disposable Tableware Market Revenue (Million) Forecast, by Application 2020 & 2033
- Table 25: France Global Disposable Tableware Market Revenue (Million) Forecast, by Application 2020 & 2033
- Table 26: Italy Global Disposable Tableware Market Revenue (Million) Forecast, by Application 2020 & 2033
- Table 27: Spain Global Disposable Tableware Market Revenue (Million) Forecast, by Application 2020 & 2033
- Table 28: Russia Global Disposable Tableware Market Revenue (Million) Forecast, by Application 2020 & 2033
- Table 29: Benelux Global Disposable Tableware Market Revenue (Million) Forecast, by Application 2020 & 2033
- Table 30: Nordics Global Disposable Tableware Market Revenue (Million) Forecast, by Application 2020 & 2033
- Table 31: Rest of Europe Global Disposable Tableware Market Revenue (Million) Forecast, by Application 2020 & 2033
- Table 32: Global Disposable Tableware Market Revenue Million Forecast, by Product Type 2020 & 2033
- Table 33: Global Disposable Tableware Market Revenue Million Forecast, by Application 2020 & 2033
- Table 34: Global Disposable Tableware Market Revenue Million Forecast, by Distribution Channel 2020 & 2033
- Table 35: Global Disposable Tableware Market Revenue Million Forecast, by Country 2020 & 2033
- Table 36: Turkey Global Disposable Tableware Market Revenue (Million) Forecast, by Application 2020 & 2033
- Table 37: Israel Global Disposable Tableware Market Revenue (Million) Forecast, by Application 2020 & 2033
- Table 38: GCC Global Disposable Tableware Market Revenue (Million) Forecast, by Application 2020 & 2033
- Table 39: North Africa Global Disposable Tableware Market Revenue (Million) Forecast, by Application 2020 & 2033
- Table 40: South Africa Global Disposable Tableware Market Revenue (Million) Forecast, by Application 2020 & 2033
- Table 41: Rest of Middle East & Africa Global Disposable Tableware Market Revenue (Million) Forecast, by Application 2020 & 2033
- Table 42: Global Disposable Tableware Market Revenue Million Forecast, by Product Type 2020 & 2033
- Table 43: Global Disposable Tableware Market Revenue Million Forecast, by Application 2020 & 2033
- Table 44: Global Disposable Tableware Market Revenue Million Forecast, by Distribution Channel 2020 & 2033
- Table 45: Global Disposable Tableware Market Revenue Million Forecast, by Country 2020 & 2033
- Table 46: China Global Disposable Tableware Market Revenue (Million) Forecast, by Application 2020 & 2033
- Table 47: India Global Disposable Tableware Market Revenue (Million) Forecast, by Application 2020 & 2033
- Table 48: Japan Global Disposable Tableware Market Revenue (Million) Forecast, by Application 2020 & 2033
- Table 49: South Korea Global Disposable Tableware Market Revenue (Million) Forecast, by Application 2020 & 2033
- Table 50: ASEAN Global Disposable Tableware Market Revenue (Million) Forecast, by Application 2020 & 2033
- Table 51: Oceania Global Disposable Tableware Market Revenue (Million) Forecast, by Application 2020 & 2033
- Table 52: Rest of Asia Pacific Global Disposable Tableware Market Revenue (Million) Forecast, by Application 2020 & 2033
Frequently Asked Questions
1. What is the projected Compound Annual Growth Rate (CAGR) of the Global Disposable Tableware Market?
The projected CAGR is approximately 4.45%.
2. Which companies are prominent players in the Global Disposable Tableware Market?
Key companies in the market include Hefty, True Choice Pack, Dart (Solo), Huhtamaki (Chinet), CKF Inc, Natural Tableware, Letica**List Not Exhaustive, Dixie, Solia, Lollicup USA, International Paper.
3. What are the main segments of the Global Disposable Tableware Market?
The market segments include Product Type, Application, Distribution Channel.
4. Can you provide details about the market size?
The market size is estimated to be USD 35.35 Million as of 2022.
5. What are some drivers contributing to market growth?
Rise of Affrodable Disposable Tableware; Growing Urbanisation is Driving Need for Easy to Use Tableware.
6. What are the notable trends driving market growth?
Increasing Popularity of Online Retailing for Disposable Tableware.
7. Are there any restraints impacting market growth?
Changing Needs and Taste of Customers; Limited Usage of the Product.
8. Can you provide examples of recent developments in the market?
In August 2023, the Hefty brand brought back Hefty Zoo Pals plates. Zoo Pals plates are colorful paper plates featuring original, loveable animal "Pals" like Curly the Pig, Domino the Dalmatian, and more. This makes the product line popular amongst the kids and parents.
9. What pricing options are available for accessing the report?
Pricing options include single-user, multi-user, and enterprise licenses priced at USD 4750, USD 5250, and USD 8750 respectively.
10. Is the market size provided in terms of value or volume?
The market size is provided in terms of value, measured in Million.
11. Are there any specific market keywords associated with the report?
Yes, the market keyword associated with the report is "Global Disposable Tableware Market," which aids in identifying and referencing the specific market segment covered.
12. How do I determine which pricing option suits my needs best?
The pricing options vary based on user requirements and access needs. Individual users may opt for single-user licenses, while businesses requiring broader access may choose multi-user or enterprise licenses for cost-effective access to the report.
13. Are there any additional resources or data provided in the Global Disposable Tableware Market report?
While the report offers comprehensive insights, it's advisable to review the specific contents or supplementary materials provided to ascertain if additional resources or data are available.
14. How can I stay updated on further developments or reports in the Global Disposable Tableware Market?
To stay informed about further developments, trends, and reports in the Global Disposable Tableware Market, consider subscribing to industry newsletters, following relevant companies and organizations, or regularly checking reputable industry news sources and publications.
Methodology
Step 1 - Identification of Relevant Samples Size from Population Database


Step 2 - Approaches for Defining Global Market Size (Value, Volume* & Price*)

Note*: In applicable scenarios
Step 3 - Data Sources
Primary Research
- Web Analytics
- Survey Reports
- Research Institute
- Latest Research Reports
- Opinion Leaders
Secondary Research
- Annual Reports
- White Paper
- Latest Press Release
- Industry Association
- Paid Database
- Investor Presentations

Step 4 - Data Triangulation
Involves using different sources of information in order to increase the validity of a study
These sources are likely to be stakeholders in a program - participants, other researchers, program staff, other community members, and so on.
Then we put all data in single framework & apply various statistical tools to find out the dynamic on the market.
During the analysis stage, feedback from the stakeholder groups would be compared to determine areas of agreement as well as areas of divergence