

Key Insights
The global chemical logistics market is experiencing robust growth, driven by the expanding chemical industry and increasing demand for efficient and secure transportation and handling of chemicals. A CAGR exceeding 4.00% indicates a significant expansion projected through 2033. This growth is fueled by several key factors. The rise of e-commerce and the need for faster delivery times are significantly impacting the demand for efficient logistics solutions. Furthermore, increasing regulatory scrutiny regarding the safe transport of hazardous materials is driving investment in specialized services and technologies within the chemical logistics sector. Growth is also spurred by the expanding pharmaceutical and cosmetic industries, both reliant on timely and secure chemical supply chains. The market is segmented by service (transportation, warehousing, etc.), mode of transportation (roadways, railways, etc.), and end-user industry (pharmaceuticals, oil & gas, etc.). Competition is intense, with established global players like DHL and Agility Logistics alongside regional specialists vying for market share. While growth is promising, challenges remain, including fluctuating fuel prices, geopolitical instability impacting trade routes, and the need for continuous improvement in supply chain resilience and sustainability. The increasing adoption of green logistics solutions presents a significant opportunity for market participants to differentiate themselves and appeal to environmentally conscious clients. Geographically, North America and Asia Pacific are currently leading the market, but substantial growth potential exists in emerging markets across the Middle East and South America. The market's evolution will likely be shaped by technological advancements, such as the increasing use of digital platforms for tracking and managing shipments, as well as the adoption of automation and AI in warehouse operations.
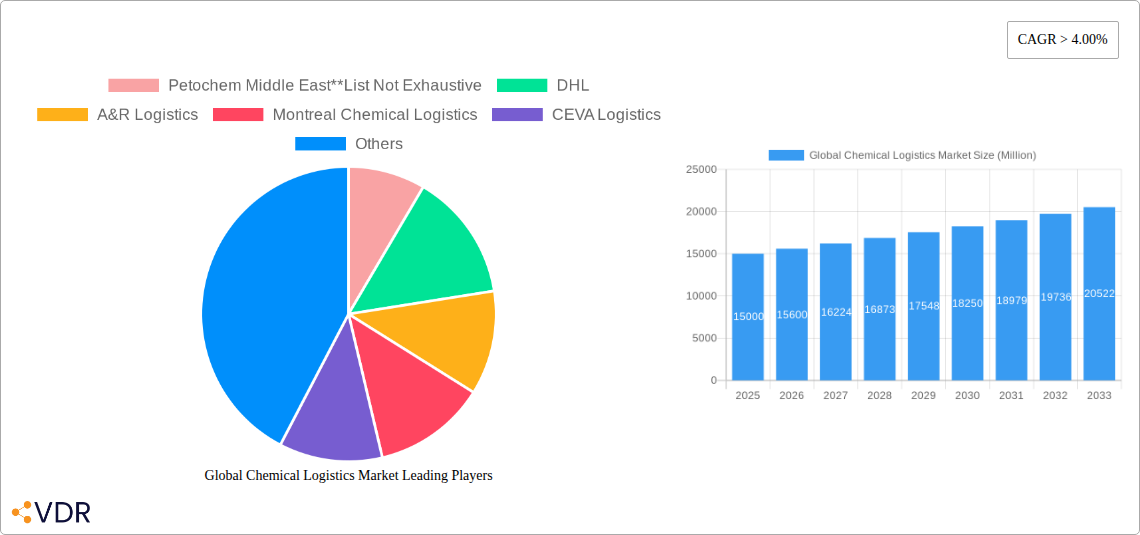
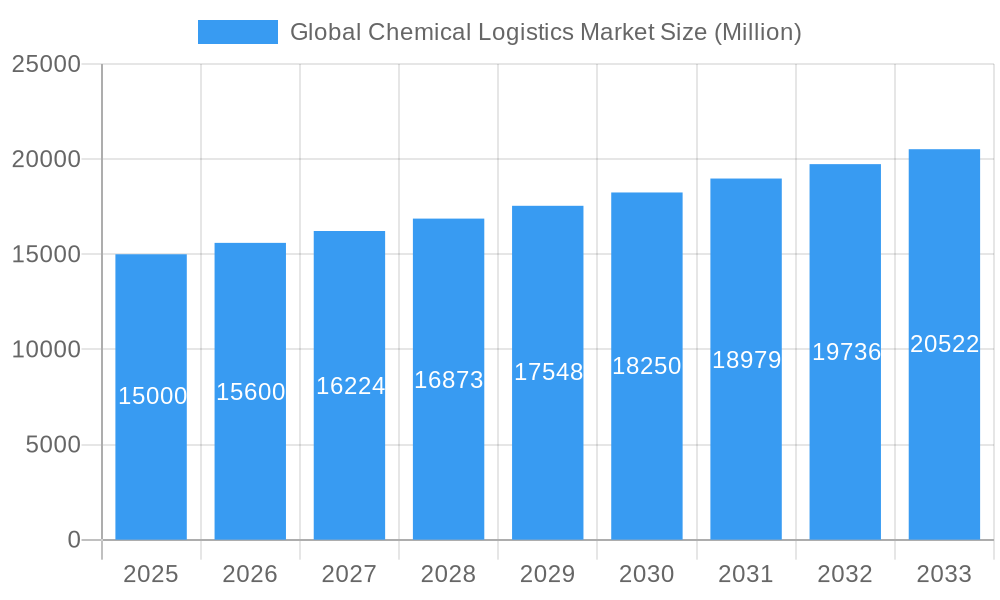
Global Chemical Logistics Market Market Size (In Billion)
The forecast for the chemical logistics market indicates sustained growth over the next decade. While precise figures are not available for all segments, a reasonable estimation suggests a significant increase in market value, primarily driven by the factors discussed above. The strategic geographic expansion of major players will further accelerate this growth, particularly as demand increases in emerging economies. The consolidation within the industry is also expected, with larger players acquiring smaller regional companies to enhance their market share and service offerings. Furthermore, specialized services like green logistics and advanced consulting services are anticipated to witness faster growth compared to traditional segments. The successful navigation of regulatory hurdles and a sustained focus on safety and sustainability will determine long-term market leadership within this dynamic sector.
Global Chemical Logistics Market Company Market Share
This comprehensive report provides a detailed analysis of the Global Chemical Logistics Market, offering invaluable insights for industry professionals, investors, and strategic decision-makers. The study covers the period from 2019 to 2033, with 2025 serving as the base and estimated year. We delve into market dynamics, growth trends, regional dominance, product landscapes, and key players, equipping you with the knowledge to navigate this complex and evolving sector.
Global Chemical Logistics Market Dynamics & Structure
The global chemical logistics market is a fragmented yet dynamic landscape, characterized by both intense competition and significant growth potential. Market concentration is relatively low, with no single entity holding a dominant share. However, large multinational logistics providers are increasingly consolidating their presence through mergers and acquisitions (M&A). We estimate that approximately xx M&A deals occurred in the chemical logistics sector between 2019 and 2024, driving market consolidation. Technological innovation, particularly in areas like automation, blockchain, and data analytics, is a key driver, enhancing efficiency and supply chain visibility.
- Market Concentration: Low, with top 5 players holding an estimated xx% market share in 2025.
- Technological Innovation: Significant advancements in automation, AI, and IoT are transforming operations.
- Regulatory Frameworks: Stringent regulations regarding hazardous materials transport significantly impact operational costs and complexities.
- Competitive Substitutes: Limited direct substitutes, with the primary competition stemming from internal logistics capabilities of large chemical companies.
- End-User Demographics: The market is driven by diverse end-users, including the pharmaceutical, cosmetic, oil & gas, and specialty chemicals industries.
- M&A Trends: Consolidation is expected to continue, driven by economies of scale and enhanced service offerings. The average deal size is estimated at xx million USD.
- Innovation Barriers: High initial investment costs for implementing new technologies and a lack of skilled labor can hinder innovation.
Global Chemical Logistics Market Growth Trends & Insights
The global chemical logistics market is experiencing dynamic growth, propelled by the escalating volume of international chemical trade, a surge in demand from developing economies, and the widespread adoption of advanced supply chain management practices. The market size, valued at approximately **[Insert Market Value Here]** million in 2024, is projected to reach **[Insert Projected Market Value Here]** million by 2033, demonstrating a Compound Annual Growth Rate (CAGR) of **[Insert CAGR Here]%** over the forecast period (2025-2033). This expansion is underpinned by several pivotal factors: the growing requirement for specialized chemical logistics services, the increasing integration of cutting-edge technologies to bolster efficiency and end-to-end visibility within supply chains, and a discernible trend towards outsourcing logistics functions. Moreover, the accelerating shift towards sustainable and environmentally responsible logistics operations is poised to be a significant catalyst for market growth. Evolving consumer preferences, which increasingly prioritize sustainability and transparency in their supply chains, are directly influencing the demand for green logistics solutions.
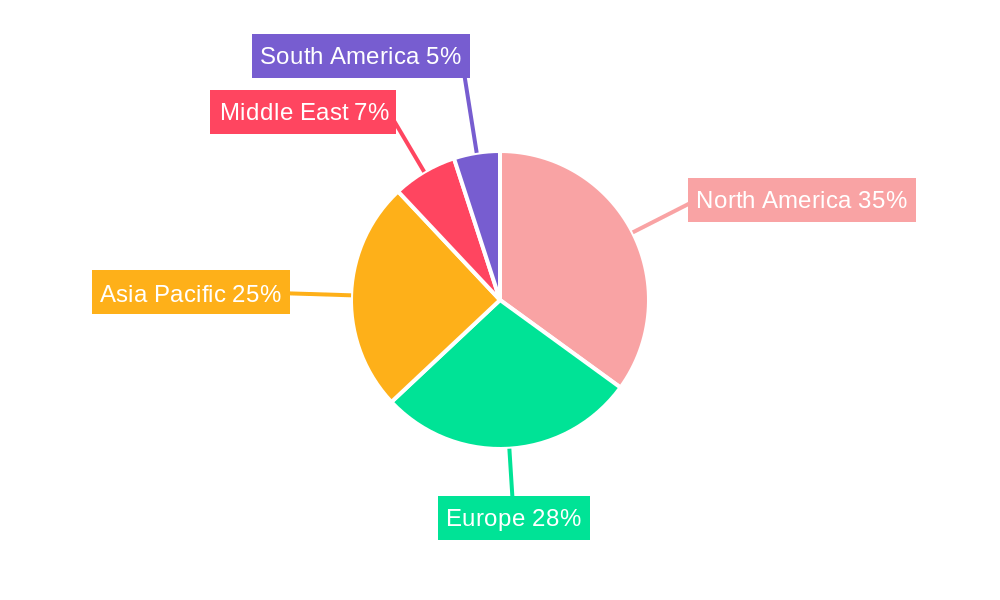
Dominant Regions, Countries, or Segments in Global Chemical Logistics Market
Currently, North America and Europe hold a dominant position in the global chemical logistics market, collectively representing approximately **[Insert Percentage Here]%** of the market share in 2025. However, the Asia-Pacific region is anticipated to exhibit the most rapid growth trajectory during the forecast period, fueled by accelerated industrialization and expanding chemical production in key economies such as China and India.
By Service: Transportation currently commands the largest market share, closely followed by warehousing and distribution. The green logistics segment is emerging as a rapidly growing area within the market.
- Transportation: Sustained high demand for secure and efficient transportation solutions for a diverse range of chemicals, including hazardous materials.
- Warehousing: Ongoing need for specialized warehousing facilities that strictly adhere to stringent safety and regulatory compliance standards.
- Distribution: Increasing emphasis on optimizing efficient last-mile delivery networks to ensure timely and secure product delivery.
- Consulting & Management Services: Growth in this segment is driven by the inherent complexity of managing sophisticated global chemical supply chains and the need for expert guidance.
- Customs & Security: Navigating stringent international regulations necessitates specialized expertise in handling documentation, customs clearance, and security protocols.
- Green Logistics: Rising global environmental consciousness and corporate sustainability initiatives are driving the adoption and expansion of eco-friendly logistics solutions.
- Others: Encompasses a range of value-added services such as specialized chemical packaging, accurate labeling, and comprehensive quality control measures.
By Mode of Transportation: Roadways continue to be the predominant mode, followed by railways and waterways. Pipelines play a significant role for the transportation of specific bulk chemical products.
- Roadways: Offers superior flexibility and accessibility, particularly advantageous for short-to-medium distance logistics operations.
- Railways: Provides a cost-effective solution for the long-distance transportation of large volumes of chemical products.
- Airways: Primarily utilized for time-sensitive, high-value, or critical chemical shipments where speed is paramount.
- Waterways: An efficient and economical option for bulk chemical transportation over extensive geographical distances.
- Pipelines: Offers unparalleled efficiency and safety for the continuous, long-distance transportation of specific liquid and gaseous chemicals.
By End User: The pharmaceutical and oil & gas industries are consistently the largest consumers of chemical logistics services, reflecting the inherent demands of these sectors.
- Pharmaceutical Industry: Stringent adherence to quality, safety, and regulatory standards drives a significant demand for highly specialized and secure logistics solutions.
- Cosmetic Industry: Requires efficient and reliable transportation of often delicate and sensitive cosmetic products, demanding careful handling.
- Oil and Gas Industry: The large-scale transportation of hazardous materials and bulk quantities necessitates specialized and robust logistics infrastructure.
- Specialty Chemicals Industry: The diverse and often unique properties of specialty chemicals demand highly tailored and customized logistics solutions.
- Other End Users: Includes a broad spectrum of manufacturing, industrial, and agricultural sectors with varying chemical logistics needs.
Global Chemical Logistics Market Product Landscape
The product landscape within the global chemical logistics market is defined by a sophisticated array of specialized services meticulously designed to address the unique and often stringent requirements of the chemical industry. This includes advanced temperature-controlled transportation solutions for sensitive and reactive chemicals, expert handling and secure packaging for hazardous materials, and the deployment of cutting-edge supply chain management software that offers real-time visibility and precise tracking capabilities across the entire supply chain. Innovation within this sector is intensely focused on developing logistics solutions that are not only more efficient and safer but also increasingly sustainable. Emerging technologies such as autonomous vehicles for streamlined operations and blockchain technology for enhanced transparency, traceability, and security are at the forefront of these advancements.
Key Drivers, Barriers & Challenges in Global Chemical Logistics Market
Key Drivers: The market is propelled by the continuous growth in global chemical trade, escalating demand from rapidly industrializing emerging economies, the imperative of adhering to increasingly stringent regulatory requirements that mandate improved safety and operational efficiency, and rapid technological advancements that are enabling enhanced tracking, robust supply chain optimization, and improved risk management.
Key Challenges & Restraints: Significant challenges include volatility in global fuel prices, geopolitical instability that can disrupt established trade routes and supply chains, the increasing operational costs associated with stringent safety regulations, and persistent shortages of skilled labor. Moreover, supply chain disruptions, exemplified by the approximately **[Insert Percentage Here]%** increase in transportation costs observed in 2022 due to unforeseen global events, continue to pose a considerable and persistent challenge to market stability and profitability.
Emerging Opportunities in Global Chemical Logistics Market
Emerging opportunities lie in the growing adoption of green logistics solutions, the expansion of e-commerce for chemical products (though limited due to safety regulations), and the development of specialized services for the growing specialty chemicals sector. The increasing demand for customized logistics solutions presents a significant opportunity for companies that can tailor their services to specific customer needs.
Growth Accelerators in the Global Chemical Logistics Market Industry
Long-term growth is fueled by the ongoing advancements in technology, fostering automation, improved safety measures, and increased efficiency. Strategic partnerships between logistics providers and chemical companies can streamline processes and improve overall supply chain performance. Expansion into emerging markets presents further growth potential.
Key Players Shaping the Global Chemical Logistics Market Market
- Petochem Middle East
- DHL
- A&R Logistics
- Montreal Chemical Logistics
- CEVA Logistics
- Al-Futtaim Logistics
- Agility Logistics
- BDP International
- C.H. Robinson
- Rhenus Logistics
Notable Milestones in Global Chemical Logistics Market Sector
- 2022 Q3: DHL launches a new blockchain-based platform for tracking hazardous materials.
- 2021 Q4: A&R Logistics acquires a specialized chemical warehousing facility.
- 2020 Q1: CEVA Logistics implements a new AI-powered route optimization system.
- (Further milestones to be added based on data)
In-Depth Global Chemical Logistics Market Outlook
The future of the global chemical logistics market looks promising, driven by sustained growth in the chemical industry, technological advancements, and a focus on sustainability. Strategic partnerships, investments in innovative technologies, and expansion into new markets will be crucial for success in this dynamic sector. The market's long-term potential is significant, particularly in regions with rapid industrialization and growing chemical production.
Global Chemical Logistics Market Segmentation
-
1. Service
- 1.1. Transportation
- 1.2. Warehous
- 1.3. Consulting & Management Services
- 1.4. Customs & Security
- 1.5. Green Logistics
- 1.6. Others
-
2. Mode of Transportation
- 2.1. Roadways
- 2.2. Railways
- 2.3. Airways
- 2.4. Waterways
- 2.5. Pipelines
-
3. End User
- 3.1. Pharmaceutical Industry
- 3.2. Cosmetic Industry
- 3.3. Oil and Gas Industry
- 3.4. Specialty Chemicals Industry
- 3.5. Other End Users
Global Chemical Logistics Market Segmentation By Geography
-
1. North America
- 1.1. United States
- 1.2. Canada
- 1.3. Mexico
-
2. Europe
- 2.1. Germany
- 2.2. France
- 2.3. United Kingdom
- 2.4. Italy
- 2.5. Spain
- 2.6. Russia
- 2.7. Rest of Europe
-
3. Asia Pacific
- 3.1. China
- 3.2. Japan
- 3.3. India
- 3.4. Bangladesh
- 3.5. Turkey
- 3.6. South Korea
- 3.7. Australia
- 3.8. Indonesia
- 3.9. Rest of Asia Pacific
- 4. Middle East
-
5. Egypt
- 5.1. South Africa
- 5.2. Saudi Arabia
- 5.3. Rest of Middle East
-
6. South America
- 6.1. Brazil
- 6.2. Argentina
- 6.3. Rest of South America
Global Chemical Logistics Market Regional Market Share
Geographic Coverage of Global Chemical Logistics Market
Global Chemical Logistics Market REPORT HIGHLIGHTS
| Aspects | Details |
|---|---|
| Study Period | 2020-2034 |
| Base Year | 2025 |
| Estimated Year | 2026 |
| Forecast Period | 2026-2034 |
| Historical Period | 2020-2025 |
| Growth Rate | CAGR of 5.2% from 2020-2034 |
| Segmentation |
|
Table of Contents
- 1. Introduction
- 1.1. Research Scope
- 1.2. Market Segmentation
- 1.3. Research Objective
- 1.4. Definitions and Assumptions
- 2. Executive Summary
- 2.1. Market Snapshot
- 3. Market Dynamics
- 3.1. Market Drivers
- 3.2. Market Restrains
- 3.3. Market Trends
- 3.4. Market Opportunities
- 4. Market Factor Analysis
- 4.1. Porters Five Forces
- 4.1.1. Bargaining Power of Suppliers
- 4.1.2. Bargaining Power of Buyers
- 4.1.3. Threat of New Entrants
- 4.1.4. Threat of Substitutes
- 4.1.5. Competitive Rivalry
- 4.2. PESTEL analysis
- 4.3. BCG Analysis
- 4.3.1. Stars (High Growth, High Market Share)
- 4.3.2. Cash Cows (Low Growth, High Market Share)
- 4.3.3. Question Mark (High Growth, Low Market Share)
- 4.3.4. Dogs (Low Growth, Low Market Share)
- 4.4. Ansoff Matrix Analysis
- 4.5. Supply Chain Analysis
- 4.6. Regulatory Landscape
- 4.7. Current Market Potential and Opportunity Assessment (TAM–SAM–SOM Framework)
- 4.8. VDR Analyst Note
- 4.1. Porters Five Forces
- 5. Market Analysis, Insights and Forecast 2021-2033
- 5.1. Market Analysis, Insights and Forecast - by Service
- 5.1.1. Transportation
- 5.1.2. Warehous
- 5.1.3. Consulting & Management Services
- 5.1.4. Customs & Security
- 5.1.5. Green Logistics
- 5.1.6. Others
- 5.2. Market Analysis, Insights and Forecast - by Mode of Transportation
- 5.2.1. Roadways
- 5.2.2. Railways
- 5.2.3. Airways
- 5.2.4. Waterways
- 5.2.5. Pipelines
- 5.3. Market Analysis, Insights and Forecast - by End User
- 5.3.1. Pharmaceutical Industry
- 5.3.2. Cosmetic Industry
- 5.3.3. Oil and Gas Industry
- 5.3.4. Specialty Chemicals Industry
- 5.3.5. Other End Users
- 5.4. Market Analysis, Insights and Forecast - by Region
- 5.4.1. North America
- 5.4.2. Europe
- 5.4.3. Asia Pacific
- 5.4.4. Middle East
- 5.4.5. Egypt
- 5.4.6. South America
- 5.1. Market Analysis, Insights and Forecast - by Service
- 6. Global Chemical Logistics Market Analysis, Insights and Forecast, 2021-2033
- 6.1. Market Analysis, Insights and Forecast - by Service
- 6.1.1. Transportation
- 6.1.2. Warehous
- 6.1.3. Consulting & Management Services
- 6.1.4. Customs & Security
- 6.1.5. Green Logistics
- 6.1.6. Others
- 6.2. Market Analysis, Insights and Forecast - by Mode of Transportation
- 6.2.1. Roadways
- 6.2.2. Railways
- 6.2.3. Airways
- 6.2.4. Waterways
- 6.2.5. Pipelines
- 6.3. Market Analysis, Insights and Forecast - by End User
- 6.3.1. Pharmaceutical Industry
- 6.3.2. Cosmetic Industry
- 6.3.3. Oil and Gas Industry
- 6.3.4. Specialty Chemicals Industry
- 6.3.5. Other End Users
- 6.1. Market Analysis, Insights and Forecast - by Service
- 7. North America Global Chemical Logistics Market Analysis, Insights and Forecast, 2021-2033
- 7.1. Market Analysis, Insights and Forecast - by Service
- 7.1.1. Transportation
- 7.1.2. Warehous
- 7.1.3. Consulting & Management Services
- 7.1.4. Customs & Security
- 7.1.5. Green Logistics
- 7.1.6. Others
- 7.2. Market Analysis, Insights and Forecast - by Mode of Transportation
- 7.2.1. Roadways
- 7.2.2. Railways
- 7.2.3. Airways
- 7.2.4. Waterways
- 7.2.5. Pipelines
- 7.3. Market Analysis, Insights and Forecast - by End User
- 7.3.1. Pharmaceutical Industry
- 7.3.2. Cosmetic Industry
- 7.3.3. Oil and Gas Industry
- 7.3.4. Specialty Chemicals Industry
- 7.3.5. Other End Users
- 7.1. Market Analysis, Insights and Forecast - by Service
- 8. Europe Global Chemical Logistics Market Analysis, Insights and Forecast, 2021-2033
- 8.1. Market Analysis, Insights and Forecast - by Service
- 8.1.1. Transportation
- 8.1.2. Warehous
- 8.1.3. Consulting & Management Services
- 8.1.4. Customs & Security
- 8.1.5. Green Logistics
- 8.1.6. Others
- 8.2. Market Analysis, Insights and Forecast - by Mode of Transportation
- 8.2.1. Roadways
- 8.2.2. Railways
- 8.2.3. Airways
- 8.2.4. Waterways
- 8.2.5. Pipelines
- 8.3. Market Analysis, Insights and Forecast - by End User
- 8.3.1. Pharmaceutical Industry
- 8.3.2. Cosmetic Industry
- 8.3.3. Oil and Gas Industry
- 8.3.4. Specialty Chemicals Industry
- 8.3.5. Other End Users
- 8.1. Market Analysis, Insights and Forecast - by Service
- 9. Asia Pacific Global Chemical Logistics Market Analysis, Insights and Forecast, 2021-2033
- 9.1. Market Analysis, Insights and Forecast - by Service
- 9.1.1. Transportation
- 9.1.2. Warehous
- 9.1.3. Consulting & Management Services
- 9.1.4. Customs & Security
- 9.1.5. Green Logistics
- 9.1.6. Others
- 9.2. Market Analysis, Insights and Forecast - by Mode of Transportation
- 9.2.1. Roadways
- 9.2.2. Railways
- 9.2.3. Airways
- 9.2.4. Waterways
- 9.2.5. Pipelines
- 9.3. Market Analysis, Insights and Forecast - by End User
- 9.3.1. Pharmaceutical Industry
- 9.3.2. Cosmetic Industry
- 9.3.3. Oil and Gas Industry
- 9.3.4. Specialty Chemicals Industry
- 9.3.5. Other End Users
- 9.1. Market Analysis, Insights and Forecast - by Service
- 10. Middle East Global Chemical Logistics Market Analysis, Insights and Forecast, 2021-2033
- 10.1. Market Analysis, Insights and Forecast - by Service
- 10.1.1. Transportation
- 10.1.2. Warehous
- 10.1.3. Consulting & Management Services
- 10.1.4. Customs & Security
- 10.1.5. Green Logistics
- 10.1.6. Others
- 10.2. Market Analysis, Insights and Forecast - by Mode of Transportation
- 10.2.1. Roadways
- 10.2.2. Railways
- 10.2.3. Airways
- 10.2.4. Waterways
- 10.2.5. Pipelines
- 10.3. Market Analysis, Insights and Forecast - by End User
- 10.3.1. Pharmaceutical Industry
- 10.3.2. Cosmetic Industry
- 10.3.3. Oil and Gas Industry
- 10.3.4. Specialty Chemicals Industry
- 10.3.5. Other End Users
- 10.1. Market Analysis, Insights and Forecast - by Service
- 11. Egypt Global Chemical Logistics Market Analysis, Insights and Forecast, 2021-2033
- 11.1. Market Analysis, Insights and Forecast - by Service
- 11.1.1. Transportation
- 11.1.2. Warehous
- 11.1.3. Consulting & Management Services
- 11.1.4. Customs & Security
- 11.1.5. Green Logistics
- 11.1.6. Others
- 11.2. Market Analysis, Insights and Forecast - by Mode of Transportation
- 11.2.1. Roadways
- 11.2.2. Railways
- 11.2.3. Airways
- 11.2.4. Waterways
- 11.2.5. Pipelines
- 11.3. Market Analysis, Insights and Forecast - by End User
- 11.3.1. Pharmaceutical Industry
- 11.3.2. Cosmetic Industry
- 11.3.3. Oil and Gas Industry
- 11.3.4. Specialty Chemicals Industry
- 11.3.5. Other End Users
- 11.1. Market Analysis, Insights and Forecast - by Service
- 12. South America Global Chemical Logistics Market Analysis, Insights and Forecast, 2021-2033
- 12.1. Market Analysis, Insights and Forecast - by Service
- 12.1.1. Transportation
- 12.1.2. Warehous
- 12.1.3. Consulting & Management Services
- 12.1.4. Customs & Security
- 12.1.5. Green Logistics
- 12.1.6. Others
- 12.2. Market Analysis, Insights and Forecast - by Mode of Transportation
- 12.2.1. Roadways
- 12.2.2. Railways
- 12.2.3. Airways
- 12.2.4. Waterways
- 12.2.5. Pipelines
- 12.3. Market Analysis, Insights and Forecast - by End User
- 12.3.1. Pharmaceutical Industry
- 12.3.2. Cosmetic Industry
- 12.3.3. Oil and Gas Industry
- 12.3.4. Specialty Chemicals Industry
- 12.3.5. Other End Users
- 12.1. Market Analysis, Insights and Forecast - by Service
- 13. Competitive Analysis
- 13.1. Company Profiles
- 13.1.1 Petochem Middle East**List Not Exhaustive
- 13.1.1.1. Company Overview
- 13.1.1.2. Products
- 13.1.1.3. Company Financials
- 13.1.1.4. SWOT Analysis
- 13.1.2 DHL
- 13.1.2.1. Company Overview
- 13.1.2.2. Products
- 13.1.2.3. Company Financials
- 13.1.2.4. SWOT Analysis
- 13.1.3 A&R Logistics
- 13.1.3.1. Company Overview
- 13.1.3.2. Products
- 13.1.3.3. Company Financials
- 13.1.3.4. SWOT Analysis
- 13.1.4 Montreal Chemical Logistics
- 13.1.4.1. Company Overview
- 13.1.4.2. Products
- 13.1.4.3. Company Financials
- 13.1.4.4. SWOT Analysis
- 13.1.5 CEVA Logistics
- 13.1.5.1. Company Overview
- 13.1.5.2. Products
- 13.1.5.3. Company Financials
- 13.1.5.4. SWOT Analysis
- 13.1.6 Al-Futtaim Logistics
- 13.1.6.1. Company Overview
- 13.1.6.2. Products
- 13.1.6.3. Company Financials
- 13.1.6.4. SWOT Analysis
- 13.1.7 Agility Logistics
- 13.1.7.1. Company Overview
- 13.1.7.2. Products
- 13.1.7.3. Company Financials
- 13.1.7.4. SWOT Analysis
- 13.1.8 BDP International
- 13.1.8.1. Company Overview
- 13.1.8.2. Products
- 13.1.8.3. Company Financials
- 13.1.8.4. SWOT Analysis
- 13.1.9 C H Robinson
- 13.1.9.1. Company Overview
- 13.1.9.2. Products
- 13.1.9.3. Company Financials
- 13.1.9.4. SWOT Analysis
- 13.1.10 Rhenus Logistics
- 13.1.10.1. Company Overview
- 13.1.10.2. Products
- 13.1.10.3. Company Financials
- 13.1.10.4. SWOT Analysis
- 13.1.1 Petochem Middle East**List Not Exhaustive
- 13.2. Market Entropy
- 13.2.1 Company's Key Areas Served
- 13.2.2 Recent Developments
- 13.3. Company Market Share Analysis 2025
- 13.3.1 Top 5 Companies Market Share Analysis
- 13.3.2 Top 3 Companies Market Share Analysis
- 13.4. List of Potential Customers
- 14. Research Methodology
List of Figures
- Figure 1: Global Global Chemical Logistics Market Revenue Breakdown (billion, %) by Region 2025 & 2033
- Figure 2: North America Global Chemical Logistics Market Revenue (billion), by Service 2025 & 2033
- Figure 3: North America Global Chemical Logistics Market Revenue Share (%), by Service 2025 & 2033
- Figure 4: North America Global Chemical Logistics Market Revenue (billion), by Mode of Transportation 2025 & 2033
- Figure 5: North America Global Chemical Logistics Market Revenue Share (%), by Mode of Transportation 2025 & 2033
- Figure 6: North America Global Chemical Logistics Market Revenue (billion), by End User 2025 & 2033
- Figure 7: North America Global Chemical Logistics Market Revenue Share (%), by End User 2025 & 2033
- Figure 8: North America Global Chemical Logistics Market Revenue (billion), by Country 2025 & 2033
- Figure 9: North America Global Chemical Logistics Market Revenue Share (%), by Country 2025 & 2033
- Figure 10: Europe Global Chemical Logistics Market Revenue (billion), by Service 2025 & 2033
- Figure 11: Europe Global Chemical Logistics Market Revenue Share (%), by Service 2025 & 2033
- Figure 12: Europe Global Chemical Logistics Market Revenue (billion), by Mode of Transportation 2025 & 2033
- Figure 13: Europe Global Chemical Logistics Market Revenue Share (%), by Mode of Transportation 2025 & 2033
- Figure 14: Europe Global Chemical Logistics Market Revenue (billion), by End User 2025 & 2033
- Figure 15: Europe Global Chemical Logistics Market Revenue Share (%), by End User 2025 & 2033
- Figure 16: Europe Global Chemical Logistics Market Revenue (billion), by Country 2025 & 2033
- Figure 17: Europe Global Chemical Logistics Market Revenue Share (%), by Country 2025 & 2033
- Figure 18: Asia Pacific Global Chemical Logistics Market Revenue (billion), by Service 2025 & 2033
- Figure 19: Asia Pacific Global Chemical Logistics Market Revenue Share (%), by Service 2025 & 2033
- Figure 20: Asia Pacific Global Chemical Logistics Market Revenue (billion), by Mode of Transportation 2025 & 2033
- Figure 21: Asia Pacific Global Chemical Logistics Market Revenue Share (%), by Mode of Transportation 2025 & 2033
- Figure 22: Asia Pacific Global Chemical Logistics Market Revenue (billion), by End User 2025 & 2033
- Figure 23: Asia Pacific Global Chemical Logistics Market Revenue Share (%), by End User 2025 & 2033
- Figure 24: Asia Pacific Global Chemical Logistics Market Revenue (billion), by Country 2025 & 2033
- Figure 25: Asia Pacific Global Chemical Logistics Market Revenue Share (%), by Country 2025 & 2033
- Figure 26: Middle East Global Chemical Logistics Market Revenue (billion), by Service 2025 & 2033
- Figure 27: Middle East Global Chemical Logistics Market Revenue Share (%), by Service 2025 & 2033
- Figure 28: Middle East Global Chemical Logistics Market Revenue (billion), by Mode of Transportation 2025 & 2033
- Figure 29: Middle East Global Chemical Logistics Market Revenue Share (%), by Mode of Transportation 2025 & 2033
- Figure 30: Middle East Global Chemical Logistics Market Revenue (billion), by End User 2025 & 2033
- Figure 31: Middle East Global Chemical Logistics Market Revenue Share (%), by End User 2025 & 2033
- Figure 32: Middle East Global Chemical Logistics Market Revenue (billion), by Country 2025 & 2033
- Figure 33: Middle East Global Chemical Logistics Market Revenue Share (%), by Country 2025 & 2033
- Figure 34: Egypt Global Chemical Logistics Market Revenue (billion), by Service 2025 & 2033
- Figure 35: Egypt Global Chemical Logistics Market Revenue Share (%), by Service 2025 & 2033
- Figure 36: Egypt Global Chemical Logistics Market Revenue (billion), by Mode of Transportation 2025 & 2033
- Figure 37: Egypt Global Chemical Logistics Market Revenue Share (%), by Mode of Transportation 2025 & 2033
- Figure 38: Egypt Global Chemical Logistics Market Revenue (billion), by End User 2025 & 2033
- Figure 39: Egypt Global Chemical Logistics Market Revenue Share (%), by End User 2025 & 2033
- Figure 40: Egypt Global Chemical Logistics Market Revenue (billion), by Country 2025 & 2033
- Figure 41: Egypt Global Chemical Logistics Market Revenue Share (%), by Country 2025 & 2033
- Figure 42: South America Global Chemical Logistics Market Revenue (billion), by Service 2025 & 2033
- Figure 43: South America Global Chemical Logistics Market Revenue Share (%), by Service 2025 & 2033
- Figure 44: South America Global Chemical Logistics Market Revenue (billion), by Mode of Transportation 2025 & 2033
- Figure 45: South America Global Chemical Logistics Market Revenue Share (%), by Mode of Transportation 2025 & 2033
- Figure 46: South America Global Chemical Logistics Market Revenue (billion), by End User 2025 & 2033
- Figure 47: South America Global Chemical Logistics Market Revenue Share (%), by End User 2025 & 2033
- Figure 48: South America Global Chemical Logistics Market Revenue (billion), by Country 2025 & 2033
- Figure 49: South America Global Chemical Logistics Market Revenue Share (%), by Country 2025 & 2033
List of Tables
- Table 1: Global Chemical Logistics Market Revenue billion Forecast, by Service 2020 & 2033
- Table 2: Global Chemical Logistics Market Revenue billion Forecast, by Mode of Transportation 2020 & 2033
- Table 3: Global Chemical Logistics Market Revenue billion Forecast, by End User 2020 & 2033
- Table 4: Global Chemical Logistics Market Revenue billion Forecast, by Region 2020 & 2033
- Table 5: Global Chemical Logistics Market Revenue billion Forecast, by Service 2020 & 2033
- Table 6: Global Chemical Logistics Market Revenue billion Forecast, by Mode of Transportation 2020 & 2033
- Table 7: Global Chemical Logistics Market Revenue billion Forecast, by End User 2020 & 2033
- Table 8: Global Chemical Logistics Market Revenue billion Forecast, by Country 2020 & 2033
- Table 9: United States Global Chemical Logistics Market Revenue (billion) Forecast, by Application 2020 & 2033
- Table 10: Canada Global Chemical Logistics Market Revenue (billion) Forecast, by Application 2020 & 2033
- Table 11: Mexico Global Chemical Logistics Market Revenue (billion) Forecast, by Application 2020 & 2033
- Table 12: Global Chemical Logistics Market Revenue billion Forecast, by Service 2020 & 2033
- Table 13: Global Chemical Logistics Market Revenue billion Forecast, by Mode of Transportation 2020 & 2033
- Table 14: Global Chemical Logistics Market Revenue billion Forecast, by End User 2020 & 2033
- Table 15: Global Chemical Logistics Market Revenue billion Forecast, by Country 2020 & 2033
- Table 16: Germany Global Chemical Logistics Market Revenue (billion) Forecast, by Application 2020 & 2033
- Table 17: France Global Chemical Logistics Market Revenue (billion) Forecast, by Application 2020 & 2033
- Table 18: United Kingdom Global Chemical Logistics Market Revenue (billion) Forecast, by Application 2020 & 2033
- Table 19: Italy Global Chemical Logistics Market Revenue (billion) Forecast, by Application 2020 & 2033
- Table 20: Spain Global Chemical Logistics Market Revenue (billion) Forecast, by Application 2020 & 2033
- Table 21: Russia Global Chemical Logistics Market Revenue (billion) Forecast, by Application 2020 & 2033
- Table 22: Rest of Europe Global Chemical Logistics Market Revenue (billion) Forecast, by Application 2020 & 2033
- Table 23: Global Chemical Logistics Market Revenue billion Forecast, by Service 2020 & 2033
- Table 24: Global Chemical Logistics Market Revenue billion Forecast, by Mode of Transportation 2020 & 2033
- Table 25: Global Chemical Logistics Market Revenue billion Forecast, by End User 2020 & 2033
- Table 26: Global Chemical Logistics Market Revenue billion Forecast, by Country 2020 & 2033
- Table 27: China Global Chemical Logistics Market Revenue (billion) Forecast, by Application 2020 & 2033
- Table 28: Japan Global Chemical Logistics Market Revenue (billion) Forecast, by Application 2020 & 2033
- Table 29: India Global Chemical Logistics Market Revenue (billion) Forecast, by Application 2020 & 2033
- Table 30: Bangladesh Global Chemical Logistics Market Revenue (billion) Forecast, by Application 2020 & 2033
- Table 31: Turkey Global Chemical Logistics Market Revenue (billion) Forecast, by Application 2020 & 2033
- Table 32: South Korea Global Chemical Logistics Market Revenue (billion) Forecast, by Application 2020 & 2033
- Table 33: Australia Global Chemical Logistics Market Revenue (billion) Forecast, by Application 2020 & 2033
- Table 34: Indonesia Global Chemical Logistics Market Revenue (billion) Forecast, by Application 2020 & 2033
- Table 35: Rest of Asia Pacific Global Chemical Logistics Market Revenue (billion) Forecast, by Application 2020 & 2033
- Table 36: Global Chemical Logistics Market Revenue billion Forecast, by Service 2020 & 2033
- Table 37: Global Chemical Logistics Market Revenue billion Forecast, by Mode of Transportation 2020 & 2033
- Table 38: Global Chemical Logistics Market Revenue billion Forecast, by End User 2020 & 2033
- Table 39: Global Chemical Logistics Market Revenue billion Forecast, by Country 2020 & 2033
- Table 40: Global Chemical Logistics Market Revenue billion Forecast, by Service 2020 & 2033
- Table 41: Global Chemical Logistics Market Revenue billion Forecast, by Mode of Transportation 2020 & 2033
- Table 42: Global Chemical Logistics Market Revenue billion Forecast, by End User 2020 & 2033
- Table 43: Global Chemical Logistics Market Revenue billion Forecast, by Country 2020 & 2033
- Table 44: South Africa Global Chemical Logistics Market Revenue (billion) Forecast, by Application 2020 & 2033
- Table 45: Saudi Arabia Global Chemical Logistics Market Revenue (billion) Forecast, by Application 2020 & 2033
- Table 46: Rest of Middle East Global Chemical Logistics Market Revenue (billion) Forecast, by Application 2020 & 2033
- Table 47: Global Chemical Logistics Market Revenue billion Forecast, by Service 2020 & 2033
- Table 48: Global Chemical Logistics Market Revenue billion Forecast, by Mode of Transportation 2020 & 2033
- Table 49: Global Chemical Logistics Market Revenue billion Forecast, by End User 2020 & 2033
- Table 50: Global Chemical Logistics Market Revenue billion Forecast, by Country 2020 & 2033
- Table 51: Brazil Global Chemical Logistics Market Revenue (billion) Forecast, by Application 2020 & 2033
- Table 52: Argentina Global Chemical Logistics Market Revenue (billion) Forecast, by Application 2020 & 2033
- Table 53: Rest of South America Global Chemical Logistics Market Revenue (billion) Forecast, by Application 2020 & 2033
Frequently Asked Questions
1. What is the projected Compound Annual Growth Rate (CAGR) of the Global Chemical Logistics Market?
The projected CAGR is approximately 5.2%.
2. Which companies are prominent players in the Global Chemical Logistics Market?
Key companies in the market include Petochem Middle East**List Not Exhaustive, DHL, A&R Logistics, Montreal Chemical Logistics, CEVA Logistics, Al-Futtaim Logistics, Agility Logistics, BDP International, C H Robinson, Rhenus Logistics.
3. What are the main segments of the Global Chemical Logistics Market?
The market segments include Service, Mode of Transportation, End User.
4. Can you provide details about the market size?
The market size is estimated to be USD 300.5 billion as of 2022.
5. What are some drivers contributing to market growth?
Growing Events in E-commerce Sector; Increasing Demand for Qualified Event Logistics Services.
6. What are the notable trends driving market growth?
Chemical Sector Significant Expansion Driving the market.
7. Are there any restraints impacting market growth?
High Labour Cost; High Pricing.
8. Can you provide examples of recent developments in the market?
N/A
9. What pricing options are available for accessing the report?
Pricing options include single-user, multi-user, and enterprise licenses priced at USD 4750, USD 5250, and USD 8750 respectively.
10. Is the market size provided in terms of value or volume?
The market size is provided in terms of value, measured in billion.
11. Are there any specific market keywords associated with the report?
Yes, the market keyword associated with the report is "Global Chemical Logistics Market," which aids in identifying and referencing the specific market segment covered.
12. How do I determine which pricing option suits my needs best?
The pricing options vary based on user requirements and access needs. Individual users may opt for single-user licenses, while businesses requiring broader access may choose multi-user or enterprise licenses for cost-effective access to the report.
13. Are there any additional resources or data provided in the Global Chemical Logistics Market report?
While the report offers comprehensive insights, it's advisable to review the specific contents or supplementary materials provided to ascertain if additional resources or data are available.
14. How can I stay updated on further developments or reports in the Global Chemical Logistics Market?
To stay informed about further developments, trends, and reports in the Global Chemical Logistics Market, consider subscribing to industry newsletters, following relevant companies and organizations, or regularly checking reputable industry news sources and publications.
Methodology
Step 1 - Identification of Relevant Samples Size from Population Database


Step 2 - Approaches for Defining Global Market Size (Value, Volume* & Price*)

Note*: In applicable scenarios
Step 3 - Data Sources
Primary Research
- Web Analytics
- Survey Reports
- Research Institute
- Latest Research Reports
- Opinion Leaders
Secondary Research
- Annual Reports
- White Paper
- Latest Press Release
- Industry Association
- Paid Database
- Investor Presentations

Step 4 - Data Triangulation
Involves using different sources of information in order to increase the validity of a study
These sources are likely to be stakeholders in a program - participants, other researchers, program staff, other community members, and so on.
Then we put all data in single framework & apply various statistical tools to find out the dynamic on the market.
During the analysis stage, feedback from the stakeholder groups would be compared to determine areas of agreement as well as areas of divergence