

Key Insights
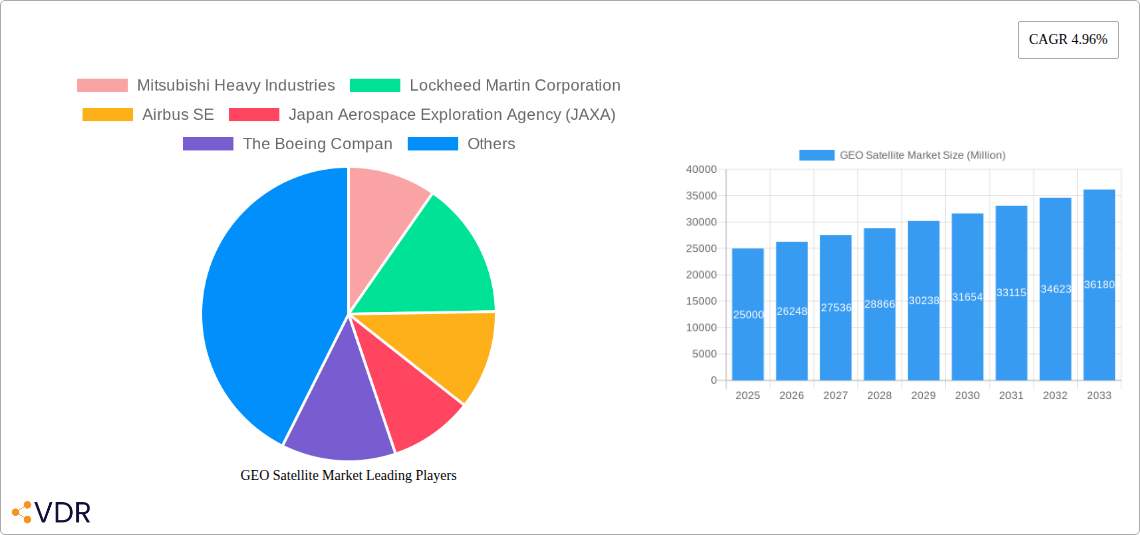
The Geostationary Earth Orbit (GEO) satellite market is experiencing robust growth, driven by increasing demand for communication, navigation, and earth observation services globally. A 4.96% CAGR from 2019-2033 indicates a significant expansion, fueled by the proliferation of high-bandwidth applications like broadband internet access, high-definition television broadcasting, and advanced meteorological forecasting. The market is segmented by satellite mass (10-100kg, 100-500kg, 500-1000kg, and above 1000kg), application (communication, earth observation, navigation, space observation, and others), end-user (commercial, military & government, and others), and propulsion technology (electric, gas-based, and liquid fuel). The largest segment is likely communication satellites, owing to the substantial investments in global broadband infrastructure and the expanding role of satellites in delivering internet connectivity, especially in remote areas. Technological advancements in electric propulsion systems are contributing to cost reduction and extended satellite lifespan, further bolstering market growth. Competition is fierce, with major players like Lockheed Martin, Airbus, Boeing, and several national space agencies actively involved in manufacturing, launching, and operating GEO satellites. Government initiatives promoting space exploration and national security further drive market expansion.
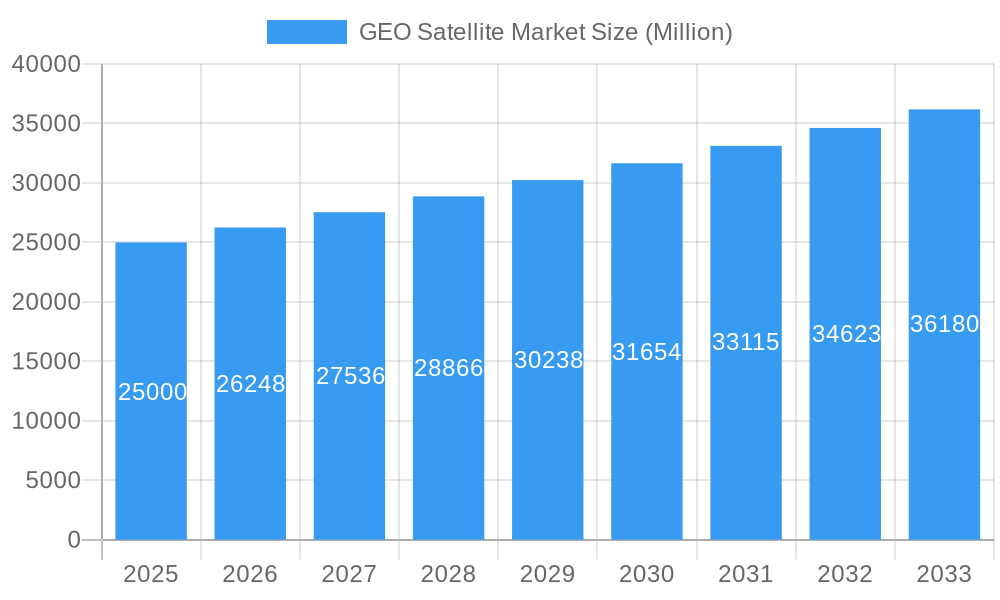
GEO Satellite Market Market Size (In Billion)
The substantial investment in research and development of advanced satellite technologies, coupled with the increasing reliance on satellite-based solutions for diverse applications, signifies a bright outlook for the GEO satellite market. While potential restraints include the high initial investment costs associated with satellite development and launch, the long-term benefits and return on investment are attractive to both commercial and government entities. The shift toward miniaturized satellites and improved propulsion technologies could mitigate cost concerns, contributing to greater market accessibility. Further segmentation within the market will likely emerge as technology evolves, creating niche opportunities for specialized satellite services and applications. The geographic distribution of market share is anticipated to be skewed towards developed nations initially, but emerging economies are expected to show significant growth as their infrastructure requirements and technological capabilities increase.
GEO Satellite Market Company Market Share
GEO Satellite Market Report: 2019-2033
This comprehensive report provides a detailed analysis of the global GEO Satellite Market, encompassing its dynamics, growth trends, key players, and future outlook. The study period covers 2019-2033, with 2025 as the base year and a forecast period of 2025-2033. The report segments the market by application, satellite mass, end-user, and propulsion technology, providing granular insights into market size and growth across different regions and countries. The report is invaluable for industry professionals, investors, and strategists seeking to understand and capitalize on the opportunities within this dynamic sector. The market is expected to reach xx Million units by 2033.
GEO Satellite Market Dynamics & Structure
The GEO satellite market is characterized by moderate concentration, with key players holding significant market shares. Technological innovation, particularly in propulsion systems and satellite miniaturization, are key drivers. Stringent regulatory frameworks, particularly concerning spectrum allocation and orbital slots, influence market dynamics. While there are limited direct substitutes for GEO satellites in certain applications, terrestrial and non-geostationary satellite technologies pose some competitive pressure. End-user demographics are diverse, ranging from commercial entities to governments and military organizations. M&A activity has been relatively frequent, particularly amongst companies seeking to expand capabilities or acquire valuable assets.
- Market Concentration: Moderately concentrated, with top 5 players holding approximately xx% of the market share in 2025.
- Technological Innovation: Miniaturization, improved propulsion efficiency, and advanced payloads are driving growth.
- Regulatory Frameworks: Strict regulations surrounding spectrum allocation and orbital slots impact market entry and expansion.
- Competitive Substitutes: Terrestrial communication networks and LEO/MEO satellite constellations provide some level of substitution.
- M&A Trends: Moderate levels of M&A activity, driven by strategic acquisitions and technology integration. xx major M&A deals recorded between 2019 and 2024.
- Innovation Barriers: High R&D costs, complex regulatory approvals, and long lead times for satellite development.
GEO Satellite Market Growth Trends & Insights
The GEO satellite market experienced significant growth during the historical period (2019-2024), driven by increasing demand for communication services, enhanced earth observation capabilities, and the expansion of navigation systems. The market is expected to continue its growth trajectory during the forecast period (2025-2033), albeit at a slightly moderated rate compared to previous years. Technological advancements such as the development of high-throughput satellites and improved propulsion systems are key growth drivers. Furthermore, the rising adoption of GEO satellites across various applications, particularly in emerging economies, is bolstering market expansion. Consumer behavior shifts towards increased reliance on data-intensive applications, such as video streaming and cloud computing, are indirectly fueling demand.
- Market Size Evolution: The market size increased from xx Million units in 2019 to xx Million units in 2024, exhibiting a CAGR of xx%.
- Adoption Rates: Adoption rates are increasing across multiple sectors, particularly in developing nations experiencing rapid infrastructural development.
- Technological Disruptions: High-throughput satellites and electric propulsion systems are revolutionizing the industry, increasing efficiency and reducing operational costs.
- Consumer Behavior Shifts: Increased demand for high-bandwidth applications drives the need for advanced satellite technologies.
Dominant Regions, Countries, or Segments in GEO Satellite Market
North America and Europe currently dominate the GEO satellite market, driven by robust government investment in space programs and the presence of major industry players. However, the Asia-Pacific region is projected to witness substantial growth in the coming years, fueled by increasing government spending on space technology and rising demand for communication services. Within the segments, the Communication applications segment dominates, accounting for the largest market share owing to the widespread use of GEO satellites in broadcasting, telecom, and internet access. Similarly, larger satellite mass categories (above 1000kg) are more prevalent due to their capability to carry heavier payloads and provide greater functionality. The commercial end-user segment is a key driver for growth.
- Leading Region: North America holds the largest market share in 2025, followed by Europe and Asia-Pacific.
- Key Country Drivers: The U.S., U.K., China, Japan, and India are significant contributors to market growth.
- Dominant Application Segment: Communication applications holds the largest market share, owing to high demand for broadcasting, telecom, and internet services.
- Dominant Satellite Mass Segment: Above 1000kg segment dominates due to capacity and functionality.
- Dominant End-User Segment: The commercial sector is the largest contributor, followed by military & government.
- Growth Drivers: Government investments in space exploration, increasing demand for broadband, and rising adoption in developing markets.
GEO Satellite Market Product Landscape
The GEO satellite market features a diverse range of products, ranging from simple communication satellites to sophisticated multi-mission platforms. Recent innovations focus on improving satellite efficiency, extending lifespan, and enhancing payload capabilities. High-throughput satellites (HTS) are becoming increasingly prevalent, offering greater bandwidth and capacity. Electric propulsion systems are also gaining traction, offering improved fuel efficiency and longer mission durations. Unique selling propositions include enhanced payload capacity, improved data transmission rates, and reduced operational costs.
Key Drivers, Barriers & Challenges in GEO Satellite Market
Key Drivers: The increasing demand for high-bandwidth communication services, particularly for broadband access in remote areas, is a primary driver. Government initiatives promoting space exploration and technological advancements in satellite technology also contribute to growth. The rising adoption of GEO satellites for earth observation and navigation applications further fuels market expansion.
Key Challenges: High initial investment costs associated with satellite development and launch are significant barriers. The limited availability of orbital slots and stringent regulatory frameworks pose challenges for market entry and expansion. Competition from other satellite technologies (e.g., LEO constellations) also presents a challenge. Supply chain disruptions can impact the timely delivery of satellites. Estimated xx% of projects face delays due to supply chain constraints.
Emerging Opportunities in GEO Satellite Market
Emerging opportunities exist in the provision of high-bandwidth internet access to underserved populations, the expansion of earth observation applications for environmental monitoring and disaster management, and the development of next-generation navigation systems. The integration of AI and machine learning capabilities into satellite systems offers potential for improved efficiency and operational performance.
Growth Accelerators in the GEO Satellite Market Industry
Technological advancements such as the development of high-throughput satellites, electric propulsion systems, and advanced payload technologies are crucial growth catalysts. Strategic partnerships between satellite manufacturers, launch providers, and telecommunication operators create synergies that expedite market expansion. Investments in research and development and policies supporting the space industry further stimulate growth.
Key Players Shaping the GEO Satellite Market Market
- Mitsubishi Heavy Industries
- Lockheed Martin Corporation (Lockheed Martin)
- Airbus SE (Airbus)
- Japan Aerospace Exploration Agency (JAXA)
- The Boeing Company (Boeing)
- China Aerospace Science and Technology Corporation (CASC)
- Thales (Thales)
- Maxar Technologies Inc (Maxar Technologies)
- Northrop Grumman Corporation (Northrop Grumman)
- Indian Space Research Organisation (ISRO)
Notable Milestones in GEO Satellite Market Sector
- February 2023: China launched the Zhongxing-26 communications satellite, expected to be used for military purposes. This signifies China's growing capabilities in satellite technology and its potential impact on the global geopolitical landscape.
- January 2023: Airbus secured a contract from Inmarsat to build a geostationary telecommunications satellite (I-6 F2). This highlights the continued demand for high-capacity communication satellites.
- December 2022: Airbus successfully completed the System Critical Design Review for the EGNOS V3 satellite-based augmentation system. This marks a significant step towards improving the accuracy and reliability of navigation systems in Europe.
In-Depth GEO Satellite Market Market Outlook
The GEO satellite market is poised for continued growth, driven by technological advancements, increasing demand for high-bandwidth communication, and expansion into new applications. Strategic partnerships and investments in research and development will play a vital role in shaping the future of this market. The market is projected to see continued expansion, with opportunities for innovation and market consolidation. The development of next-generation satellites and enhanced services will be key drivers of future growth.
GEO Satellite Market Segmentation
-
1. Application
- 1.1. Communication
- 1.2. Earth Observation
- 1.3. Navigation
- 1.4. Space Observation
- 1.5. Others
-
2. Satellite Mass
- 2.1. 10-100kg
- 2.2. 100-500kg
- 2.3. 500-1000kg
- 2.4. above 1000kg
-
3. End User
- 3.1. Commercial
- 3.2. Military & Government
- 3.3. Other
-
4. Propulsion Tech
- 4.1. Electric
- 4.2. Gas based
- 4.3. Liquid Fuel
GEO Satellite Market Segmentation By Geography
-
1. North America
- 1.1. United States
- 1.2. Canada
- 1.3. Mexico
-
2. South America
- 2.1. Brazil
- 2.2. Argentina
- 2.3. Rest of South America
-
3. Europe
- 3.1. United Kingdom
- 3.2. Germany
- 3.3. France
- 3.4. Italy
- 3.5. Spain
- 3.6. Russia
- 3.7. Benelux
- 3.8. Nordics
- 3.9. Rest of Europe
-
4. Middle East & Africa
- 4.1. Turkey
- 4.2. Israel
- 4.3. GCC
- 4.4. North Africa
- 4.5. South Africa
- 4.6. Rest of Middle East & Africa
-
5. Asia Pacific
- 5.1. China
- 5.2. India
- 5.3. Japan
- 5.4. South Korea
- 5.5. ASEAN
- 5.6. Oceania
- 5.7. Rest of Asia Pacific
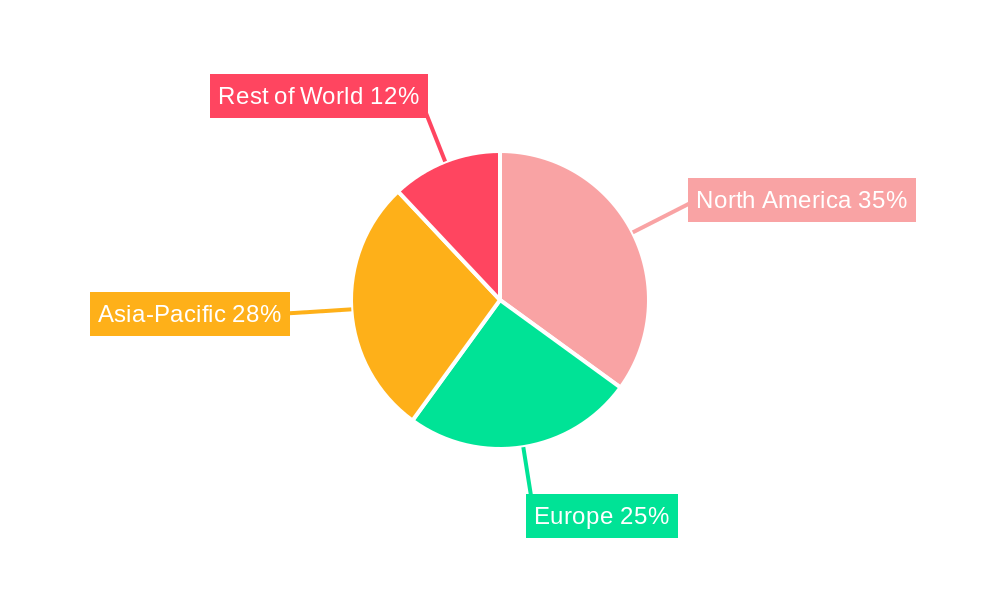
GEO Satellite Market Regional Market Share
Geographic Coverage of GEO Satellite Market
GEO Satellite Market REPORT HIGHLIGHTS
| Aspects | Details |
|---|---|
| Study Period | 2020-2034 |
| Base Year | 2025 |
| Estimated Year | 2026 |
| Forecast Period | 2026-2034 |
| Historical Period | 2020-2025 |
| Growth Rate | CAGR of 18.1% from 2020-2034 |
| Segmentation |
|
Table of Contents
- 1. Introduction
- 1.1. Research Scope
- 1.2. Market Segmentation
- 1.3. Research Objective
- 1.4. Definitions and Assumptions
- 2. Executive Summary
- 2.1. Market Snapshot
- 3. Market Dynamics
- 3.1. Market Drivers
- 3.2. Market Restrains
- 3.3. Market Trends
- 3.4. Market Opportunities
- 4. Market Factor Analysis
- 4.1. Porters Five Forces
- 4.1.1. Bargaining Power of Suppliers
- 4.1.2. Bargaining Power of Buyers
- 4.1.3. Threat of New Entrants
- 4.1.4. Threat of Substitutes
- 4.1.5. Competitive Rivalry
- 4.2. PESTEL analysis
- 4.3. BCG Analysis
- 4.3.1. Stars (High Growth, High Market Share)
- 4.3.2. Cash Cows (Low Growth, High Market Share)
- 4.3.3. Question Mark (High Growth, Low Market Share)
- 4.3.4. Dogs (Low Growth, Low Market Share)
- 4.4. Ansoff Matrix Analysis
- 4.5. Supply Chain Analysis
- 4.6. Regulatory Landscape
- 4.7. Current Market Potential and Opportunity Assessment (TAM–SAM–SOM Framework)
- 4.8. VDR Analyst Note
- 4.1. Porters Five Forces
- 5. Market Analysis, Insights and Forecast 2021-2033
- 5.1. Market Analysis, Insights and Forecast - by Application
- 5.1.1. Communication
- 5.1.2. Earth Observation
- 5.1.3. Navigation
- 5.1.4. Space Observation
- 5.1.5. Others
- 5.2. Market Analysis, Insights and Forecast - by Satellite Mass
- 5.2.1. 10-100kg
- 5.2.2. 100-500kg
- 5.2.3. 500-1000kg
- 5.2.4. above 1000kg
- 5.3. Market Analysis, Insights and Forecast - by End User
- 5.3.1. Commercial
- 5.3.2. Military & Government
- 5.3.3. Other
- 5.4. Market Analysis, Insights and Forecast - by Propulsion Tech
- 5.4.1. Electric
- 5.4.2. Gas based
- 5.4.3. Liquid Fuel
- 5.5. Market Analysis, Insights and Forecast - by Region
- 5.5.1. North America
- 5.5.2. South America
- 5.5.3. Europe
- 5.5.4. Middle East & Africa
- 5.5.5. Asia Pacific
- 5.1. Market Analysis, Insights and Forecast - by Application
- 6. Global GEO Satellite Market Analysis, Insights and Forecast, 2021-2033
- 6.1. Market Analysis, Insights and Forecast - by Application
- 6.1.1. Communication
- 6.1.2. Earth Observation
- 6.1.3. Navigation
- 6.1.4. Space Observation
- 6.1.5. Others
- 6.2. Market Analysis, Insights and Forecast - by Satellite Mass
- 6.2.1. 10-100kg
- 6.2.2. 100-500kg
- 6.2.3. 500-1000kg
- 6.2.4. above 1000kg
- 6.3. Market Analysis, Insights and Forecast - by End User
- 6.3.1. Commercial
- 6.3.2. Military & Government
- 6.3.3. Other
- 6.4. Market Analysis, Insights and Forecast - by Propulsion Tech
- 6.4.1. Electric
- 6.4.2. Gas based
- 6.4.3. Liquid Fuel
- 6.1. Market Analysis, Insights and Forecast - by Application
- 7. North America GEO Satellite Market Analysis, Insights and Forecast, 2021-2033
- 7.1. Market Analysis, Insights and Forecast - by Application
- 7.1.1. Communication
- 7.1.2. Earth Observation
- 7.1.3. Navigation
- 7.1.4. Space Observation
- 7.1.5. Others
- 7.2. Market Analysis, Insights and Forecast - by Satellite Mass
- 7.2.1. 10-100kg
- 7.2.2. 100-500kg
- 7.2.3. 500-1000kg
- 7.2.4. above 1000kg
- 7.3. Market Analysis, Insights and Forecast - by End User
- 7.3.1. Commercial
- 7.3.2. Military & Government
- 7.3.3. Other
- 7.4. Market Analysis, Insights and Forecast - by Propulsion Tech
- 7.4.1. Electric
- 7.4.2. Gas based
- 7.4.3. Liquid Fuel
- 7.1. Market Analysis, Insights and Forecast - by Application
- 8. South America GEO Satellite Market Analysis, Insights and Forecast, 2021-2033
- 8.1. Market Analysis, Insights and Forecast - by Application
- 8.1.1. Communication
- 8.1.2. Earth Observation
- 8.1.3. Navigation
- 8.1.4. Space Observation
- 8.1.5. Others
- 8.2. Market Analysis, Insights and Forecast - by Satellite Mass
- 8.2.1. 10-100kg
- 8.2.2. 100-500kg
- 8.2.3. 500-1000kg
- 8.2.4. above 1000kg
- 8.3. Market Analysis, Insights and Forecast - by End User
- 8.3.1. Commercial
- 8.3.2. Military & Government
- 8.3.3. Other
- 8.4. Market Analysis, Insights and Forecast - by Propulsion Tech
- 8.4.1. Electric
- 8.4.2. Gas based
- 8.4.3. Liquid Fuel
- 8.1. Market Analysis, Insights and Forecast - by Application
- 9. Europe GEO Satellite Market Analysis, Insights and Forecast, 2021-2033
- 9.1. Market Analysis, Insights and Forecast - by Application
- 9.1.1. Communication
- 9.1.2. Earth Observation
- 9.1.3. Navigation
- 9.1.4. Space Observation
- 9.1.5. Others
- 9.2. Market Analysis, Insights and Forecast - by Satellite Mass
- 9.2.1. 10-100kg
- 9.2.2. 100-500kg
- 9.2.3. 500-1000kg
- 9.2.4. above 1000kg
- 9.3. Market Analysis, Insights and Forecast - by End User
- 9.3.1. Commercial
- 9.3.2. Military & Government
- 9.3.3. Other
- 9.4. Market Analysis, Insights and Forecast - by Propulsion Tech
- 9.4.1. Electric
- 9.4.2. Gas based
- 9.4.3. Liquid Fuel
- 9.1. Market Analysis, Insights and Forecast - by Application
- 10. Middle East & Africa GEO Satellite Market Analysis, Insights and Forecast, 2021-2033
- 10.1. Market Analysis, Insights and Forecast - by Application
- 10.1.1. Communication
- 10.1.2. Earth Observation
- 10.1.3. Navigation
- 10.1.4. Space Observation
- 10.1.5. Others
- 10.2. Market Analysis, Insights and Forecast - by Satellite Mass
- 10.2.1. 10-100kg
- 10.2.2. 100-500kg
- 10.2.3. 500-1000kg
- 10.2.4. above 1000kg
- 10.3. Market Analysis, Insights and Forecast - by End User
- 10.3.1. Commercial
- 10.3.2. Military & Government
- 10.3.3. Other
- 10.4. Market Analysis, Insights and Forecast - by Propulsion Tech
- 10.4.1. Electric
- 10.4.2. Gas based
- 10.4.3. Liquid Fuel
- 10.1. Market Analysis, Insights and Forecast - by Application
- 11. Asia Pacific GEO Satellite Market Analysis, Insights and Forecast, 2021-2033
- 11.1. Market Analysis, Insights and Forecast - by Application
- 11.1.1. Communication
- 11.1.2. Earth Observation
- 11.1.3. Navigation
- 11.1.4. Space Observation
- 11.1.5. Others
- 11.2. Market Analysis, Insights and Forecast - by Satellite Mass
- 11.2.1. 10-100kg
- 11.2.2. 100-500kg
- 11.2.3. 500-1000kg
- 11.2.4. above 1000kg
- 11.3. Market Analysis, Insights and Forecast - by End User
- 11.3.1. Commercial
- 11.3.2. Military & Government
- 11.3.3. Other
- 11.4. Market Analysis, Insights and Forecast - by Propulsion Tech
- 11.4.1. Electric
- 11.4.2. Gas based
- 11.4.3. Liquid Fuel
- 11.1. Market Analysis, Insights and Forecast - by Application
- 12. Competitive Analysis
- 12.1. Company Profiles
- 12.1.1 Mitsubishi Heavy Industries
- 12.1.1.1. Company Overview
- 12.1.1.2. Products
- 12.1.1.3. Company Financials
- 12.1.1.4. SWOT Analysis
- 12.1.2 Lockheed Martin Corporation
- 12.1.2.1. Company Overview
- 12.1.2.2. Products
- 12.1.2.3. Company Financials
- 12.1.2.4. SWOT Analysis
- 12.1.3 Airbus SE
- 12.1.3.1. Company Overview
- 12.1.3.2. Products
- 12.1.3.3. Company Financials
- 12.1.3.4. SWOT Analysis
- 12.1.4 Japan Aerospace Exploration Agency (JAXA)
- 12.1.4.1. Company Overview
- 12.1.4.2. Products
- 12.1.4.3. Company Financials
- 12.1.4.4. SWOT Analysis
- 12.1.5 The Boeing Compan
- 12.1.5.1. Company Overview
- 12.1.5.2. Products
- 12.1.5.3. Company Financials
- 12.1.5.4. SWOT Analysis
- 12.1.6 China Aerospace Science and Technology Corporation (CASC)
- 12.1.6.1. Company Overview
- 12.1.6.2. Products
- 12.1.6.3. Company Financials
- 12.1.6.4. SWOT Analysis
- 12.1.7 Thales
- 12.1.7.1. Company Overview
- 12.1.7.2. Products
- 12.1.7.3. Company Financials
- 12.1.7.4. SWOT Analysis
- 12.1.8 Maxar Technologies Inc
- 12.1.8.1. Company Overview
- 12.1.8.2. Products
- 12.1.8.3. Company Financials
- 12.1.8.4. SWOT Analysis
- 12.1.9 Northrop Grumman Corporation
- 12.1.9.1. Company Overview
- 12.1.9.2. Products
- 12.1.9.3. Company Financials
- 12.1.9.4. SWOT Analysis
- 12.1.10 Indian Space Research Organisation (ISRO)
- 12.1.10.1. Company Overview
- 12.1.10.2. Products
- 12.1.10.3. Company Financials
- 12.1.10.4. SWOT Analysis
- 12.1.1 Mitsubishi Heavy Industries
- 12.2. Market Entropy
- 12.2.1 Company's Key Areas Served
- 12.2.2 Recent Developments
- 12.3. Company Market Share Analysis 2025
- 12.3.1 Top 5 Companies Market Share Analysis
- 12.3.2 Top 3 Companies Market Share Analysis
- 12.4. List of Potential Customers
- 13. Research Methodology
List of Figures
- Figure 1: Global GEO Satellite Market Revenue Breakdown (billion, %) by Region 2025 & 2033
- Figure 2: North America GEO Satellite Market Revenue (billion), by Application 2025 & 2033
- Figure 3: North America GEO Satellite Market Revenue Share (%), by Application 2025 & 2033
- Figure 4: North America GEO Satellite Market Revenue (billion), by Satellite Mass 2025 & 2033
- Figure 5: North America GEO Satellite Market Revenue Share (%), by Satellite Mass 2025 & 2033
- Figure 6: North America GEO Satellite Market Revenue (billion), by End User 2025 & 2033
- Figure 7: North America GEO Satellite Market Revenue Share (%), by End User 2025 & 2033
- Figure 8: North America GEO Satellite Market Revenue (billion), by Propulsion Tech 2025 & 2033
- Figure 9: North America GEO Satellite Market Revenue Share (%), by Propulsion Tech 2025 & 2033
- Figure 10: North America GEO Satellite Market Revenue (billion), by Country 2025 & 2033
- Figure 11: North America GEO Satellite Market Revenue Share (%), by Country 2025 & 2033
- Figure 12: South America GEO Satellite Market Revenue (billion), by Application 2025 & 2033
- Figure 13: South America GEO Satellite Market Revenue Share (%), by Application 2025 & 2033
- Figure 14: South America GEO Satellite Market Revenue (billion), by Satellite Mass 2025 & 2033
- Figure 15: South America GEO Satellite Market Revenue Share (%), by Satellite Mass 2025 & 2033
- Figure 16: South America GEO Satellite Market Revenue (billion), by End User 2025 & 2033
- Figure 17: South America GEO Satellite Market Revenue Share (%), by End User 2025 & 2033
- Figure 18: South America GEO Satellite Market Revenue (billion), by Propulsion Tech 2025 & 2033
- Figure 19: South America GEO Satellite Market Revenue Share (%), by Propulsion Tech 2025 & 2033
- Figure 20: South America GEO Satellite Market Revenue (billion), by Country 2025 & 2033
- Figure 21: South America GEO Satellite Market Revenue Share (%), by Country 2025 & 2033
- Figure 22: Europe GEO Satellite Market Revenue (billion), by Application 2025 & 2033
- Figure 23: Europe GEO Satellite Market Revenue Share (%), by Application 2025 & 2033
- Figure 24: Europe GEO Satellite Market Revenue (billion), by Satellite Mass 2025 & 2033
- Figure 25: Europe GEO Satellite Market Revenue Share (%), by Satellite Mass 2025 & 2033
- Figure 26: Europe GEO Satellite Market Revenue (billion), by End User 2025 & 2033
- Figure 27: Europe GEO Satellite Market Revenue Share (%), by End User 2025 & 2033
- Figure 28: Europe GEO Satellite Market Revenue (billion), by Propulsion Tech 2025 & 2033
- Figure 29: Europe GEO Satellite Market Revenue Share (%), by Propulsion Tech 2025 & 2033
- Figure 30: Europe GEO Satellite Market Revenue (billion), by Country 2025 & 2033
- Figure 31: Europe GEO Satellite Market Revenue Share (%), by Country 2025 & 2033
- Figure 32: Middle East & Africa GEO Satellite Market Revenue (billion), by Application 2025 & 2033
- Figure 33: Middle East & Africa GEO Satellite Market Revenue Share (%), by Application 2025 & 2033
- Figure 34: Middle East & Africa GEO Satellite Market Revenue (billion), by Satellite Mass 2025 & 2033
- Figure 35: Middle East & Africa GEO Satellite Market Revenue Share (%), by Satellite Mass 2025 & 2033
- Figure 36: Middle East & Africa GEO Satellite Market Revenue (billion), by End User 2025 & 2033
- Figure 37: Middle East & Africa GEO Satellite Market Revenue Share (%), by End User 2025 & 2033
- Figure 38: Middle East & Africa GEO Satellite Market Revenue (billion), by Propulsion Tech 2025 & 2033
- Figure 39: Middle East & Africa GEO Satellite Market Revenue Share (%), by Propulsion Tech 2025 & 2033
- Figure 40: Middle East & Africa GEO Satellite Market Revenue (billion), by Country 2025 & 2033
- Figure 41: Middle East & Africa GEO Satellite Market Revenue Share (%), by Country 2025 & 2033
- Figure 42: Asia Pacific GEO Satellite Market Revenue (billion), by Application 2025 & 2033
- Figure 43: Asia Pacific GEO Satellite Market Revenue Share (%), by Application 2025 & 2033
- Figure 44: Asia Pacific GEO Satellite Market Revenue (billion), by Satellite Mass 2025 & 2033
- Figure 45: Asia Pacific GEO Satellite Market Revenue Share (%), by Satellite Mass 2025 & 2033
- Figure 46: Asia Pacific GEO Satellite Market Revenue (billion), by End User 2025 & 2033
- Figure 47: Asia Pacific GEO Satellite Market Revenue Share (%), by End User 2025 & 2033
- Figure 48: Asia Pacific GEO Satellite Market Revenue (billion), by Propulsion Tech 2025 & 2033
- Figure 49: Asia Pacific GEO Satellite Market Revenue Share (%), by Propulsion Tech 2025 & 2033
- Figure 50: Asia Pacific GEO Satellite Market Revenue (billion), by Country 2025 & 2033
- Figure 51: Asia Pacific GEO Satellite Market Revenue Share (%), by Country 2025 & 2033
List of Tables
- Table 1: Global GEO Satellite Market Revenue billion Forecast, by Application 2020 & 2033
- Table 2: Global GEO Satellite Market Revenue billion Forecast, by Satellite Mass 2020 & 2033
- Table 3: Global GEO Satellite Market Revenue billion Forecast, by End User 2020 & 2033
- Table 4: Global GEO Satellite Market Revenue billion Forecast, by Propulsion Tech 2020 & 2033
- Table 5: Global GEO Satellite Market Revenue billion Forecast, by Region 2020 & 2033
- Table 6: Global GEO Satellite Market Revenue billion Forecast, by Application 2020 & 2033
- Table 7: Global GEO Satellite Market Revenue billion Forecast, by Satellite Mass 2020 & 2033
- Table 8: Global GEO Satellite Market Revenue billion Forecast, by End User 2020 & 2033
- Table 9: Global GEO Satellite Market Revenue billion Forecast, by Propulsion Tech 2020 & 2033
- Table 10: Global GEO Satellite Market Revenue billion Forecast, by Country 2020 & 2033
- Table 11: United States GEO Satellite Market Revenue (billion) Forecast, by Application 2020 & 2033
- Table 12: Canada GEO Satellite Market Revenue (billion) Forecast, by Application 2020 & 2033
- Table 13: Mexico GEO Satellite Market Revenue (billion) Forecast, by Application 2020 & 2033
- Table 14: Global GEO Satellite Market Revenue billion Forecast, by Application 2020 & 2033
- Table 15: Global GEO Satellite Market Revenue billion Forecast, by Satellite Mass 2020 & 2033
- Table 16: Global GEO Satellite Market Revenue billion Forecast, by End User 2020 & 2033
- Table 17: Global GEO Satellite Market Revenue billion Forecast, by Propulsion Tech 2020 & 2033
- Table 18: Global GEO Satellite Market Revenue billion Forecast, by Country 2020 & 2033
- Table 19: Brazil GEO Satellite Market Revenue (billion) Forecast, by Application 2020 & 2033
- Table 20: Argentina GEO Satellite Market Revenue (billion) Forecast, by Application 2020 & 2033
- Table 21: Rest of South America GEO Satellite Market Revenue (billion) Forecast, by Application 2020 & 2033
- Table 22: Global GEO Satellite Market Revenue billion Forecast, by Application 2020 & 2033
- Table 23: Global GEO Satellite Market Revenue billion Forecast, by Satellite Mass 2020 & 2033
- Table 24: Global GEO Satellite Market Revenue billion Forecast, by End User 2020 & 2033
- Table 25: Global GEO Satellite Market Revenue billion Forecast, by Propulsion Tech 2020 & 2033
- Table 26: Global GEO Satellite Market Revenue billion Forecast, by Country 2020 & 2033
- Table 27: United Kingdom GEO Satellite Market Revenue (billion) Forecast, by Application 2020 & 2033
- Table 28: Germany GEO Satellite Market Revenue (billion) Forecast, by Application 2020 & 2033
- Table 29: France GEO Satellite Market Revenue (billion) Forecast, by Application 2020 & 2033
- Table 30: Italy GEO Satellite Market Revenue (billion) Forecast, by Application 2020 & 2033
- Table 31: Spain GEO Satellite Market Revenue (billion) Forecast, by Application 2020 & 2033
- Table 32: Russia GEO Satellite Market Revenue (billion) Forecast, by Application 2020 & 2033
- Table 33: Benelux GEO Satellite Market Revenue (billion) Forecast, by Application 2020 & 2033
- Table 34: Nordics GEO Satellite Market Revenue (billion) Forecast, by Application 2020 & 2033
- Table 35: Rest of Europe GEO Satellite Market Revenue (billion) Forecast, by Application 2020 & 2033
- Table 36: Global GEO Satellite Market Revenue billion Forecast, by Application 2020 & 2033
- Table 37: Global GEO Satellite Market Revenue billion Forecast, by Satellite Mass 2020 & 2033
- Table 38: Global GEO Satellite Market Revenue billion Forecast, by End User 2020 & 2033
- Table 39: Global GEO Satellite Market Revenue billion Forecast, by Propulsion Tech 2020 & 2033
- Table 40: Global GEO Satellite Market Revenue billion Forecast, by Country 2020 & 2033
- Table 41: Turkey GEO Satellite Market Revenue (billion) Forecast, by Application 2020 & 2033
- Table 42: Israel GEO Satellite Market Revenue (billion) Forecast, by Application 2020 & 2033
- Table 43: GCC GEO Satellite Market Revenue (billion) Forecast, by Application 2020 & 2033
- Table 44: North Africa GEO Satellite Market Revenue (billion) Forecast, by Application 2020 & 2033
- Table 45: South Africa GEO Satellite Market Revenue (billion) Forecast, by Application 2020 & 2033
- Table 46: Rest of Middle East & Africa GEO Satellite Market Revenue (billion) Forecast, by Application 2020 & 2033
- Table 47: Global GEO Satellite Market Revenue billion Forecast, by Application 2020 & 2033
- Table 48: Global GEO Satellite Market Revenue billion Forecast, by Satellite Mass 2020 & 2033
- Table 49: Global GEO Satellite Market Revenue billion Forecast, by End User 2020 & 2033
- Table 50: Global GEO Satellite Market Revenue billion Forecast, by Propulsion Tech 2020 & 2033
- Table 51: Global GEO Satellite Market Revenue billion Forecast, by Country 2020 & 2033
- Table 52: China GEO Satellite Market Revenue (billion) Forecast, by Application 2020 & 2033
- Table 53: India GEO Satellite Market Revenue (billion) Forecast, by Application 2020 & 2033
- Table 54: Japan GEO Satellite Market Revenue (billion) Forecast, by Application 2020 & 2033
- Table 55: South Korea GEO Satellite Market Revenue (billion) Forecast, by Application 2020 & 2033
- Table 56: ASEAN GEO Satellite Market Revenue (billion) Forecast, by Application 2020 & 2033
- Table 57: Oceania GEO Satellite Market Revenue (billion) Forecast, by Application 2020 & 2033
- Table 58: Rest of Asia Pacific GEO Satellite Market Revenue (billion) Forecast, by Application 2020 & 2033
Frequently Asked Questions
1. What is the projected Compound Annual Growth Rate (CAGR) of the GEO Satellite Market?
The projected CAGR is approximately 18.1%.
2. Which companies are prominent players in the GEO Satellite Market?
Key companies in the market include Mitsubishi Heavy Industries, Lockheed Martin Corporation, Airbus SE, Japan Aerospace Exploration Agency (JAXA), The Boeing Compan, China Aerospace Science and Technology Corporation (CASC), Thales, Maxar Technologies Inc, Northrop Grumman Corporation, Indian Space Research Organisation (ISRO).
3. What are the main segments of the GEO Satellite Market?
The market segments include Application, Satellite Mass, End User, Propulsion Tech.
4. Can you provide details about the market size?
The market size is estimated to be USD 14.56 billion as of 2022.
5. What are some drivers contributing to market growth?
N/A
6. What are the notable trends driving market growth?
Liquid fuel propulsion is expected to surge during the forecast period.
7. Are there any restraints impacting market growth?
N/A
8. Can you provide examples of recent developments in the market?
February 2023: China sent the Zhongxing-26 communications satellite into orbit,it is expected to be a military satelliteJanuary 2023: Airbus was awarded to build a geostationary telecommunications satellite by Inmarsat. The Airbus-built Inmarsat-6 telecommunications satellite (I-6 F2) has brought on board an Airbus Beluga at the Kennedy Space Center in Florida ready for its launch in February 2023.December 2022: Airbus has successfully achieved the System Critical Design Review on the EGNOS V3 (European Geostationary Navigation Overlay Service) satellite-based augmentation system. The new V3 generation of EGNOS being developed by Airbus will introduce new services based on multiple frequencies of multiple constellations (GPS, Galileo), and will embed sophisticated security protection against cyber-attacks.
9. What pricing options are available for accessing the report?
Pricing options include single-user, multi-user, and enterprise licenses priced at USD 3800, USD 4500, and USD 5800 respectively.
10. Is the market size provided in terms of value or volume?
The market size is provided in terms of value, measured in billion.
11. Are there any specific market keywords associated with the report?
Yes, the market keyword associated with the report is "GEO Satellite Market," which aids in identifying and referencing the specific market segment covered.
12. How do I determine which pricing option suits my needs best?
The pricing options vary based on user requirements and access needs. Individual users may opt for single-user licenses, while businesses requiring broader access may choose multi-user or enterprise licenses for cost-effective access to the report.
13. Are there any additional resources or data provided in the GEO Satellite Market report?
While the report offers comprehensive insights, it's advisable to review the specific contents or supplementary materials provided to ascertain if additional resources or data are available.
14. How can I stay updated on further developments or reports in the GEO Satellite Market?
To stay informed about further developments, trends, and reports in the GEO Satellite Market, consider subscribing to industry newsletters, following relevant companies and organizations, or regularly checking reputable industry news sources and publications.
Methodology
Step 1 - Identification of Relevant Samples Size from Population Database


Step 2 - Approaches for Defining Global Market Size (Value, Volume* & Price*)

Note*: In applicable scenarios
Step 3 - Data Sources
Primary Research
- Web Analytics
- Survey Reports
- Research Institute
- Latest Research Reports
- Opinion Leaders
Secondary Research
- Annual Reports
- White Paper
- Latest Press Release
- Industry Association
- Paid Database
- Investor Presentations

Step 4 - Data Triangulation
Involves using different sources of information in order to increase the validity of a study
These sources are likely to be stakeholders in a program - participants, other researchers, program staff, other community members, and so on.
Then we put all data in single framework & apply various statistical tools to find out the dynamic on the market.
During the analysis stage, feedback from the stakeholder groups would be compared to determine areas of agreement as well as areas of divergence