

Key Insights
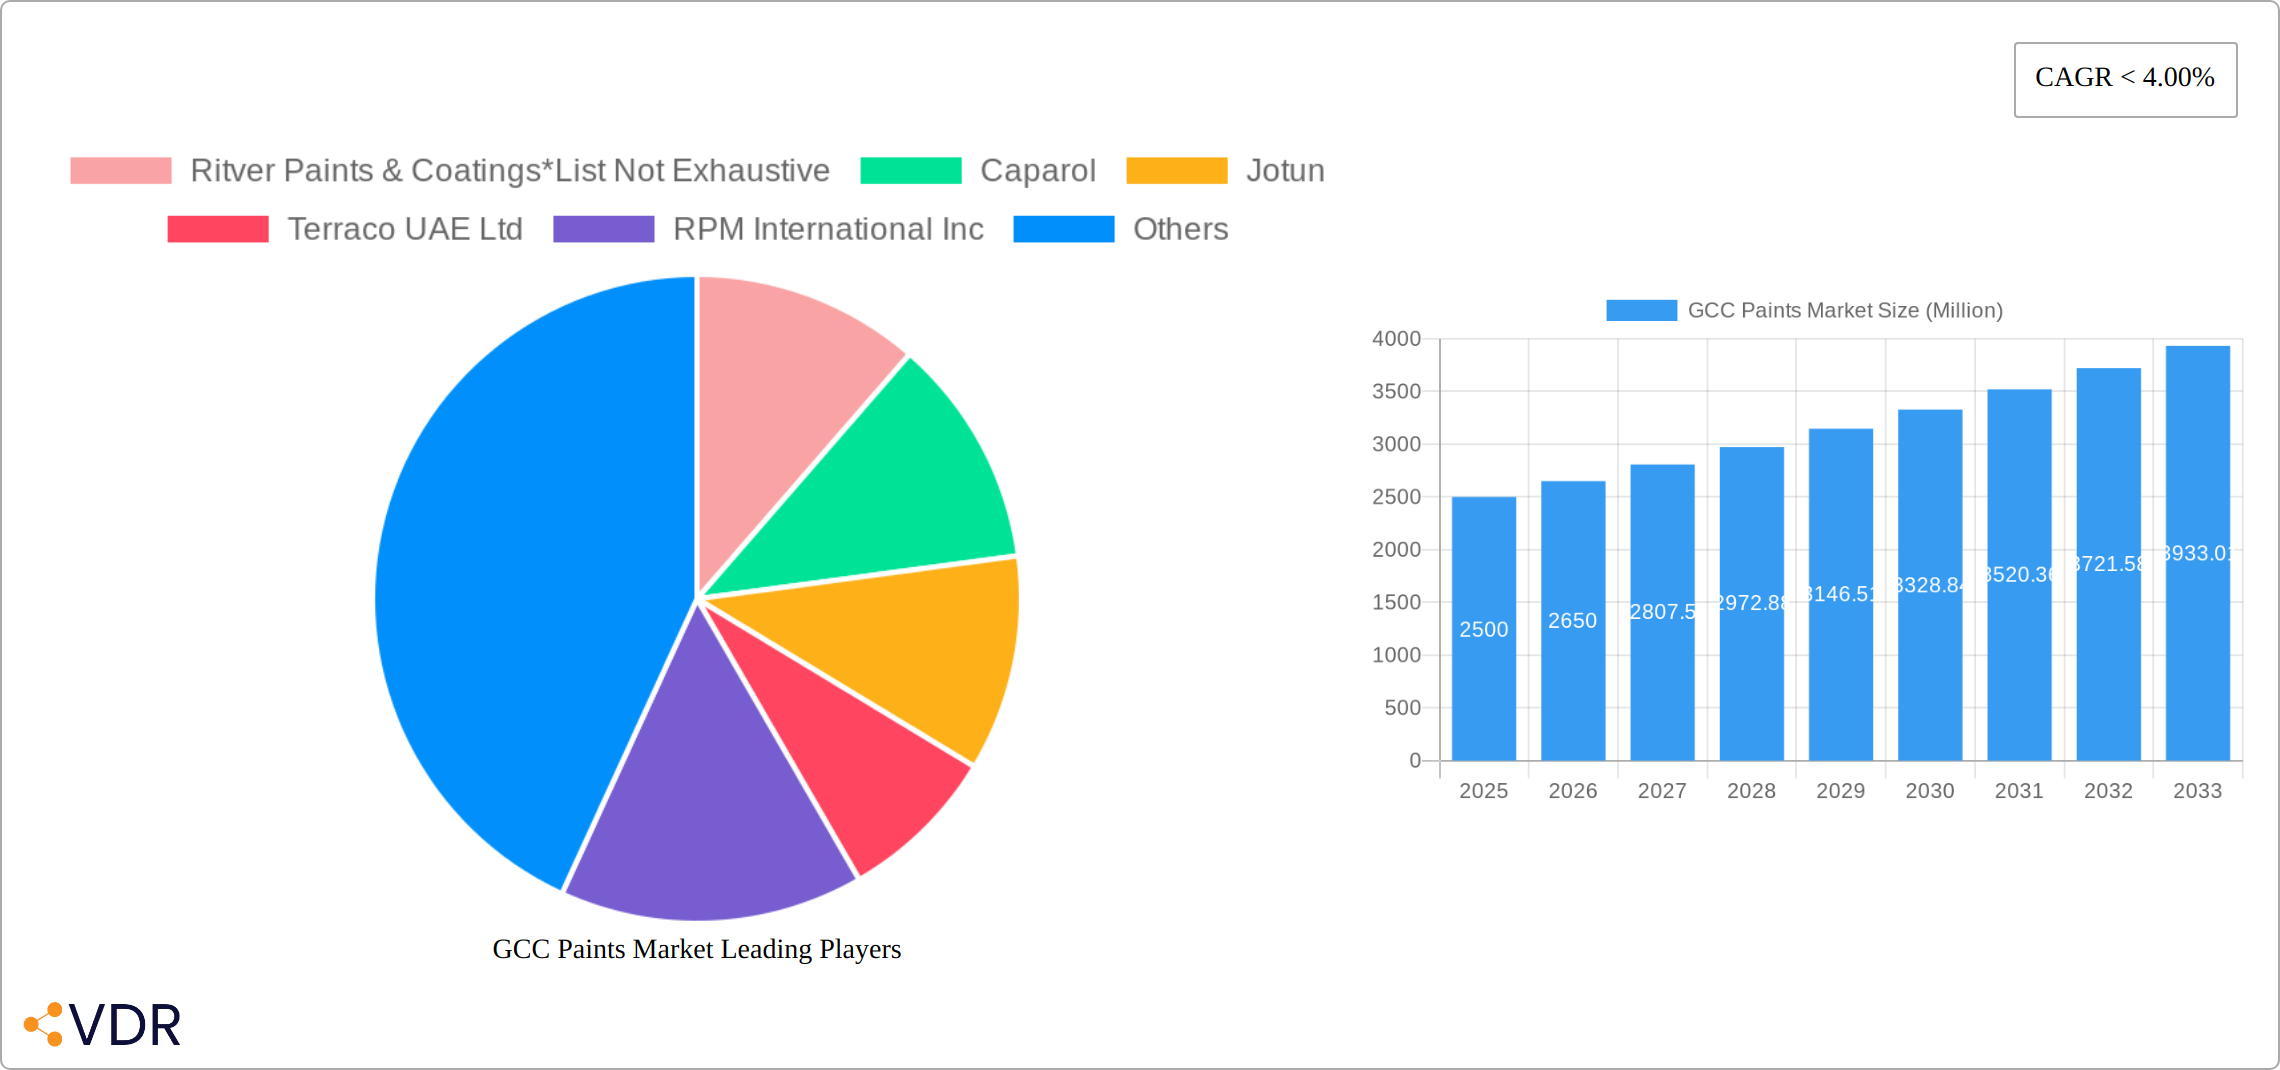
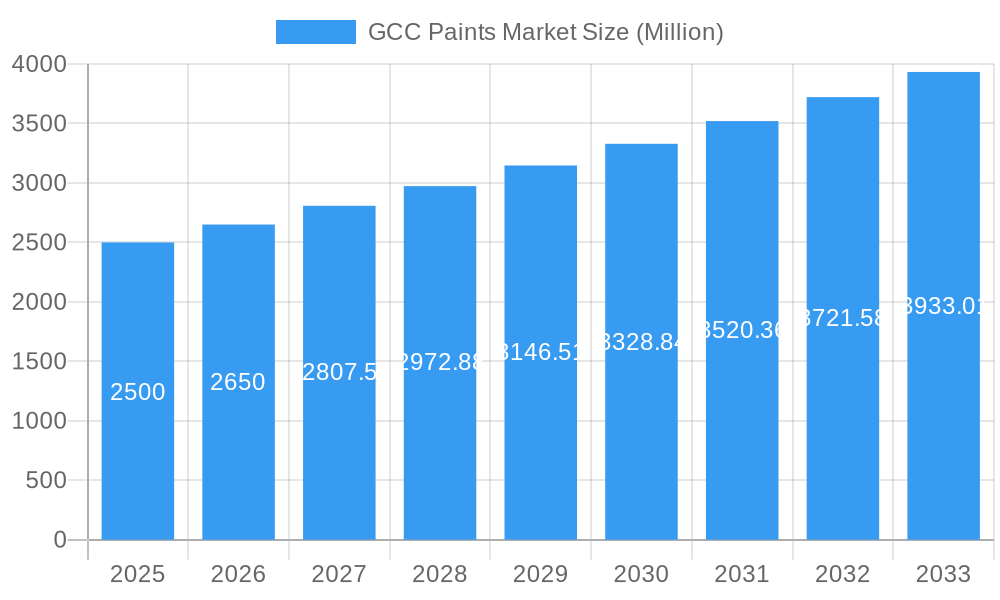
The Gulf Cooperation Council (GCC) paints market is poised for substantial growth from 2025 to 2033, propelled by extensive construction projects and significant infrastructure development. Key growth drivers include a growing population, rapid urbanization, and an expanding middle class, which collectively increase demand for high-quality residential and commercial paints. Government investments in large-scale tourism and economic diversification initiatives further bolster market expansion. The estimated market size for 2025 is $2.5 billion, reflecting a strong upward trend from 2019. The market features a competitive landscape with both international and local manufacturers, offering a diverse product range. Innovations in paint technology, emphasizing durability, eco-friendliness, and specialized finishes, are driving premium segment growth. The projected Compound Annual Growth Rate (CAGR) indicates sustained market expansion throughout the forecast period, supported by ongoing economic growth and infrastructure investments within the GCC.
GCC Paints Market Market Size (In Billion)
The forecast period of 2025-2033 anticipates sustained expansion, driven by the GCC's ongoing economic diversification away from oil, continuous population growth, and urbanization. Increased adoption of sustainable and eco-friendly paint solutions, influenced by environmental regulations and heightened consumer awareness, will also contribute to market growth. A robust CAGR is projected, mirroring the ongoing construction boom and government priorities in infrastructure and housing development. The competitive environment will remain dynamic, with industry players focusing on research and development to introduce innovative, high-performance paints tailored to the GCC's specific climatic conditions and architectural styles.
GCC Paints Market Company Market Share
GCC Paints Market: A Comprehensive Report (2019-2033)
This in-depth report provides a comprehensive analysis of the GCC paints market, offering valuable insights for industry professionals, investors, and stakeholders. The study covers the historical period (2019-2024), base year (2025), and forecast period (2025-2033), presenting a detailed overview of market dynamics, growth trends, and future prospects. The report segments the market by resin type (Acrylic, Alkyd, Polyurethane, Epoxy, Polyester, Other Resin Types), technology (Water-borne, Solvent-borne, Radiation Cure, Other Technologies), and end-user industry (Architectural, Automotive, Wood, Industrial Coatings, Transportation, Packaging). Market size is presented in million units.
GCC Paints Market Dynamics & Structure
The GCC paints market is characterized by a moderately concentrated landscape, with key players vying for market share through product innovation and strategic partnerships. Technological advancements, particularly in water-borne and eco-friendly paints, are driving market growth. Stringent environmental regulations are shaping product formulations and manufacturing processes. The market witnesses significant competition from substitute products, like wallpapers and other decorative materials. End-user demographics, with a growing construction sector and increasing disposable incomes, influence demand. The market has experienced a moderate level of mergers and acquisitions (M&A) activity in recent years.
- Market Concentration: Moderately concentrated, with top 5 players holding xx% market share in 2025 (estimated).
- Technological Innovation: Focus on sustainable, high-performance paints with reduced VOC emissions.
- Regulatory Framework: Stringent environmental regulations impacting product formulations.
- Competitive Substitutes: Growing competition from alternative decorative materials.
- End-user Demographics: Rapid urbanization and construction activity driving demand.
- M&A Activity: xx M&A deals recorded between 2019-2024, with an estimated xx deals predicted for 2025-2033.
GCC Paints Market Growth Trends & Insights
The GCC paints market exhibited robust growth during the historical period (2019-2024), driven by a surge in construction activities and infrastructure development across the region. The market is expected to maintain a steady growth trajectory during the forecast period (2025-2033), fueled by sustained economic growth and rising consumer spending. Technological advancements, such as the increasing adoption of water-borne paints due to their environmental benefits, are shaping market dynamics. Consumer preferences are shifting towards high-performance, aesthetically pleasing, and sustainable paint solutions.
- Market Size (Million Units): 2019: xx; 2024: xx; 2025 (Estimated): xx; 2033 (Forecast): xx
- CAGR (2025-2033): xx%
- Market Penetration: xx% in 2025 (estimated), projected to reach xx% by 2033.
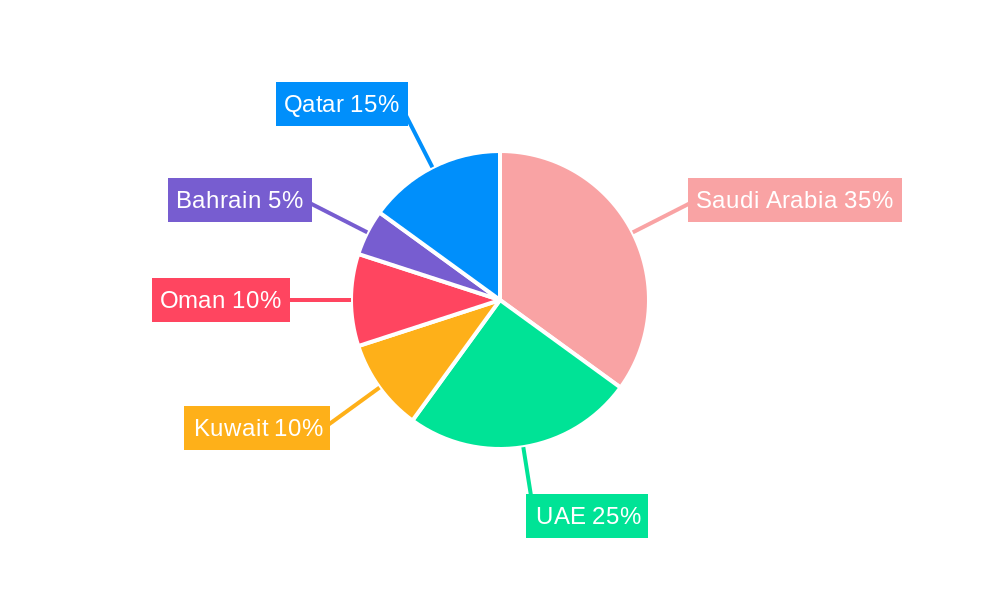
Dominant Regions, Countries, or Segments in GCC Paints Market
The GCC paints market is significantly shaped by its diverse segments and regional variations. The architectural coatings segment remains dominant, fueled by the region's robust construction boom and large-scale infrastructure projects. This is particularly evident in leading national markets like Saudi Arabia and the UAE, where substantial economic growth and ongoing development initiatives drive significant demand. Within the resin types, acrylic paints maintain the largest market share, prized for their versatility, durability, and cost-effectiveness. However, water-borne paints are experiencing considerable growth, driven by increasing environmental concerns and their superior performance characteristics. The market also sees increasing demand for specialized coatings catering to unique climatic conditions and construction practices within the GCC.
- Leading Segment: Architectural Coatings (driven by construction and infrastructure projects)
- Leading Countries: Saudi Arabia and the UAE (reflecting high economic activity and development)
- Leading Resin Type: Acrylic (due to versatility, durability, and cost-effectiveness)
- Leading Technology: Water-borne (growing due to environmental benefits and performance)
GCC Paints Market Product Landscape
The GCC paints market presents a dynamic product landscape characterized by a wide array of coatings for diverse applications. Innovation is a key driver, with a focus on enhanced durability, improved aesthetics, and environmental sustainability. This includes specialized coatings engineered to withstand the region's extreme weather conditions, as well as fire-retardant and antimicrobial paints. These specialized products cater to the unique needs and challenges presented by the GCC's climate and construction practices. Competitive differentiation is achieved through superior performance characteristics, ease of application, and the promise of long-term value, emphasizing cost-effectiveness and return on investment for consumers.
Key Drivers, Barriers & Challenges in GCC Paints Market
Key Drivers:
- Robust Construction & Infrastructure: Significant investment in construction and infrastructure projects across the GCC fuels high demand for paints.
- Rising Disposable Incomes: Increased consumer spending power translates into greater demand for high-quality paints and coatings for both residential and commercial applications.
- Government Support for Sustainability: Government initiatives promoting sustainable building practices drive demand for eco-friendly paint options.
- Demand for High-Performance Coatings: Consumers increasingly seek paints that offer superior durability, aesthetic appeal, and long-term value.
Challenges & Restraints:
- Raw Material Price Volatility: Fluctuations in global raw material prices impact production costs and profitability.
- Stringent Environmental Regulations: Compliance with increasingly stringent environmental regulations necessitates investments in sustainable technologies.
- Intense Competition: The market is characterized by intense competition among both established multinational corporations and emerging regional players.
- Supply Chain Disruptions: Geopolitical events and global supply chain issues can create disruptions in the availability of raw materials and finished products.
Emerging Opportunities in GCC Paints Market
- Growing demand for eco-friendly and sustainable paints
- Expanding applications in specialized sectors like marine and protective coatings
- Opportunities in the renovation and refurbishment market
- Potential for market expansion into smaller GCC countries
Growth Accelerators in the GCC Paints Market Industry
Technological breakthroughs in paint formulations and application techniques are key growth catalysts. Strategic partnerships and collaborations among paint manufacturers, raw material suppliers, and technology providers are driving innovation and market expansion. The focus on sustainable and eco-friendly paints aligns with regional environmental initiatives, creating further growth opportunities.
Key Players Shaping the GCC Paints Market Market
- Ritver Paints & Coatings List Not Exhaustive
- Caparol
- Jotun
- Terraco UAE Ltd
- RPM International Inc
- Thermalite Middle East
- Akzo Nobel NV
- Jazeera Paints
- PPG Industries Inc
- Beckers Group
- Asian Paints Berger
- BASF SE
- Hempel A/S
- National Paints Factories Co Ltd
- Premier Paints Company Limited (The Sherwin-Williams Company)
- Wacker Chemie AG
Notable Milestones in GCC Paints Market Sector
- 2021: Jotun launched a new range of sustainable paints, highlighting a growing market trend.
- 2022: Asian Paints Berger's acquisition of a local UAE paint manufacturer signifies consolidation within the market.
- 2023: The implementation of new regulations regarding VOC emissions in Saudi Arabia underscores the increasing focus on environmental sustainability.
- 2024: BASF SE's investment in a new paint manufacturing facility demonstrates confidence in the long-term growth potential of the GCC paints market.
In-Depth GCC Paints Market Market Outlook
The GCC paints market exhibits strong potential for continued growth, driven by the region's ongoing infrastructure development, sustained economic expansion, and rising consumer preference for high-quality, eco-friendly coatings. Strategic investments in research and development, along with the introduction of innovative products, will further enhance market dynamics. Significant opportunities exist for businesses to capitalize on emerging trends, including the growing demand for specialized coatings designed for specific applications and the increasing adoption of eco-friendly and sustainable paint formulations. Market players who effectively adapt to evolving regulations and consumer preferences are well-positioned for success in this dynamic market.
GCC Paints Market Segmentation
-
1. Resin Type
- 1.1. Acrylic
- 1.2. Alkyd
- 1.3. Polyurethane
- 1.4. Epoxy
- 1.5. Polyester
- 1.6. Other Resin Types
-
2. Technology
- 2.1. Water-borne
- 2.2. Solvent-borne
- 2.3. Radiation Cure
- 2.4. Other Technologies
-
3. End-user Industry
- 3.1. Architectural
- 3.2. Automotive
- 3.3. Wood
- 3.4. Industrial Coatings
- 3.5. Transportation
- 3.6. Packaging
-
4. Geography
- 4.1. Saudi Arabia
- 4.2. Qatar
- 4.3. Kuwait
- 4.4. United Arab Emirates
- 4.5. Bahrain
- 4.6. Oman
GCC Paints Market Segmentation By Geography
- 1. Saudi Arabia
- 2. Qatar
- 3. Kuwait
- 4. United Arab Emirates
- 5. Bahrain
- 6. Oman
GCC Paints Market Regional Market Share
Geographic Coverage of GCC Paints Market
GCC Paints Market REPORT HIGHLIGHTS
| Aspects | Details |
|---|---|
| Study Period | 2020-2034 |
| Base Year | 2025 |
| Estimated Year | 2026 |
| Forecast Period | 2026-2034 |
| Historical Period | 2020-2025 |
| Growth Rate | CAGR of 6% from 2020-2034 |
| Segmentation |
|
Table of Contents
- 1. Introduction
- 1.1. Research Scope
- 1.2. Market Segmentation
- 1.3. Research Methodology
- 1.4. Definitions and Assumptions
- 2. Executive Summary
- 2.1. Introduction
- 3. Market Dynamics
- 3.1. Introduction
- 3.2. Market Drivers
- 3.2.1. ; Increased Focus on Tourism and Construction; Other Drivers
- 3.3. Market Restrains
- 3.3.1. Slowdown in Automotive Industry
- 3.4. Market Trends
- 3.4.1. Solvent-borne Technology to Witness the Highest Growth Rate
- 4. Market Factor Analysis
- 4.1. Porters Five Forces
- 4.2. Supply/Value Chain
- 4.3. PESTEL analysis
- 4.4. Market Entropy
- 4.5. Patent/Trademark Analysis
- 5. Global GCC Paints Market Analysis, Insights and Forecast, 2020-2032
- 5.1. Market Analysis, Insights and Forecast - by Resin Type
- 5.1.1. Acrylic
- 5.1.2. Alkyd
- 5.1.3. Polyurethane
- 5.1.4. Epoxy
- 5.1.5. Polyester
- 5.1.6. Other Resin Types
- 5.2. Market Analysis, Insights and Forecast - by Technology
- 5.2.1. Water-borne
- 5.2.2. Solvent-borne
- 5.2.3. Radiation Cure
- 5.2.4. Other Technologies
- 5.3. Market Analysis, Insights and Forecast - by End-user Industry
- 5.3.1. Architectural
- 5.3.2. Automotive
- 5.3.3. Wood
- 5.3.4. Industrial Coatings
- 5.3.5. Transportation
- 5.3.6. Packaging
- 5.4. Market Analysis, Insights and Forecast - by Geography
- 5.4.1. Saudi Arabia
- 5.4.2. Qatar
- 5.4.3. Kuwait
- 5.4.4. United Arab Emirates
- 5.4.5. Bahrain
- 5.4.6. Oman
- 5.5. Market Analysis, Insights and Forecast - by Region
- 5.5.1. Saudi Arabia
- 5.5.2. Qatar
- 5.5.3. Kuwait
- 5.5.4. United Arab Emirates
- 5.5.5. Bahrain
- 5.5.6. Oman
- 5.1. Market Analysis, Insights and Forecast - by Resin Type
- 6. Saudi Arabia GCC Paints Market Analysis, Insights and Forecast, 2020-2032
- 6.1. Market Analysis, Insights and Forecast - by Resin Type
- 6.1.1. Acrylic
- 6.1.2. Alkyd
- 6.1.3. Polyurethane
- 6.1.4. Epoxy
- 6.1.5. Polyester
- 6.1.6. Other Resin Types
- 6.2. Market Analysis, Insights and Forecast - by Technology
- 6.2.1. Water-borne
- 6.2.2. Solvent-borne
- 6.2.3. Radiation Cure
- 6.2.4. Other Technologies
- 6.3. Market Analysis, Insights and Forecast - by End-user Industry
- 6.3.1. Architectural
- 6.3.2. Automotive
- 6.3.3. Wood
- 6.3.4. Industrial Coatings
- 6.3.5. Transportation
- 6.3.6. Packaging
- 6.4. Market Analysis, Insights and Forecast - by Geography
- 6.4.1. Saudi Arabia
- 6.4.2. Qatar
- 6.4.3. Kuwait
- 6.4.4. United Arab Emirates
- 6.4.5. Bahrain
- 6.4.6. Oman
- 6.1. Market Analysis, Insights and Forecast - by Resin Type
- 7. Qatar GCC Paints Market Analysis, Insights and Forecast, 2020-2032
- 7.1. Market Analysis, Insights and Forecast - by Resin Type
- 7.1.1. Acrylic
- 7.1.2. Alkyd
- 7.1.3. Polyurethane
- 7.1.4. Epoxy
- 7.1.5. Polyester
- 7.1.6. Other Resin Types
- 7.2. Market Analysis, Insights and Forecast - by Technology
- 7.2.1. Water-borne
- 7.2.2. Solvent-borne
- 7.2.3. Radiation Cure
- 7.2.4. Other Technologies
- 7.3. Market Analysis, Insights and Forecast - by End-user Industry
- 7.3.1. Architectural
- 7.3.2. Automotive
- 7.3.3. Wood
- 7.3.4. Industrial Coatings
- 7.3.5. Transportation
- 7.3.6. Packaging
- 7.4. Market Analysis, Insights and Forecast - by Geography
- 7.4.1. Saudi Arabia
- 7.4.2. Qatar
- 7.4.3. Kuwait
- 7.4.4. United Arab Emirates
- 7.4.5. Bahrain
- 7.4.6. Oman
- 7.1. Market Analysis, Insights and Forecast - by Resin Type
- 8. Kuwait GCC Paints Market Analysis, Insights and Forecast, 2020-2032
- 8.1. Market Analysis, Insights and Forecast - by Resin Type
- 8.1.1. Acrylic
- 8.1.2. Alkyd
- 8.1.3. Polyurethane
- 8.1.4. Epoxy
- 8.1.5. Polyester
- 8.1.6. Other Resin Types
- 8.2. Market Analysis, Insights and Forecast - by Technology
- 8.2.1. Water-borne
- 8.2.2. Solvent-borne
- 8.2.3. Radiation Cure
- 8.2.4. Other Technologies
- 8.3. Market Analysis, Insights and Forecast - by End-user Industry
- 8.3.1. Architectural
- 8.3.2. Automotive
- 8.3.3. Wood
- 8.3.4. Industrial Coatings
- 8.3.5. Transportation
- 8.3.6. Packaging
- 8.4. Market Analysis, Insights and Forecast - by Geography
- 8.4.1. Saudi Arabia
- 8.4.2. Qatar
- 8.4.3. Kuwait
- 8.4.4. United Arab Emirates
- 8.4.5. Bahrain
- 8.4.6. Oman
- 8.1. Market Analysis, Insights and Forecast - by Resin Type
- 9. United Arab Emirates GCC Paints Market Analysis, Insights and Forecast, 2020-2032
- 9.1. Market Analysis, Insights and Forecast - by Resin Type
- 9.1.1. Acrylic
- 9.1.2. Alkyd
- 9.1.3. Polyurethane
- 9.1.4. Epoxy
- 9.1.5. Polyester
- 9.1.6. Other Resin Types
- 9.2. Market Analysis, Insights and Forecast - by Technology
- 9.2.1. Water-borne
- 9.2.2. Solvent-borne
- 9.2.3. Radiation Cure
- 9.2.4. Other Technologies
- 9.3. Market Analysis, Insights and Forecast - by End-user Industry
- 9.3.1. Architectural
- 9.3.2. Automotive
- 9.3.3. Wood
- 9.3.4. Industrial Coatings
- 9.3.5. Transportation
- 9.3.6. Packaging
- 9.4. Market Analysis, Insights and Forecast - by Geography
- 9.4.1. Saudi Arabia
- 9.4.2. Qatar
- 9.4.3. Kuwait
- 9.4.4. United Arab Emirates
- 9.4.5. Bahrain
- 9.4.6. Oman
- 9.1. Market Analysis, Insights and Forecast - by Resin Type
- 10. Bahrain GCC Paints Market Analysis, Insights and Forecast, 2020-2032
- 10.1. Market Analysis, Insights and Forecast - by Resin Type
- 10.1.1. Acrylic
- 10.1.2. Alkyd
- 10.1.3. Polyurethane
- 10.1.4. Epoxy
- 10.1.5. Polyester
- 10.1.6. Other Resin Types
- 10.2. Market Analysis, Insights and Forecast - by Technology
- 10.2.1. Water-borne
- 10.2.2. Solvent-borne
- 10.2.3. Radiation Cure
- 10.2.4. Other Technologies
- 10.3. Market Analysis, Insights and Forecast - by End-user Industry
- 10.3.1. Architectural
- 10.3.2. Automotive
- 10.3.3. Wood
- 10.3.4. Industrial Coatings
- 10.3.5. Transportation
- 10.3.6. Packaging
- 10.4. Market Analysis, Insights and Forecast - by Geography
- 10.4.1. Saudi Arabia
- 10.4.2. Qatar
- 10.4.3. Kuwait
- 10.4.4. United Arab Emirates
- 10.4.5. Bahrain
- 10.4.6. Oman
- 10.1. Market Analysis, Insights and Forecast - by Resin Type
- 11. Oman GCC Paints Market Analysis, Insights and Forecast, 2020-2032
- 11.1. Market Analysis, Insights and Forecast - by Resin Type
- 11.1.1. Acrylic
- 11.1.2. Alkyd
- 11.1.3. Polyurethane
- 11.1.4. Epoxy
- 11.1.5. Polyester
- 11.1.6. Other Resin Types
- 11.2. Market Analysis, Insights and Forecast - by Technology
- 11.2.1. Water-borne
- 11.2.2. Solvent-borne
- 11.2.3. Radiation Cure
- 11.2.4. Other Technologies
- 11.3. Market Analysis, Insights and Forecast - by End-user Industry
- 11.3.1. Architectural
- 11.3.2. Automotive
- 11.3.3. Wood
- 11.3.4. Industrial Coatings
- 11.3.5. Transportation
- 11.3.6. Packaging
- 11.4. Market Analysis, Insights and Forecast - by Geography
- 11.4.1. Saudi Arabia
- 11.4.2. Qatar
- 11.4.3. Kuwait
- 11.4.4. United Arab Emirates
- 11.4.5. Bahrain
- 11.4.6. Oman
- 11.1. Market Analysis, Insights and Forecast - by Resin Type
- 12. Competitive Analysis
- 12.1. Global Market Share Analysis 2025
- 12.2. Company Profiles
- 12.2.1 Ritver Paints & Coatings*List Not Exhaustive
- 12.2.1.1. Overview
- 12.2.1.2. Products
- 12.2.1.3. SWOT Analysis
- 12.2.1.4. Recent Developments
- 12.2.1.5. Financials (Based on Availability)
- 12.2.2 Caparol
- 12.2.2.1. Overview
- 12.2.2.2. Products
- 12.2.2.3. SWOT Analysis
- 12.2.2.4. Recent Developments
- 12.2.2.5. Financials (Based on Availability)
- 12.2.3 Jotun
- 12.2.3.1. Overview
- 12.2.3.2. Products
- 12.2.3.3. SWOT Analysis
- 12.2.3.4. Recent Developments
- 12.2.3.5. Financials (Based on Availability)
- 12.2.4 Terraco UAE Ltd
- 12.2.4.1. Overview
- 12.2.4.2. Products
- 12.2.4.3. SWOT Analysis
- 12.2.4.4. Recent Developments
- 12.2.4.5. Financials (Based on Availability)
- 12.2.5 RPM International Inc
- 12.2.5.1. Overview
- 12.2.5.2. Products
- 12.2.5.3. SWOT Analysis
- 12.2.5.4. Recent Developments
- 12.2.5.5. Financials (Based on Availability)
- 12.2.6 Thermalite Middle East
- 12.2.6.1. Overview
- 12.2.6.2. Products
- 12.2.6.3. SWOT Analysis
- 12.2.6.4. Recent Developments
- 12.2.6.5. Financials (Based on Availability)
- 12.2.7 Akzo Nobel NV
- 12.2.7.1. Overview
- 12.2.7.2. Products
- 12.2.7.3. SWOT Analysis
- 12.2.7.4. Recent Developments
- 12.2.7.5. Financials (Based on Availability)
- 12.2.8 Jazeera Paints
- 12.2.8.1. Overview
- 12.2.8.2. Products
- 12.2.8.3. SWOT Analysis
- 12.2.8.4. Recent Developments
- 12.2.8.5. Financials (Based on Availability)
- 12.2.9 PPG Industries Inc
- 12.2.9.1. Overview
- 12.2.9.2. Products
- 12.2.9.3. SWOT Analysis
- 12.2.9.4. Recent Developments
- 12.2.9.5. Financials (Based on Availability)
- 12.2.10 Beckers Group
- 12.2.10.1. Overview
- 12.2.10.2. Products
- 12.2.10.3. SWOT Analysis
- 12.2.10.4. Recent Developments
- 12.2.10.5. Financials (Based on Availability)
- 12.2.11 Asian Paints Berger
- 12.2.11.1. Overview
- 12.2.11.2. Products
- 12.2.11.3. SWOT Analysis
- 12.2.11.4. Recent Developments
- 12.2.11.5. Financials (Based on Availability)
- 12.2.12 BASF SE
- 12.2.12.1. Overview
- 12.2.12.2. Products
- 12.2.12.3. SWOT Analysis
- 12.2.12.4. Recent Developments
- 12.2.12.5. Financials (Based on Availability)
- 12.2.13 Hempel A/S
- 12.2.13.1. Overview
- 12.2.13.2. Products
- 12.2.13.3. SWOT Analysis
- 12.2.13.4. Recent Developments
- 12.2.13.5. Financials (Based on Availability)
- 12.2.14 National Paints Factories Co Ltd
- 12.2.14.1. Overview
- 12.2.14.2. Products
- 12.2.14.3. SWOT Analysis
- 12.2.14.4. Recent Developments
- 12.2.14.5. Financials (Based on Availability)
- 12.2.15 Premier Paints Company Limited (The Sherwin-Williams Company)
- 12.2.15.1. Overview
- 12.2.15.2. Products
- 12.2.15.3. SWOT Analysis
- 12.2.15.4. Recent Developments
- 12.2.15.5. Financials (Based on Availability)
- 12.2.16 Wacker Chemie AG
- 12.2.16.1. Overview
- 12.2.16.2. Products
- 12.2.16.3. SWOT Analysis
- 12.2.16.4. Recent Developments
- 12.2.16.5. Financials (Based on Availability)
- 12.2.1 Ritver Paints & Coatings*List Not Exhaustive
List of Figures
- Figure 1: Global GCC Paints Market Revenue Breakdown (billion, %) by Region 2025 & 2033
- Figure 2: Global GCC Paints Market Volume Breakdown (liter , %) by Region 2025 & 2033
- Figure 3: Saudi Arabia GCC Paints Market Revenue (billion), by Resin Type 2025 & 2033
- Figure 4: Saudi Arabia GCC Paints Market Volume (liter ), by Resin Type 2025 & 2033
- Figure 5: Saudi Arabia GCC Paints Market Revenue Share (%), by Resin Type 2025 & 2033
- Figure 6: Saudi Arabia GCC Paints Market Volume Share (%), by Resin Type 2025 & 2033
- Figure 7: Saudi Arabia GCC Paints Market Revenue (billion), by Technology 2025 & 2033
- Figure 8: Saudi Arabia GCC Paints Market Volume (liter ), by Technology 2025 & 2033
- Figure 9: Saudi Arabia GCC Paints Market Revenue Share (%), by Technology 2025 & 2033
- Figure 10: Saudi Arabia GCC Paints Market Volume Share (%), by Technology 2025 & 2033
- Figure 11: Saudi Arabia GCC Paints Market Revenue (billion), by End-user Industry 2025 & 2033
- Figure 12: Saudi Arabia GCC Paints Market Volume (liter ), by End-user Industry 2025 & 2033
- Figure 13: Saudi Arabia GCC Paints Market Revenue Share (%), by End-user Industry 2025 & 2033
- Figure 14: Saudi Arabia GCC Paints Market Volume Share (%), by End-user Industry 2025 & 2033
- Figure 15: Saudi Arabia GCC Paints Market Revenue (billion), by Geography 2025 & 2033
- Figure 16: Saudi Arabia GCC Paints Market Volume (liter ), by Geography 2025 & 2033
- Figure 17: Saudi Arabia GCC Paints Market Revenue Share (%), by Geography 2025 & 2033
- Figure 18: Saudi Arabia GCC Paints Market Volume Share (%), by Geography 2025 & 2033
- Figure 19: Saudi Arabia GCC Paints Market Revenue (billion), by Country 2025 & 2033
- Figure 20: Saudi Arabia GCC Paints Market Volume (liter ), by Country 2025 & 2033
- Figure 21: Saudi Arabia GCC Paints Market Revenue Share (%), by Country 2025 & 2033
- Figure 22: Saudi Arabia GCC Paints Market Volume Share (%), by Country 2025 & 2033
- Figure 23: Qatar GCC Paints Market Revenue (billion), by Resin Type 2025 & 2033
- Figure 24: Qatar GCC Paints Market Volume (liter ), by Resin Type 2025 & 2033
- Figure 25: Qatar GCC Paints Market Revenue Share (%), by Resin Type 2025 & 2033
- Figure 26: Qatar GCC Paints Market Volume Share (%), by Resin Type 2025 & 2033
- Figure 27: Qatar GCC Paints Market Revenue (billion), by Technology 2025 & 2033
- Figure 28: Qatar GCC Paints Market Volume (liter ), by Technology 2025 & 2033
- Figure 29: Qatar GCC Paints Market Revenue Share (%), by Technology 2025 & 2033
- Figure 30: Qatar GCC Paints Market Volume Share (%), by Technology 2025 & 2033
- Figure 31: Qatar GCC Paints Market Revenue (billion), by End-user Industry 2025 & 2033
- Figure 32: Qatar GCC Paints Market Volume (liter ), by End-user Industry 2025 & 2033
- Figure 33: Qatar GCC Paints Market Revenue Share (%), by End-user Industry 2025 & 2033
- Figure 34: Qatar GCC Paints Market Volume Share (%), by End-user Industry 2025 & 2033
- Figure 35: Qatar GCC Paints Market Revenue (billion), by Geography 2025 & 2033
- Figure 36: Qatar GCC Paints Market Volume (liter ), by Geography 2025 & 2033
- Figure 37: Qatar GCC Paints Market Revenue Share (%), by Geography 2025 & 2033
- Figure 38: Qatar GCC Paints Market Volume Share (%), by Geography 2025 & 2033
- Figure 39: Qatar GCC Paints Market Revenue (billion), by Country 2025 & 2033
- Figure 40: Qatar GCC Paints Market Volume (liter ), by Country 2025 & 2033
- Figure 41: Qatar GCC Paints Market Revenue Share (%), by Country 2025 & 2033
- Figure 42: Qatar GCC Paints Market Volume Share (%), by Country 2025 & 2033
- Figure 43: Kuwait GCC Paints Market Revenue (billion), by Resin Type 2025 & 2033
- Figure 44: Kuwait GCC Paints Market Volume (liter ), by Resin Type 2025 & 2033
- Figure 45: Kuwait GCC Paints Market Revenue Share (%), by Resin Type 2025 & 2033
- Figure 46: Kuwait GCC Paints Market Volume Share (%), by Resin Type 2025 & 2033
- Figure 47: Kuwait GCC Paints Market Revenue (billion), by Technology 2025 & 2033
- Figure 48: Kuwait GCC Paints Market Volume (liter ), by Technology 2025 & 2033
- Figure 49: Kuwait GCC Paints Market Revenue Share (%), by Technology 2025 & 2033
- Figure 50: Kuwait GCC Paints Market Volume Share (%), by Technology 2025 & 2033
- Figure 51: Kuwait GCC Paints Market Revenue (billion), by End-user Industry 2025 & 2033
- Figure 52: Kuwait GCC Paints Market Volume (liter ), by End-user Industry 2025 & 2033
- Figure 53: Kuwait GCC Paints Market Revenue Share (%), by End-user Industry 2025 & 2033
- Figure 54: Kuwait GCC Paints Market Volume Share (%), by End-user Industry 2025 & 2033
- Figure 55: Kuwait GCC Paints Market Revenue (billion), by Geography 2025 & 2033
- Figure 56: Kuwait GCC Paints Market Volume (liter ), by Geography 2025 & 2033
- Figure 57: Kuwait GCC Paints Market Revenue Share (%), by Geography 2025 & 2033
- Figure 58: Kuwait GCC Paints Market Volume Share (%), by Geography 2025 & 2033
- Figure 59: Kuwait GCC Paints Market Revenue (billion), by Country 2025 & 2033
- Figure 60: Kuwait GCC Paints Market Volume (liter ), by Country 2025 & 2033
- Figure 61: Kuwait GCC Paints Market Revenue Share (%), by Country 2025 & 2033
- Figure 62: Kuwait GCC Paints Market Volume Share (%), by Country 2025 & 2033
- Figure 63: United Arab Emirates GCC Paints Market Revenue (billion), by Resin Type 2025 & 2033
- Figure 64: United Arab Emirates GCC Paints Market Volume (liter ), by Resin Type 2025 & 2033
- Figure 65: United Arab Emirates GCC Paints Market Revenue Share (%), by Resin Type 2025 & 2033
- Figure 66: United Arab Emirates GCC Paints Market Volume Share (%), by Resin Type 2025 & 2033
- Figure 67: United Arab Emirates GCC Paints Market Revenue (billion), by Technology 2025 & 2033
- Figure 68: United Arab Emirates GCC Paints Market Volume (liter ), by Technology 2025 & 2033
- Figure 69: United Arab Emirates GCC Paints Market Revenue Share (%), by Technology 2025 & 2033
- Figure 70: United Arab Emirates GCC Paints Market Volume Share (%), by Technology 2025 & 2033
- Figure 71: United Arab Emirates GCC Paints Market Revenue (billion), by End-user Industry 2025 & 2033
- Figure 72: United Arab Emirates GCC Paints Market Volume (liter ), by End-user Industry 2025 & 2033
- Figure 73: United Arab Emirates GCC Paints Market Revenue Share (%), by End-user Industry 2025 & 2033
- Figure 74: United Arab Emirates GCC Paints Market Volume Share (%), by End-user Industry 2025 & 2033
- Figure 75: United Arab Emirates GCC Paints Market Revenue (billion), by Geography 2025 & 2033
- Figure 76: United Arab Emirates GCC Paints Market Volume (liter ), by Geography 2025 & 2033
- Figure 77: United Arab Emirates GCC Paints Market Revenue Share (%), by Geography 2025 & 2033
- Figure 78: United Arab Emirates GCC Paints Market Volume Share (%), by Geography 2025 & 2033
- Figure 79: United Arab Emirates GCC Paints Market Revenue (billion), by Country 2025 & 2033
- Figure 80: United Arab Emirates GCC Paints Market Volume (liter ), by Country 2025 & 2033
- Figure 81: United Arab Emirates GCC Paints Market Revenue Share (%), by Country 2025 & 2033
- Figure 82: United Arab Emirates GCC Paints Market Volume Share (%), by Country 2025 & 2033
- Figure 83: Bahrain GCC Paints Market Revenue (billion), by Resin Type 2025 & 2033
- Figure 84: Bahrain GCC Paints Market Volume (liter ), by Resin Type 2025 & 2033
- Figure 85: Bahrain GCC Paints Market Revenue Share (%), by Resin Type 2025 & 2033
- Figure 86: Bahrain GCC Paints Market Volume Share (%), by Resin Type 2025 & 2033
- Figure 87: Bahrain GCC Paints Market Revenue (billion), by Technology 2025 & 2033
- Figure 88: Bahrain GCC Paints Market Volume (liter ), by Technology 2025 & 2033
- Figure 89: Bahrain GCC Paints Market Revenue Share (%), by Technology 2025 & 2033
- Figure 90: Bahrain GCC Paints Market Volume Share (%), by Technology 2025 & 2033
- Figure 91: Bahrain GCC Paints Market Revenue (billion), by End-user Industry 2025 & 2033
- Figure 92: Bahrain GCC Paints Market Volume (liter ), by End-user Industry 2025 & 2033
- Figure 93: Bahrain GCC Paints Market Revenue Share (%), by End-user Industry 2025 & 2033
- Figure 94: Bahrain GCC Paints Market Volume Share (%), by End-user Industry 2025 & 2033
- Figure 95: Bahrain GCC Paints Market Revenue (billion), by Geography 2025 & 2033
- Figure 96: Bahrain GCC Paints Market Volume (liter ), by Geography 2025 & 2033
- Figure 97: Bahrain GCC Paints Market Revenue Share (%), by Geography 2025 & 2033
- Figure 98: Bahrain GCC Paints Market Volume Share (%), by Geography 2025 & 2033
- Figure 99: Bahrain GCC Paints Market Revenue (billion), by Country 2025 & 2033
- Figure 100: Bahrain GCC Paints Market Volume (liter ), by Country 2025 & 2033
- Figure 101: Bahrain GCC Paints Market Revenue Share (%), by Country 2025 & 2033
- Figure 102: Bahrain GCC Paints Market Volume Share (%), by Country 2025 & 2033
- Figure 103: Oman GCC Paints Market Revenue (billion), by Resin Type 2025 & 2033
- Figure 104: Oman GCC Paints Market Volume (liter ), by Resin Type 2025 & 2033
- Figure 105: Oman GCC Paints Market Revenue Share (%), by Resin Type 2025 & 2033
- Figure 106: Oman GCC Paints Market Volume Share (%), by Resin Type 2025 & 2033
- Figure 107: Oman GCC Paints Market Revenue (billion), by Technology 2025 & 2033
- Figure 108: Oman GCC Paints Market Volume (liter ), by Technology 2025 & 2033
- Figure 109: Oman GCC Paints Market Revenue Share (%), by Technology 2025 & 2033
- Figure 110: Oman GCC Paints Market Volume Share (%), by Technology 2025 & 2033
- Figure 111: Oman GCC Paints Market Revenue (billion), by End-user Industry 2025 & 2033
- Figure 112: Oman GCC Paints Market Volume (liter ), by End-user Industry 2025 & 2033
- Figure 113: Oman GCC Paints Market Revenue Share (%), by End-user Industry 2025 & 2033
- Figure 114: Oman GCC Paints Market Volume Share (%), by End-user Industry 2025 & 2033
- Figure 115: Oman GCC Paints Market Revenue (billion), by Geography 2025 & 2033
- Figure 116: Oman GCC Paints Market Volume (liter ), by Geography 2025 & 2033
- Figure 117: Oman GCC Paints Market Revenue Share (%), by Geography 2025 & 2033
- Figure 118: Oman GCC Paints Market Volume Share (%), by Geography 2025 & 2033
- Figure 119: Oman GCC Paints Market Revenue (billion), by Country 2025 & 2033
- Figure 120: Oman GCC Paints Market Volume (liter ), by Country 2025 & 2033
- Figure 121: Oman GCC Paints Market Revenue Share (%), by Country 2025 & 2033
- Figure 122: Oman GCC Paints Market Volume Share (%), by Country 2025 & 2033
List of Tables
- Table 1: Global GCC Paints Market Revenue billion Forecast, by Resin Type 2020 & 2033
- Table 2: Global GCC Paints Market Volume liter Forecast, by Resin Type 2020 & 2033
- Table 3: Global GCC Paints Market Revenue billion Forecast, by Technology 2020 & 2033
- Table 4: Global GCC Paints Market Volume liter Forecast, by Technology 2020 & 2033
- Table 5: Global GCC Paints Market Revenue billion Forecast, by End-user Industry 2020 & 2033
- Table 6: Global GCC Paints Market Volume liter Forecast, by End-user Industry 2020 & 2033
- Table 7: Global GCC Paints Market Revenue billion Forecast, by Geography 2020 & 2033
- Table 8: Global GCC Paints Market Volume liter Forecast, by Geography 2020 & 2033
- Table 9: Global GCC Paints Market Revenue billion Forecast, by Region 2020 & 2033
- Table 10: Global GCC Paints Market Volume liter Forecast, by Region 2020 & 2033
- Table 11: Global GCC Paints Market Revenue billion Forecast, by Resin Type 2020 & 2033
- Table 12: Global GCC Paints Market Volume liter Forecast, by Resin Type 2020 & 2033
- Table 13: Global GCC Paints Market Revenue billion Forecast, by Technology 2020 & 2033
- Table 14: Global GCC Paints Market Volume liter Forecast, by Technology 2020 & 2033
- Table 15: Global GCC Paints Market Revenue billion Forecast, by End-user Industry 2020 & 2033
- Table 16: Global GCC Paints Market Volume liter Forecast, by End-user Industry 2020 & 2033
- Table 17: Global GCC Paints Market Revenue billion Forecast, by Geography 2020 & 2033
- Table 18: Global GCC Paints Market Volume liter Forecast, by Geography 2020 & 2033
- Table 19: Global GCC Paints Market Revenue billion Forecast, by Country 2020 & 2033
- Table 20: Global GCC Paints Market Volume liter Forecast, by Country 2020 & 2033
- Table 21: Global GCC Paints Market Revenue billion Forecast, by Resin Type 2020 & 2033
- Table 22: Global GCC Paints Market Volume liter Forecast, by Resin Type 2020 & 2033
- Table 23: Global GCC Paints Market Revenue billion Forecast, by Technology 2020 & 2033
- Table 24: Global GCC Paints Market Volume liter Forecast, by Technology 2020 & 2033
- Table 25: Global GCC Paints Market Revenue billion Forecast, by End-user Industry 2020 & 2033
- Table 26: Global GCC Paints Market Volume liter Forecast, by End-user Industry 2020 & 2033
- Table 27: Global GCC Paints Market Revenue billion Forecast, by Geography 2020 & 2033
- Table 28: Global GCC Paints Market Volume liter Forecast, by Geography 2020 & 2033
- Table 29: Global GCC Paints Market Revenue billion Forecast, by Country 2020 & 2033
- Table 30: Global GCC Paints Market Volume liter Forecast, by Country 2020 & 2033
- Table 31: Global GCC Paints Market Revenue billion Forecast, by Resin Type 2020 & 2033
- Table 32: Global GCC Paints Market Volume liter Forecast, by Resin Type 2020 & 2033
- Table 33: Global GCC Paints Market Revenue billion Forecast, by Technology 2020 & 2033
- Table 34: Global GCC Paints Market Volume liter Forecast, by Technology 2020 & 2033
- Table 35: Global GCC Paints Market Revenue billion Forecast, by End-user Industry 2020 & 2033
- Table 36: Global GCC Paints Market Volume liter Forecast, by End-user Industry 2020 & 2033
- Table 37: Global GCC Paints Market Revenue billion Forecast, by Geography 2020 & 2033
- Table 38: Global GCC Paints Market Volume liter Forecast, by Geography 2020 & 2033
- Table 39: Global GCC Paints Market Revenue billion Forecast, by Country 2020 & 2033
- Table 40: Global GCC Paints Market Volume liter Forecast, by Country 2020 & 2033
- Table 41: Global GCC Paints Market Revenue billion Forecast, by Resin Type 2020 & 2033
- Table 42: Global GCC Paints Market Volume liter Forecast, by Resin Type 2020 & 2033
- Table 43: Global GCC Paints Market Revenue billion Forecast, by Technology 2020 & 2033
- Table 44: Global GCC Paints Market Volume liter Forecast, by Technology 2020 & 2033
- Table 45: Global GCC Paints Market Revenue billion Forecast, by End-user Industry 2020 & 2033
- Table 46: Global GCC Paints Market Volume liter Forecast, by End-user Industry 2020 & 2033
- Table 47: Global GCC Paints Market Revenue billion Forecast, by Geography 2020 & 2033
- Table 48: Global GCC Paints Market Volume liter Forecast, by Geography 2020 & 2033
- Table 49: Global GCC Paints Market Revenue billion Forecast, by Country 2020 & 2033
- Table 50: Global GCC Paints Market Volume liter Forecast, by Country 2020 & 2033
- Table 51: Global GCC Paints Market Revenue billion Forecast, by Resin Type 2020 & 2033
- Table 52: Global GCC Paints Market Volume liter Forecast, by Resin Type 2020 & 2033
- Table 53: Global GCC Paints Market Revenue billion Forecast, by Technology 2020 & 2033
- Table 54: Global GCC Paints Market Volume liter Forecast, by Technology 2020 & 2033
- Table 55: Global GCC Paints Market Revenue billion Forecast, by End-user Industry 2020 & 2033
- Table 56: Global GCC Paints Market Volume liter Forecast, by End-user Industry 2020 & 2033
- Table 57: Global GCC Paints Market Revenue billion Forecast, by Geography 2020 & 2033
- Table 58: Global GCC Paints Market Volume liter Forecast, by Geography 2020 & 2033
- Table 59: Global GCC Paints Market Revenue billion Forecast, by Country 2020 & 2033
- Table 60: Global GCC Paints Market Volume liter Forecast, by Country 2020 & 2033
- Table 61: Global GCC Paints Market Revenue billion Forecast, by Resin Type 2020 & 2033
- Table 62: Global GCC Paints Market Volume liter Forecast, by Resin Type 2020 & 2033
- Table 63: Global GCC Paints Market Revenue billion Forecast, by Technology 2020 & 2033
- Table 64: Global GCC Paints Market Volume liter Forecast, by Technology 2020 & 2033
- Table 65: Global GCC Paints Market Revenue billion Forecast, by End-user Industry 2020 & 2033
- Table 66: Global GCC Paints Market Volume liter Forecast, by End-user Industry 2020 & 2033
- Table 67: Global GCC Paints Market Revenue billion Forecast, by Geography 2020 & 2033
- Table 68: Global GCC Paints Market Volume liter Forecast, by Geography 2020 & 2033
- Table 69: Global GCC Paints Market Revenue billion Forecast, by Country 2020 & 2033
- Table 70: Global GCC Paints Market Volume liter Forecast, by Country 2020 & 2033
Frequently Asked Questions
1. What is the projected Compound Annual Growth Rate (CAGR) of the GCC Paints Market?
The projected CAGR is approximately 6%.
2. Which companies are prominent players in the GCC Paints Market?
Key companies in the market include Ritver Paints & Coatings*List Not Exhaustive, Caparol, Jotun, Terraco UAE Ltd, RPM International Inc, Thermalite Middle East, Akzo Nobel NV, Jazeera Paints, PPG Industries Inc, Beckers Group, Asian Paints Berger, BASF SE, Hempel A/S, National Paints Factories Co Ltd, Premier Paints Company Limited (The Sherwin-Williams Company), Wacker Chemie AG.
3. What are the main segments of the GCC Paints Market?
The market segments include Resin Type, Technology, End-user Industry, Geography.
4. Can you provide details about the market size?
The market size is estimated to be USD 2.5 billion as of 2022.
5. What are some drivers contributing to market growth?
; Increased Focus on Tourism and Construction; Other Drivers.
6. What are the notable trends driving market growth?
Solvent-borne Technology to Witness the Highest Growth Rate.
7. Are there any restraints impacting market growth?
Slowdown in Automotive Industry.
8. Can you provide examples of recent developments in the market?
N/A
9. What pricing options are available for accessing the report?
Pricing options include single-user, multi-user, and enterprise licenses priced at USD 4750, USD 5250, and USD 8750 respectively.
10. Is the market size provided in terms of value or volume?
The market size is provided in terms of value, measured in billion and volume, measured in liter .
11. Are there any specific market keywords associated with the report?
Yes, the market keyword associated with the report is "GCC Paints Market," which aids in identifying and referencing the specific market segment covered.
12. How do I determine which pricing option suits my needs best?
The pricing options vary based on user requirements and access needs. Individual users may opt for single-user licenses, while businesses requiring broader access may choose multi-user or enterprise licenses for cost-effective access to the report.
13. Are there any additional resources or data provided in the GCC Paints Market report?
While the report offers comprehensive insights, it's advisable to review the specific contents or supplementary materials provided to ascertain if additional resources or data are available.
14. How can I stay updated on further developments or reports in the GCC Paints Market?
To stay informed about further developments, trends, and reports in the GCC Paints Market, consider subscribing to industry newsletters, following relevant companies and organizations, or regularly checking reputable industry news sources and publications.
Methodology
Step 1 - Identification of Relevant Samples Size from Population Database


Step 2 - Approaches for Defining Global Market Size (Value, Volume* & Price*)

Note*: In applicable scenarios
Step 3 - Data Sources
Primary Research
- Web Analytics
- Survey Reports
- Research Institute
- Latest Research Reports
- Opinion Leaders
Secondary Research
- Annual Reports
- White Paper
- Latest Press Release
- Industry Association
- Paid Database
- Investor Presentations

Step 4 - Data Triangulation
Involves using different sources of information in order to increase the validity of a study
These sources are likely to be stakeholders in a program - participants, other researchers, program staff, other community members, and so on.
Then we put all data in single framework & apply various statistical tools to find out the dynamic on the market.
During the analysis stage, feedback from the stakeholder groups would be compared to determine areas of agreement as well as areas of divergence