
Key Insights
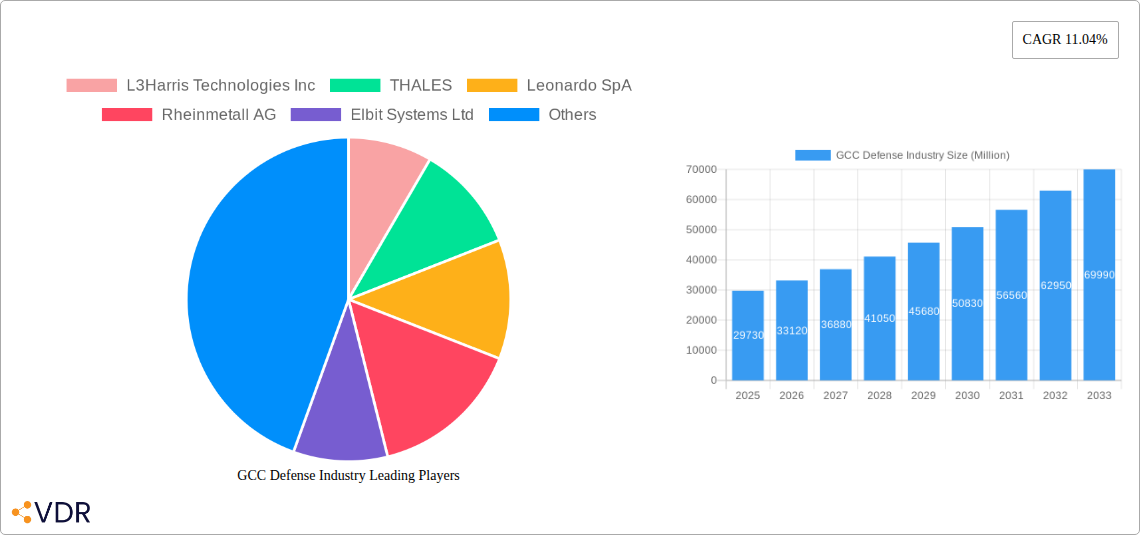
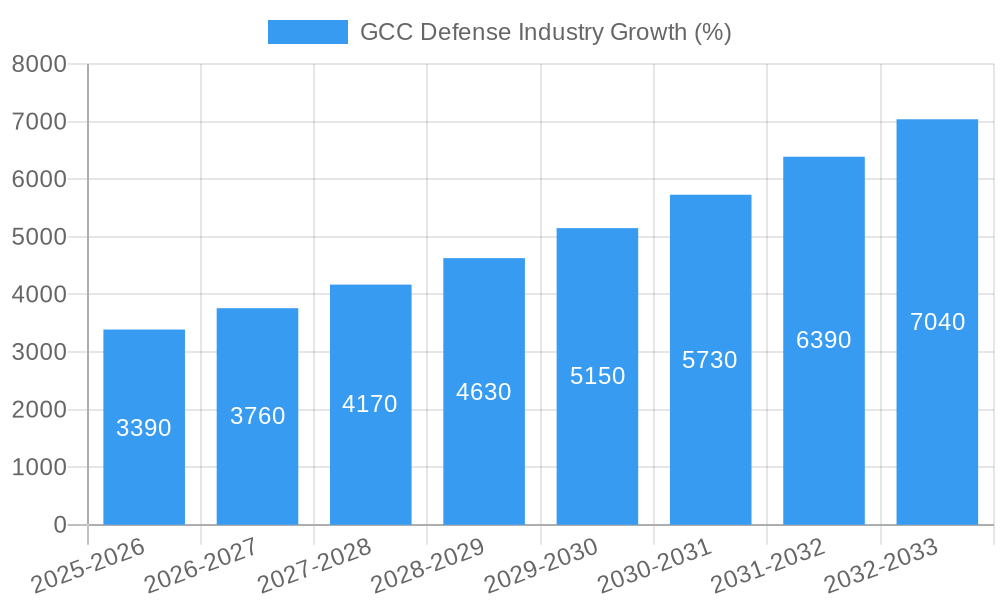
The GCC (Gulf Cooperation Council) defense industry is experiencing robust growth, projected to reach a market size of $29.73 billion in 2025 and maintain a Compound Annual Growth Rate (CAGR) of 11.04% from 2025 to 2033. This expansion is driven by several factors. Geopolitical instability in the region necessitates significant investments in advanced defense technologies and systems for protection and deterrence. Furthermore, modernization initiatives undertaken by various GCC armed forces, including the army, navy, and air force, fuel demand for cutting-edge weaponry, communication systems, and personnel training programs. The increasing focus on cybersecurity and counter-terrorism measures also contributes to this growth, as does the region's substantial oil revenues that provide funding for these large-scale defense procurements. Key segments within the market include protection equipment, communication systems, air-based vehicles, weapons and ammunition, and various training programs. Leading players like L3Harris Technologies, Thales, Leonardo SpA, and others are actively engaged in this lucrative market, vying for contracts and leveraging their technological expertise to meet the diverse needs of the GCC nations. The continued growth trajectory signifies the enduring importance of defense spending in the region and highlights the strategic significance of this market for global defense contractors.
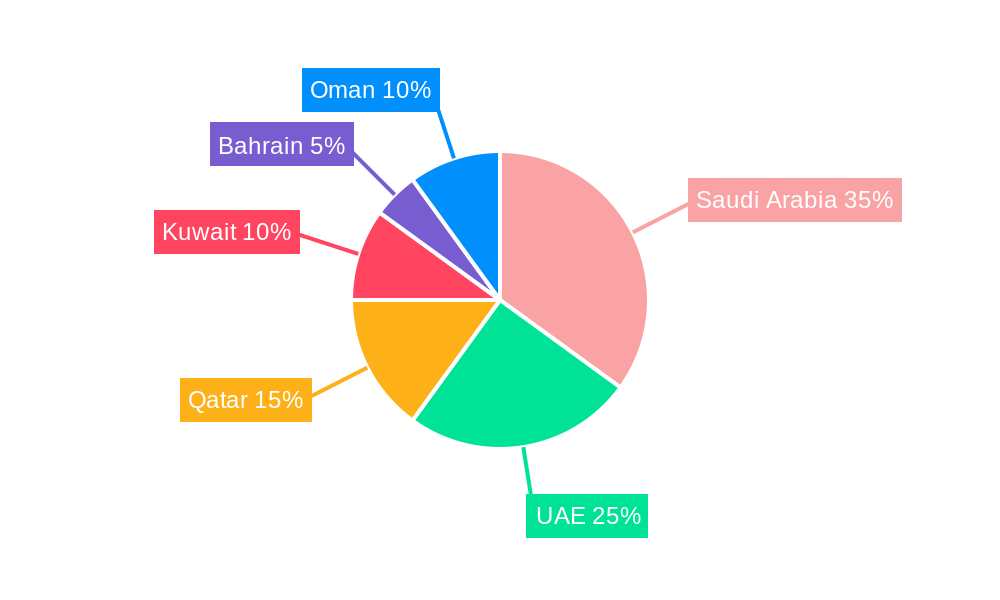
Competition within the GCC defense industry is fierce, with established global players and regional companies all vying for market share. The market is characterized by a complex interplay of government procurement processes, technological advancements, and regional political dynamics. Saudi Arabia, the UAE, and Qatar are major contributors to the overall market size, accounting for a significant portion of defense spending. The demand for sophisticated, technologically advanced systems, including unmanned aerial vehicles (UAVs), cyber warfare solutions, and advanced air defense systems, is driving innovation and attracting substantial investment. Ongoing regional collaborations and joint military exercises between GCC nations further bolster the market. However, economic fluctuations impacting government budgets and potential shifts in geopolitical alliances could present challenges to future growth. Despite these potential headwinds, the long-term outlook for the GCC defense industry remains optimistic, driven by the persistent need for robust defense capabilities in a strategically important region.
GCC Defense Industry Market Report: 2019-2033
This comprehensive report provides an in-depth analysis of the GCC defense industry, covering market dynamics, growth trends, key players, and future outlook. The report utilizes data from 2019-2024 (Historical Period), with a Base Year of 2025 and a Forecast Period spanning 2025-2033. This report is essential for industry professionals, investors, and government agencies seeking to understand and capitalize on opportunities within this rapidly evolving sector. The analysis includes detailed segmentation by Armed Forces (Army, Navy, Air Force), Product Type (Protection Equipment, Air-based Vehicles, Weapons and Ammunition), and specific Protection Equipment categories (Communication Systems, Vehicles).
GCC Defense Industry Market Dynamics & Structure
The GCC defense industry is characterized by a moderately concentrated market with key players holding significant shares. Technological innovation, driven by geopolitical instability and regional security concerns, is a primary growth driver. Stringent regulatory frameworks and export controls influence market access. The industry witnesses substantial M&A activity, reflecting consolidation and strategic partnerships. Substitutes exist for certain equipment, but often lack the specialized features and reliability offered by established defense contractors. End-user demographics consist primarily of national armed forces and security agencies.
- Market Concentration: The top 5 players hold approximately xx% of the market share in 2025 (Estimated Year).
- M&A Activity: An average of xx M&A deals were recorded annually during the historical period (2019-2024).
- Technological Innovation: Focus on advanced surveillance systems, cyber warfare capabilities, and unmanned aerial vehicles (UAVs) are key innovation areas.
- Regulatory Framework: Government procurement processes and defense offset policies significantly impact market dynamics.
- Innovation Barriers: High R&D costs and strict security regulations hinder entry for smaller players.
GCC Defense Industry Growth Trends & Insights
The GCC defense market experienced substantial growth during the historical period, driven by escalating regional tensions and increasing defense budgets. The market size, valued at xx Million in 2024, is projected to reach xx Million by 2033, exhibiting a CAGR of xx%. This growth is fueled by technological advancements, modernization of armed forces, and strategic partnerships. Adoption rates for advanced technologies, such as AI-powered systems and autonomous weapons, are steadily increasing, while market penetration for certain high-tech systems remains relatively low. Consumer behavior reflects a strong preference for cutting-edge technologies and advanced capabilities.
Dominant Regions, Countries, or Segments in GCC Defense Industry
Saudi Arabia and the UAE are the dominant countries within the GCC defense market, accounting for the largest share of spending and procurement activities. Within segments, Air-based Vehicles (specifically fighter jets and related systems) demonstrate robust growth, alongside Weapons and Ammunition. The Army segment represents the largest portion of overall expenditure. Growth is driven by substantial defense budgets, modernization programs, and a focus on enhancing national security.
- Key Drivers: Increased defense expenditure, modernization of armed forces, regional security concerns, and geopolitical tensions.
- Saudi Arabia: Significant investments in air and missile defense systems, along with ground combat capabilities, fuel its dominant position.
- UAE: Focus on naval modernization and advanced air defense systems contribute to its strong market presence.
- Air Force Segment: Modernization of fighter aircraft fleets and investment in advanced air defense systems are key drivers.
- Weapons and Ammunition: Continuous demand for ammunition and precision-guided munitions supports sustained growth.
GCC Defense Industry Product Landscape
The GCC defense industry showcases a diverse product landscape encompassing cutting-edge technologies. Innovations in communication systems, armored vehicles, advanced weaponry, and unmanned aerial systems (UAS) are prevalent. Key performance metrics include accuracy, range, survivability, and integration capabilities. Products are increasingly characterized by advanced features such as AI integration, enhanced situational awareness, and improved human-machine interface. Unique selling propositions frequently involve technological superiority and superior system integration capabilities.
Key Drivers, Barriers & Challenges in GCC Defense Industry
Key Drivers: Increased defense budgets driven by regional instability; modernization of armed forces; technological advancements in weaponry and surveillance; strategic partnerships with global defense contractors.
Key Barriers and Challenges: Supply chain vulnerabilities; dependence on foreign suppliers; stringent regulatory frameworks; intense competition; high costs associated with advanced technology adoption; potential economic downturns that can negatively impact defense spending. These challenges could potentially decrease market growth by xx% by 2033 if not addressed effectively.
Emerging Opportunities in GCC Defense Industry
Significant opportunities exist in cyber security, drone technology, AI-driven systems integration, and advanced training programs. Untapped markets include the development of indigenous defense industries and greater participation in regional collaborative security initiatives. Evolving consumer preferences highlight increasing demand for advanced capabilities and higher levels of system interoperability.
Growth Accelerators in the GCC Defense Industry
Long-term growth will be driven by technological breakthroughs in areas like AI, hypersonic weapons, and space-based assets. Strategic partnerships between GCC nations and international defense companies will play a critical role. Further investment in indigenous defense manufacturing capabilities promises sustained expansion. Market expansion efforts into related sectors such as cybersecurity and homeland security will broaden growth opportunities.
Key Players Shaping the GCC Defense Industry Market
- L3Harris Technologies Inc
- THALES
- Leonardo SpA
- Rheinmetall AG
- Elbit Systems Ltd
- Lockheed Martin Corporation
- Airbus SE
- ASELSAN AS
- IAI
- BAE Systems PLC
- RTX Corporation
- Dahra Engineering & Security Services LLC
- EDGE Group PJSC
- Saudi Arabian Military Industries (SAMI)
- Northrop Grumman Corporation
- The Boeing Company
Notable Milestones in GCC Defense Industry Sector
- February 2024: Lockheed Martin Corporation signed an agreement with Saudi Arabian companies to manufacture components of its Terminal High Altitude Area Defense (THAAD) missile defense system.
- March 2023: Bahrain announced the expected delivery of the latest F-16s in 2024 and 2025.
In-Depth GCC Defense Industry Market Outlook
The GCC defense industry is poised for continued robust growth, driven by sustained investment in advanced technologies and modernization initiatives. Strategic partnerships and the development of indigenous defense capabilities will shape the market's future. Opportunities abound for companies specializing in advanced technologies, particularly in areas such as cyber security and AI-driven systems. The focus on regional security and national defense will continue to fuel substantial demand for advanced defense systems and services.
GCC Defense Industry Segmentation
-
1. Armed Forces
- 1.1. Army
- 1.2. Navy
- 1.3. Air Force
-
2. Type
-
2.1. Personnel Training and Protection
- 2.1.1. Training and Simulation
- 2.1.2. Protection Equipment
- 2.2. Communication Systems
-
2.3. Vehicles
- 2.3.1. Land-based Vehicles
- 2.3.2. Sea-based Vehicles
- 2.3.3. Air-based Vehicles
-
2.4. Weapons and Ammunition
- 2.4.1. Artillery and Mortar Systems
- 2.4.2. Infantry Weapons
- 2.4.3. Missiles and Missile Defense Systems
-
2.1. Personnel Training and Protection
-
3. Geography
- 3.1. Saudi Arabia
- 3.2. United Arab Emirates
- 3.3. Qatar
- 3.4. Kuwait
- 3.5. Bahrain
- 3.6. Oman
GCC Defense Industry Segmentation By Geography
- 1. Saudi Arabia
- 2. United Arab Emirates
- 3. Qatar
- 4. Kuwait
- 5. Bahrain
- 6. Oman
GCC Defense Industry REPORT HIGHLIGHTS
| Aspects | Details |
|---|---|
| Study Period | 2019-2033 |
| Base Year | 2024 |
| Estimated Year | 2025 |
| Forecast Period | 2025-2033 |
| Historical Period | 2019-2024 |
| Growth Rate | CAGR of 11.04% from 2019-2033 |
| Segmentation |
|
Table of Contents
- 1. Introduction
- 1.1. Research Scope
- 1.2. Market Segmentation
- 1.3. Research Methodology
- 1.4. Definitions and Assumptions
- 2. Executive Summary
- 2.1. Introduction
- 3. Market Dynamics
- 3.1. Introduction
- 3.2. Market Drivers
- 3.3. Market Restrains
- 3.4. Market Trends
- 3.4.1. Airforce Segment to Dominate Market Share During the Forecast Period
- 4. Market Factor Analysis
- 4.1. Porters Five Forces
- 4.2. Supply/Value Chain
- 4.3. PESTEL analysis
- 4.4. Market Entropy
- 4.5. Patent/Trademark Analysis
- 5. Global GCC Defense Industry Analysis, Insights and Forecast, 2019-2031
- 5.1. Market Analysis, Insights and Forecast - by Armed Forces
- 5.1.1. Army
- 5.1.2. Navy
- 5.1.3. Air Force
- 5.2. Market Analysis, Insights and Forecast - by Type
- 5.2.1. Personnel Training and Protection
- 5.2.1.1. Training and Simulation
- 5.2.1.2. Protection Equipment
- 5.2.2. Communication Systems
- 5.2.3. Vehicles
- 5.2.3.1. Land-based Vehicles
- 5.2.3.2. Sea-based Vehicles
- 5.2.3.3. Air-based Vehicles
- 5.2.4. Weapons and Ammunition
- 5.2.4.1. Artillery and Mortar Systems
- 5.2.4.2. Infantry Weapons
- 5.2.4.3. Missiles and Missile Defense Systems
- 5.2.1. Personnel Training and Protection
- 5.3. Market Analysis, Insights and Forecast - by Geography
- 5.3.1. Saudi Arabia
- 5.3.2. United Arab Emirates
- 5.3.3. Qatar
- 5.3.4. Kuwait
- 5.3.5. Bahrain
- 5.3.6. Oman
- 5.4. Market Analysis, Insights and Forecast - by Region
- 5.4.1. Saudi Arabia
- 5.4.2. United Arab Emirates
- 5.4.3. Qatar
- 5.4.4. Kuwait
- 5.4.5. Bahrain
- 5.4.6. Oman
- 5.1. Market Analysis, Insights and Forecast - by Armed Forces
- 6. Saudi Arabia GCC Defense Industry Analysis, Insights and Forecast, 2019-2031
- 6.1. Market Analysis, Insights and Forecast - by Armed Forces
- 6.1.1. Army
- 6.1.2. Navy
- 6.1.3. Air Force
- 6.2. Market Analysis, Insights and Forecast - by Type
- 6.2.1. Personnel Training and Protection
- 6.2.1.1. Training and Simulation
- 6.2.1.2. Protection Equipment
- 6.2.2. Communication Systems
- 6.2.3. Vehicles
- 6.2.3.1. Land-based Vehicles
- 6.2.3.2. Sea-based Vehicles
- 6.2.3.3. Air-based Vehicles
- 6.2.4. Weapons and Ammunition
- 6.2.4.1. Artillery and Mortar Systems
- 6.2.4.2. Infantry Weapons
- 6.2.4.3. Missiles and Missile Defense Systems
- 6.2.1. Personnel Training and Protection
- 6.3. Market Analysis, Insights and Forecast - by Geography
- 6.3.1. Saudi Arabia
- 6.3.2. United Arab Emirates
- 6.3.3. Qatar
- 6.3.4. Kuwait
- 6.3.5. Bahrain
- 6.3.6. Oman
- 6.1. Market Analysis, Insights and Forecast - by Armed Forces
- 7. United Arab Emirates GCC Defense Industry Analysis, Insights and Forecast, 2019-2031
- 7.1. Market Analysis, Insights and Forecast - by Armed Forces
- 7.1.1. Army
- 7.1.2. Navy
- 7.1.3. Air Force
- 7.2. Market Analysis, Insights and Forecast - by Type
- 7.2.1. Personnel Training and Protection
- 7.2.1.1. Training and Simulation
- 7.2.1.2. Protection Equipment
- 7.2.2. Communication Systems
- 7.2.3. Vehicles
- 7.2.3.1. Land-based Vehicles
- 7.2.3.2. Sea-based Vehicles
- 7.2.3.3. Air-based Vehicles
- 7.2.4. Weapons and Ammunition
- 7.2.4.1. Artillery and Mortar Systems
- 7.2.4.2. Infantry Weapons
- 7.2.4.3. Missiles and Missile Defense Systems
- 7.2.1. Personnel Training and Protection
- 7.3. Market Analysis, Insights and Forecast - by Geography
- 7.3.1. Saudi Arabia
- 7.3.2. United Arab Emirates
- 7.3.3. Qatar
- 7.3.4. Kuwait
- 7.3.5. Bahrain
- 7.3.6. Oman
- 7.1. Market Analysis, Insights and Forecast - by Armed Forces
- 8. Qatar GCC Defense Industry Analysis, Insights and Forecast, 2019-2031
- 8.1. Market Analysis, Insights and Forecast - by Armed Forces
- 8.1.1. Army
- 8.1.2. Navy
- 8.1.3. Air Force
- 8.2. Market Analysis, Insights and Forecast - by Type
- 8.2.1. Personnel Training and Protection
- 8.2.1.1. Training and Simulation
- 8.2.1.2. Protection Equipment
- 8.2.2. Communication Systems
- 8.2.3. Vehicles
- 8.2.3.1. Land-based Vehicles
- 8.2.3.2. Sea-based Vehicles
- 8.2.3.3. Air-based Vehicles
- 8.2.4. Weapons and Ammunition
- 8.2.4.1. Artillery and Mortar Systems
- 8.2.4.2. Infantry Weapons
- 8.2.4.3. Missiles and Missile Defense Systems
- 8.2.1. Personnel Training and Protection
- 8.3. Market Analysis, Insights and Forecast - by Geography
- 8.3.1. Saudi Arabia
- 8.3.2. United Arab Emirates
- 8.3.3. Qatar
- 8.3.4. Kuwait
- 8.3.5. Bahrain
- 8.3.6. Oman
- 8.1. Market Analysis, Insights and Forecast - by Armed Forces
- 9. Kuwait GCC Defense Industry Analysis, Insights and Forecast, 2019-2031
- 9.1. Market Analysis, Insights and Forecast - by Armed Forces
- 9.1.1. Army
- 9.1.2. Navy
- 9.1.3. Air Force
- 9.2. Market Analysis, Insights and Forecast - by Type
- 9.2.1. Personnel Training and Protection
- 9.2.1.1. Training and Simulation
- 9.2.1.2. Protection Equipment
- 9.2.2. Communication Systems
- 9.2.3. Vehicles
- 9.2.3.1. Land-based Vehicles
- 9.2.3.2. Sea-based Vehicles
- 9.2.3.3. Air-based Vehicles
- 9.2.4. Weapons and Ammunition
- 9.2.4.1. Artillery and Mortar Systems
- 9.2.4.2. Infantry Weapons
- 9.2.4.3. Missiles and Missile Defense Systems
- 9.2.1. Personnel Training and Protection
- 9.3. Market Analysis, Insights and Forecast - by Geography
- 9.3.1. Saudi Arabia
- 9.3.2. United Arab Emirates
- 9.3.3. Qatar
- 9.3.4. Kuwait
- 9.3.5. Bahrain
- 9.3.6. Oman
- 9.1. Market Analysis, Insights and Forecast - by Armed Forces
- 10. Bahrain GCC Defense Industry Analysis, Insights and Forecast, 2019-2031
- 10.1. Market Analysis, Insights and Forecast - by Armed Forces
- 10.1.1. Army
- 10.1.2. Navy
- 10.1.3. Air Force
- 10.2. Market Analysis, Insights and Forecast - by Type
- 10.2.1. Personnel Training and Protection
- 10.2.1.1. Training and Simulation
- 10.2.1.2. Protection Equipment
- 10.2.2. Communication Systems
- 10.2.3. Vehicles
- 10.2.3.1. Land-based Vehicles
- 10.2.3.2. Sea-based Vehicles
- 10.2.3.3. Air-based Vehicles
- 10.2.4. Weapons and Ammunition
- 10.2.4.1. Artillery and Mortar Systems
- 10.2.4.2. Infantry Weapons
- 10.2.4.3. Missiles and Missile Defense Systems
- 10.2.1. Personnel Training and Protection
- 10.3. Market Analysis, Insights and Forecast - by Geography
- 10.3.1. Saudi Arabia
- 10.3.2. United Arab Emirates
- 10.3.3. Qatar
- 10.3.4. Kuwait
- 10.3.5. Bahrain
- 10.3.6. Oman
- 10.1. Market Analysis, Insights and Forecast - by Armed Forces
- 11. Oman GCC Defense Industry Analysis, Insights and Forecast, 2019-2031
- 11.1. Market Analysis, Insights and Forecast - by Armed Forces
- 11.1.1. Army
- 11.1.2. Navy
- 11.1.3. Air Force
- 11.2. Market Analysis, Insights and Forecast - by Type
- 11.2.1. Personnel Training and Protection
- 11.2.1.1. Training and Simulation
- 11.2.1.2. Protection Equipment
- 11.2.2. Communication Systems
- 11.2.3. Vehicles
- 11.2.3.1. Land-based Vehicles
- 11.2.3.2. Sea-based Vehicles
- 11.2.3.3. Air-based Vehicles
- 11.2.4. Weapons and Ammunition
- 11.2.4.1. Artillery and Mortar Systems
- 11.2.4.2. Infantry Weapons
- 11.2.4.3. Missiles and Missile Defense Systems
- 11.2.1. Personnel Training and Protection
- 11.3. Market Analysis, Insights and Forecast - by Geography
- 11.3.1. Saudi Arabia
- 11.3.2. United Arab Emirates
- 11.3.3. Qatar
- 11.3.4. Kuwait
- 11.3.5. Bahrain
- 11.3.6. Oman
- 11.1. Market Analysis, Insights and Forecast - by Armed Forces
- 12. Saudi Arabia GCC Defense Industry Analysis, Insights and Forecast, 2019-2031
- 12.1. Market Analysis, Insights and Forecast - By Country/Sub-region
- 12.1.1.
- 13. United Arab Emirates GCC Defense Industry Analysis, Insights and Forecast, 2019-2031
- 13.1. Market Analysis, Insights and Forecast - By Country/Sub-region
- 13.1.1.
- 14. Qatar GCC Defense Industry Analysis, Insights and Forecast, 2019-2031
- 14.1. Market Analysis, Insights and Forecast - By Country/Sub-region
- 14.1.1.
- 15. Kuwait GCC Defense Industry Analysis, Insights and Forecast, 2019-2031
- 15.1. Market Analysis, Insights and Forecast - By Country/Sub-region
- 15.1.1.
- 16. Bahrain GCC Defense Industry Analysis, Insights and Forecast, 2019-2031
- 16.1. Market Analysis, Insights and Forecast - By Country/Sub-region
- 16.1.1.
- 17. Oman GCC Defense Industry Analysis, Insights and Forecast, 2019-2031
- 17.1. Market Analysis, Insights and Forecast - By Country/Sub-region
- 17.1.1.
- 18. Competitive Analysis
- 18.1. Global Market Share Analysis 2024
- 18.2. Company Profiles
- 18.2.1 L3Harris Technologies Inc
- 18.2.1.1. Overview
- 18.2.1.2. Products
- 18.2.1.3. SWOT Analysis
- 18.2.1.4. Recent Developments
- 18.2.1.5. Financials (Based on Availability)
- 18.2.2 THALES
- 18.2.2.1. Overview
- 18.2.2.2. Products
- 18.2.2.3. SWOT Analysis
- 18.2.2.4. Recent Developments
- 18.2.2.5. Financials (Based on Availability)
- 18.2.3 Leonardo SpA
- 18.2.3.1. Overview
- 18.2.3.2. Products
- 18.2.3.3. SWOT Analysis
- 18.2.3.4. Recent Developments
- 18.2.3.5. Financials (Based on Availability)
- 18.2.4 Rheinmetall AG
- 18.2.4.1. Overview
- 18.2.4.2. Products
- 18.2.4.3. SWOT Analysis
- 18.2.4.4. Recent Developments
- 18.2.4.5. Financials (Based on Availability)
- 18.2.5 Elbit Systems Ltd
- 18.2.5.1. Overview
- 18.2.5.2. Products
- 18.2.5.3. SWOT Analysis
- 18.2.5.4. Recent Developments
- 18.2.5.5. Financials (Based on Availability)
- 18.2.6 Lockheed Martin Corporation
- 18.2.6.1. Overview
- 18.2.6.2. Products
- 18.2.6.3. SWOT Analysis
- 18.2.6.4. Recent Developments
- 18.2.6.5. Financials (Based on Availability)
- 18.2.7 Airbus SE
- 18.2.7.1. Overview
- 18.2.7.2. Products
- 18.2.7.3. SWOT Analysis
- 18.2.7.4. Recent Developments
- 18.2.7.5. Financials (Based on Availability)
- 18.2.8 ASELSAN AS
- 18.2.8.1. Overview
- 18.2.8.2. Products
- 18.2.8.3. SWOT Analysis
- 18.2.8.4. Recent Developments
- 18.2.8.5. Financials (Based on Availability)
- 18.2.9 IAI
- 18.2.9.1. Overview
- 18.2.9.2. Products
- 18.2.9.3. SWOT Analysis
- 18.2.9.4. Recent Developments
- 18.2.9.5. Financials (Based on Availability)
- 18.2.10 BAE Systems PLC
- 18.2.10.1. Overview
- 18.2.10.2. Products
- 18.2.10.3. SWOT Analysis
- 18.2.10.4. Recent Developments
- 18.2.10.5. Financials (Based on Availability)
- 18.2.11 RTX Corporation
- 18.2.11.1. Overview
- 18.2.11.2. Products
- 18.2.11.3. SWOT Analysis
- 18.2.11.4. Recent Developments
- 18.2.11.5. Financials (Based on Availability)
- 18.2.12 Dahra Engineering & Security Services LLC
- 18.2.12.1. Overview
- 18.2.12.2. Products
- 18.2.12.3. SWOT Analysis
- 18.2.12.4. Recent Developments
- 18.2.12.5. Financials (Based on Availability)
- 18.2.13 EDGE Group PJSC
- 18.2.13.1. Overview
- 18.2.13.2. Products
- 18.2.13.3. SWOT Analysis
- 18.2.13.4. Recent Developments
- 18.2.13.5. Financials (Based on Availability)
- 18.2.14 Saudi Arabian Military Industries (SAMI
- 18.2.14.1. Overview
- 18.2.14.2. Products
- 18.2.14.3. SWOT Analysis
- 18.2.14.4. Recent Developments
- 18.2.14.5. Financials (Based on Availability)
- 18.2.15 Northrop Grumman Corporation
- 18.2.15.1. Overview
- 18.2.15.2. Products
- 18.2.15.3. SWOT Analysis
- 18.2.15.4. Recent Developments
- 18.2.15.5. Financials (Based on Availability)
- 18.2.16 The Boeing Company
- 18.2.16.1. Overview
- 18.2.16.2. Products
- 18.2.16.3. SWOT Analysis
- 18.2.16.4. Recent Developments
- 18.2.16.5. Financials (Based on Availability)
- 18.2.1 L3Harris Technologies Inc
List of Figures
- Figure 1: Global GCC Defense Industry Revenue Breakdown (Million, %) by Region 2024 & 2032
- Figure 2: Saudi Arabia GCC Defense Industry Revenue (Million), by Country 2024 & 2032
- Figure 3: Saudi Arabia GCC Defense Industry Revenue Share (%), by Country 2024 & 2032
- Figure 4: United Arab Emirates GCC Defense Industry Revenue (Million), by Country 2024 & 2032
- Figure 5: United Arab Emirates GCC Defense Industry Revenue Share (%), by Country 2024 & 2032
- Figure 6: Qatar GCC Defense Industry Revenue (Million), by Country 2024 & 2032
- Figure 7: Qatar GCC Defense Industry Revenue Share (%), by Country 2024 & 2032
- Figure 8: Kuwait GCC Defense Industry Revenue (Million), by Country 2024 & 2032
- Figure 9: Kuwait GCC Defense Industry Revenue Share (%), by Country 2024 & 2032
- Figure 10: Bahrain GCC Defense Industry Revenue (Million), by Country 2024 & 2032
- Figure 11: Bahrain GCC Defense Industry Revenue Share (%), by Country 2024 & 2032
- Figure 12: Oman GCC Defense Industry Revenue (Million), by Country 2024 & 2032
- Figure 13: Oman GCC Defense Industry Revenue Share (%), by Country 2024 & 2032
- Figure 14: Saudi Arabia GCC Defense Industry Revenue (Million), by Armed Forces 2024 & 2032
- Figure 15: Saudi Arabia GCC Defense Industry Revenue Share (%), by Armed Forces 2024 & 2032
- Figure 16: Saudi Arabia GCC Defense Industry Revenue (Million), by Type 2024 & 2032
- Figure 17: Saudi Arabia GCC Defense Industry Revenue Share (%), by Type 2024 & 2032
- Figure 18: Saudi Arabia GCC Defense Industry Revenue (Million), by Geography 2024 & 2032
- Figure 19: Saudi Arabia GCC Defense Industry Revenue Share (%), by Geography 2024 & 2032
- Figure 20: Saudi Arabia GCC Defense Industry Revenue (Million), by Country 2024 & 2032
- Figure 21: Saudi Arabia GCC Defense Industry Revenue Share (%), by Country 2024 & 2032
- Figure 22: United Arab Emirates GCC Defense Industry Revenue (Million), by Armed Forces 2024 & 2032
- Figure 23: United Arab Emirates GCC Defense Industry Revenue Share (%), by Armed Forces 2024 & 2032
- Figure 24: United Arab Emirates GCC Defense Industry Revenue (Million), by Type 2024 & 2032
- Figure 25: United Arab Emirates GCC Defense Industry Revenue Share (%), by Type 2024 & 2032
- Figure 26: United Arab Emirates GCC Defense Industry Revenue (Million), by Geography 2024 & 2032
- Figure 27: United Arab Emirates GCC Defense Industry Revenue Share (%), by Geography 2024 & 2032
- Figure 28: United Arab Emirates GCC Defense Industry Revenue (Million), by Country 2024 & 2032
- Figure 29: United Arab Emirates GCC Defense Industry Revenue Share (%), by Country 2024 & 2032
- Figure 30: Qatar GCC Defense Industry Revenue (Million), by Armed Forces 2024 & 2032
- Figure 31: Qatar GCC Defense Industry Revenue Share (%), by Armed Forces 2024 & 2032
- Figure 32: Qatar GCC Defense Industry Revenue (Million), by Type 2024 & 2032
- Figure 33: Qatar GCC Defense Industry Revenue Share (%), by Type 2024 & 2032
- Figure 34: Qatar GCC Defense Industry Revenue (Million), by Geography 2024 & 2032
- Figure 35: Qatar GCC Defense Industry Revenue Share (%), by Geography 2024 & 2032
- Figure 36: Qatar GCC Defense Industry Revenue (Million), by Country 2024 & 2032
- Figure 37: Qatar GCC Defense Industry Revenue Share (%), by Country 2024 & 2032
- Figure 38: Kuwait GCC Defense Industry Revenue (Million), by Armed Forces 2024 & 2032
- Figure 39: Kuwait GCC Defense Industry Revenue Share (%), by Armed Forces 2024 & 2032
- Figure 40: Kuwait GCC Defense Industry Revenue (Million), by Type 2024 & 2032
- Figure 41: Kuwait GCC Defense Industry Revenue Share (%), by Type 2024 & 2032
- Figure 42: Kuwait GCC Defense Industry Revenue (Million), by Geography 2024 & 2032
- Figure 43: Kuwait GCC Defense Industry Revenue Share (%), by Geography 2024 & 2032
- Figure 44: Kuwait GCC Defense Industry Revenue (Million), by Country 2024 & 2032
- Figure 45: Kuwait GCC Defense Industry Revenue Share (%), by Country 2024 & 2032
- Figure 46: Bahrain GCC Defense Industry Revenue (Million), by Armed Forces 2024 & 2032
- Figure 47: Bahrain GCC Defense Industry Revenue Share (%), by Armed Forces 2024 & 2032
- Figure 48: Bahrain GCC Defense Industry Revenue (Million), by Type 2024 & 2032
- Figure 49: Bahrain GCC Defense Industry Revenue Share (%), by Type 2024 & 2032
- Figure 50: Bahrain GCC Defense Industry Revenue (Million), by Geography 2024 & 2032
- Figure 51: Bahrain GCC Defense Industry Revenue Share (%), by Geography 2024 & 2032
- Figure 52: Bahrain GCC Defense Industry Revenue (Million), by Country 2024 & 2032
- Figure 53: Bahrain GCC Defense Industry Revenue Share (%), by Country 2024 & 2032
- Figure 54: Oman GCC Defense Industry Revenue (Million), by Armed Forces 2024 & 2032
- Figure 55: Oman GCC Defense Industry Revenue Share (%), by Armed Forces 2024 & 2032
- Figure 56: Oman GCC Defense Industry Revenue (Million), by Type 2024 & 2032
- Figure 57: Oman GCC Defense Industry Revenue Share (%), by Type 2024 & 2032
- Figure 58: Oman GCC Defense Industry Revenue (Million), by Geography 2024 & 2032
- Figure 59: Oman GCC Defense Industry Revenue Share (%), by Geography 2024 & 2032
- Figure 60: Oman GCC Defense Industry Revenue (Million), by Country 2024 & 2032
- Figure 61: Oman GCC Defense Industry Revenue Share (%), by Country 2024 & 2032
List of Tables
- Table 1: Global GCC Defense Industry Revenue Million Forecast, by Region 2019 & 2032
- Table 2: Global GCC Defense Industry Revenue Million Forecast, by Armed Forces 2019 & 2032
- Table 3: Global GCC Defense Industry Revenue Million Forecast, by Type 2019 & 2032
- Table 4: Global GCC Defense Industry Revenue Million Forecast, by Geography 2019 & 2032
- Table 5: Global GCC Defense Industry Revenue Million Forecast, by Region 2019 & 2032
- Table 6: Global GCC Defense Industry Revenue Million Forecast, by Country 2019 & 2032
- Table 7: GCC Defense Industry Revenue (Million) Forecast, by Application 2019 & 2032
- Table 8: Global GCC Defense Industry Revenue Million Forecast, by Country 2019 & 2032
- Table 9: GCC Defense Industry Revenue (Million) Forecast, by Application 2019 & 2032
- Table 10: Global GCC Defense Industry Revenue Million Forecast, by Country 2019 & 2032
- Table 11: GCC Defense Industry Revenue (Million) Forecast, by Application 2019 & 2032
- Table 12: Global GCC Defense Industry Revenue Million Forecast, by Country 2019 & 2032
- Table 13: GCC Defense Industry Revenue (Million) Forecast, by Application 2019 & 2032
- Table 14: Global GCC Defense Industry Revenue Million Forecast, by Country 2019 & 2032
- Table 15: GCC Defense Industry Revenue (Million) Forecast, by Application 2019 & 2032
- Table 16: Global GCC Defense Industry Revenue Million Forecast, by Country 2019 & 2032
- Table 17: GCC Defense Industry Revenue (Million) Forecast, by Application 2019 & 2032
- Table 18: Global GCC Defense Industry Revenue Million Forecast, by Armed Forces 2019 & 2032
- Table 19: Global GCC Defense Industry Revenue Million Forecast, by Type 2019 & 2032
- Table 20: Global GCC Defense Industry Revenue Million Forecast, by Geography 2019 & 2032
- Table 21: Global GCC Defense Industry Revenue Million Forecast, by Country 2019 & 2032
- Table 22: Global GCC Defense Industry Revenue Million Forecast, by Armed Forces 2019 & 2032
- Table 23: Global GCC Defense Industry Revenue Million Forecast, by Type 2019 & 2032
- Table 24: Global GCC Defense Industry Revenue Million Forecast, by Geography 2019 & 2032
- Table 25: Global GCC Defense Industry Revenue Million Forecast, by Country 2019 & 2032
- Table 26: Global GCC Defense Industry Revenue Million Forecast, by Armed Forces 2019 & 2032
- Table 27: Global GCC Defense Industry Revenue Million Forecast, by Type 2019 & 2032
- Table 28: Global GCC Defense Industry Revenue Million Forecast, by Geography 2019 & 2032
- Table 29: Global GCC Defense Industry Revenue Million Forecast, by Country 2019 & 2032
- Table 30: Global GCC Defense Industry Revenue Million Forecast, by Armed Forces 2019 & 2032
- Table 31: Global GCC Defense Industry Revenue Million Forecast, by Type 2019 & 2032
- Table 32: Global GCC Defense Industry Revenue Million Forecast, by Geography 2019 & 2032
- Table 33: Global GCC Defense Industry Revenue Million Forecast, by Country 2019 & 2032
- Table 34: Global GCC Defense Industry Revenue Million Forecast, by Armed Forces 2019 & 2032
- Table 35: Global GCC Defense Industry Revenue Million Forecast, by Type 2019 & 2032
- Table 36: Global GCC Defense Industry Revenue Million Forecast, by Geography 2019 & 2032
- Table 37: Global GCC Defense Industry Revenue Million Forecast, by Country 2019 & 2032
- Table 38: Global GCC Defense Industry Revenue Million Forecast, by Armed Forces 2019 & 2032
- Table 39: Global GCC Defense Industry Revenue Million Forecast, by Type 2019 & 2032
- Table 40: Global GCC Defense Industry Revenue Million Forecast, by Geography 2019 & 2032
- Table 41: Global GCC Defense Industry Revenue Million Forecast, by Country 2019 & 2032
Frequently Asked Questions
1. What is the projected Compound Annual Growth Rate (CAGR) of the GCC Defense Industry?
The projected CAGR is approximately 11.04%.
2. Which companies are prominent players in the GCC Defense Industry?
Key companies in the market include L3Harris Technologies Inc, THALES, Leonardo SpA, Rheinmetall AG, Elbit Systems Ltd, Lockheed Martin Corporation, Airbus SE, ASELSAN AS, IAI, BAE Systems PLC, RTX Corporation, Dahra Engineering & Security Services LLC, EDGE Group PJSC, Saudi Arabian Military Industries (SAMI, Northrop Grumman Corporation, The Boeing Company.
3. What are the main segments of the GCC Defense Industry?
The market segments include Armed Forces, Type, Geography.
4. Can you provide details about the market size?
The market size is estimated to be USD 29.73 Million as of 2022.
5. What are some drivers contributing to market growth?
N/A
6. What are the notable trends driving market growth?
Airforce Segment to Dominate Market Share During the Forecast Period.
7. Are there any restraints impacting market growth?
N/A
8. Can you provide examples of recent developments in the market?
February 2024: Lockheed Martin Corporation signed an agreement with Saudi Arabian companies to manufacture components of its Terminal High Altitude Area Defense (THAAD) missile defense system. This move comes as the United States continues to conduct military operations in the Middle East.
9. What pricing options are available for accessing the report?
Pricing options include single-user, multi-user, and enterprise licenses priced at USD 4750, USD 5250, and USD 8750 respectively.
10. Is the market size provided in terms of value or volume?
The market size is provided in terms of value, measured in Million.
11. Are there any specific market keywords associated with the report?
Yes, the market keyword associated with the report is "GCC Defense Industry," which aids in identifying and referencing the specific market segment covered.
12. How do I determine which pricing option suits my needs best?
The pricing options vary based on user requirements and access needs. Individual users may opt for single-user licenses, while businesses requiring broader access may choose multi-user or enterprise licenses for cost-effective access to the report.
13. Are there any additional resources or data provided in the GCC Defense Industry report?
While the report offers comprehensive insights, it's advisable to review the specific contents or supplementary materials provided to ascertain if additional resources or data are available.
14. How can I stay updated on further developments or reports in the GCC Defense Industry?
To stay informed about further developments, trends, and reports in the GCC Defense Industry, consider subscribing to industry newsletters, following relevant companies and organizations, or regularly checking reputable industry news sources and publications.
Methodology
Step 1 - Identification of Relevant Samples Size from Population Database


Step 2 - Approaches for Defining Global Market Size (Value, Volume* & Price*)

Note*: In applicable scenarios
Step 3 - Data Sources
Primary Research
- Web Analytics
- Survey Reports
- Research Institute
- Latest Research Reports
- Opinion Leaders
Secondary Research
- Annual Reports
- White Paper
- Latest Press Release
- Industry Association
- Paid Database
- Investor Presentations

Step 4 - Data Triangulation
Involves using different sources of information in order to increase the validity of a study
These sources are likely to be stakeholders in a program - participants, other researchers, program staff, other community members, and so on.
Then we put all data in single framework & apply various statistical tools to find out the dynamic on the market.
During the analysis stage, feedback from the stakeholder groups would be compared to determine areas of agreement as well as areas of divergence


