

Key Insights
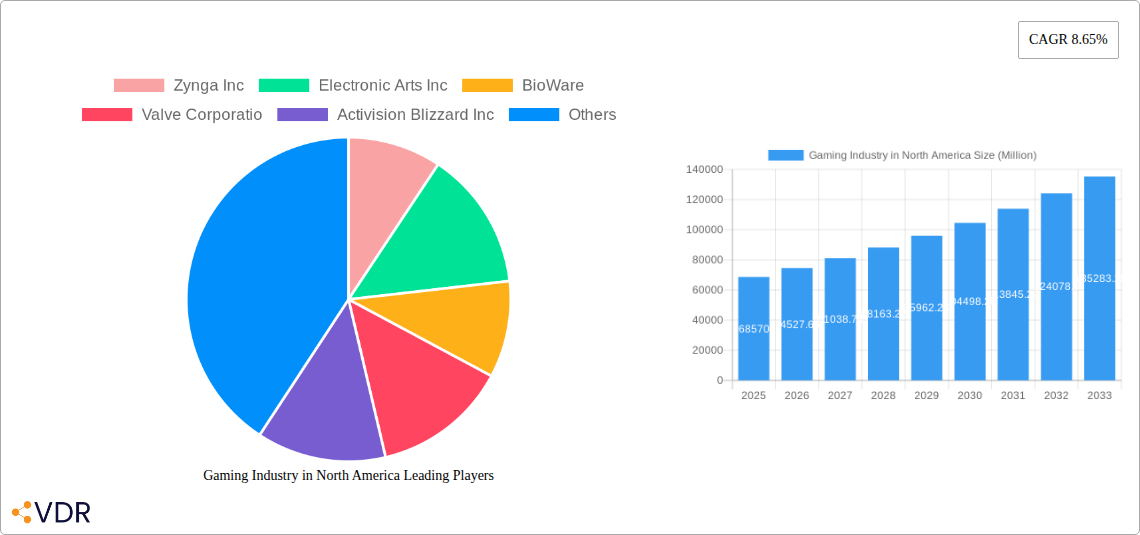
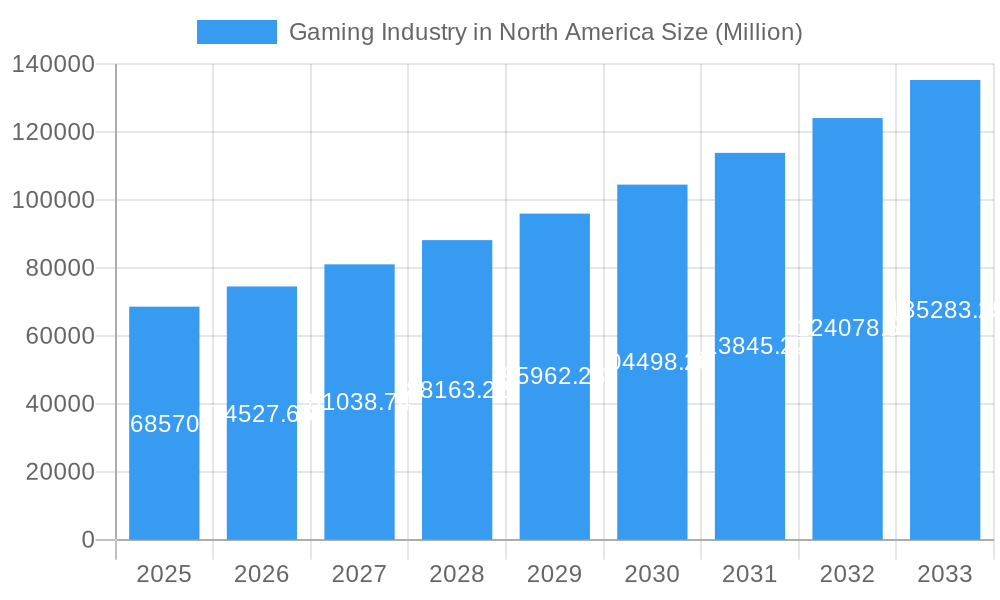
The North American gaming market, a significant segment of the global industry, exhibits robust growth, driven by several key factors. The market's substantial size, estimated at $68.57 billion in 2025, reflects the widespread adoption of gaming across diverse demographics. A compound annual growth rate (CAGR) of 8.65% from 2025 to 2033 projects continued expansion, fueled by several factors. Increased mobile gaming penetration, particularly among younger audiences, contributes significantly to this growth. The rise of esports and its associated viewership, sponsorships, and merchandise sales further bolsters market expansion. Technological advancements, such as the improved graphics and immersive experiences offered by next-generation consoles and VR/AR technologies, continue to attract new players and retain existing ones, enhancing the overall market value. The increasing popularity of cloud gaming services also contributes to market growth by allowing players access to high-quality games without needing expensive hardware.
Gaming Industry in North America Market Size (In Billion)
However, the market faces certain constraints. Price sensitivity among consumers, particularly during economic downturns, could affect spending on premium titles and in-game purchases. The competitive landscape, with established players like Electronic Arts, Activision Blizzard, and Nintendo vying for market share alongside smaller, innovative studios, demands ongoing adaptation and innovation. Furthermore, the potential for market saturation in specific game genres necessitates ongoing diversification and the development of novel gameplay experiences to maintain growth momentum. Despite these challenges, the continued expansion of the digital distribution model and the growing engagement with online gaming platforms suggest a bright outlook for the North American gaming market throughout the forecast period (2025-2033). Growth will likely be seen across all segments, including digital, physical, and online/microtransaction gaming, with the digital segment poised for particularly rapid expansion.
Gaming Industry in North America Company Market Share
Gaming Industry in North America: 2019-2033 Market Report
This comprehensive report provides a detailed analysis of the North American gaming industry, encompassing market dynamics, growth trends, key players, and future outlook. Covering the period from 2019 to 2033, with a focus on 2025, this report is an invaluable resource for industry professionals, investors, and strategic planners. The report segments the market by gaming type (Digital, Physical, Online/Microtransactions) and geography (US, Canada), offering granular insights into the parent and child markets. The total market size is projected to reach xx million units by 2033.
Keywords: North American gaming market, gaming industry trends, video game market analysis, digital gaming, online gaming, microtransactions, esports, gaming market size, gaming industry forecast, US gaming market, Canadian gaming market, Zynga, Electronic Arts, Activision Blizzard, Microsoft, Nintendo, Sony, Ubisoft, Take-Two Interactive, BioWare, Valve.
Gaming Industry in North America Market Dynamics & Structure
The North American gaming market is characterized by high concentration among a few major players, alongside a dynamic ecosystem of smaller studios and independent developers. Technological innovation, particularly in areas like cloud gaming, VR/AR, and AI, is a key driver. Regulatory frameworks, varying by state and province, significantly influence market access and operations. Competitive product substitutes, including other forms of entertainment, pose a challenge, demanding continuous innovation and engagement from gaming companies. The end-user demographic is diverse, spanning across age groups, genders, and socio-economic backgrounds, presenting distinct opportunities for targeted marketing strategies. Mergers and acquisitions (M&A) are frequent, shaping market landscape and driving consolidation.
- Market Concentration: The top 10 companies hold approximately xx% of the market share in 2025.
- Technological Innovation: Cloud gaming, VR/AR, and AI are driving significant changes.
- Regulatory Landscape: Varying regulations across North America create complex compliance needs.
- Competitive Substitutes: Streaming services, social media, and other entertainment compete for consumer time.
- End-User Demographics: A diverse demographic creates opportunities for targeted content and monetization.
- M&A Activity: A high volume of M&A deals (xx deals in 2024) indicates consolidation and strategic growth.
Gaming Industry in North America Growth Trends & Insights
The North American gaming market experienced substantial growth during the historical period (2019-2024), driven by increased digital adoption, the rise of mobile gaming, and the expansion of esports. The market is projected to continue its expansion at a Compound Annual Growth Rate (CAGR) of xx% during the forecast period (2025-2033). This growth is fueled by technological advancements, such as enhanced graphics and immersive gameplay experiences, as well as changing consumer preferences toward subscription-based models and mobile-first gaming. The increasing prevalence of microtransactions and in-app purchases also contributes to revenue generation. Market penetration of gaming is high, with xx% of the population actively engaged in gaming in 2024.
Dominant Regions, Countries, or Segments in Gaming Industry in North America
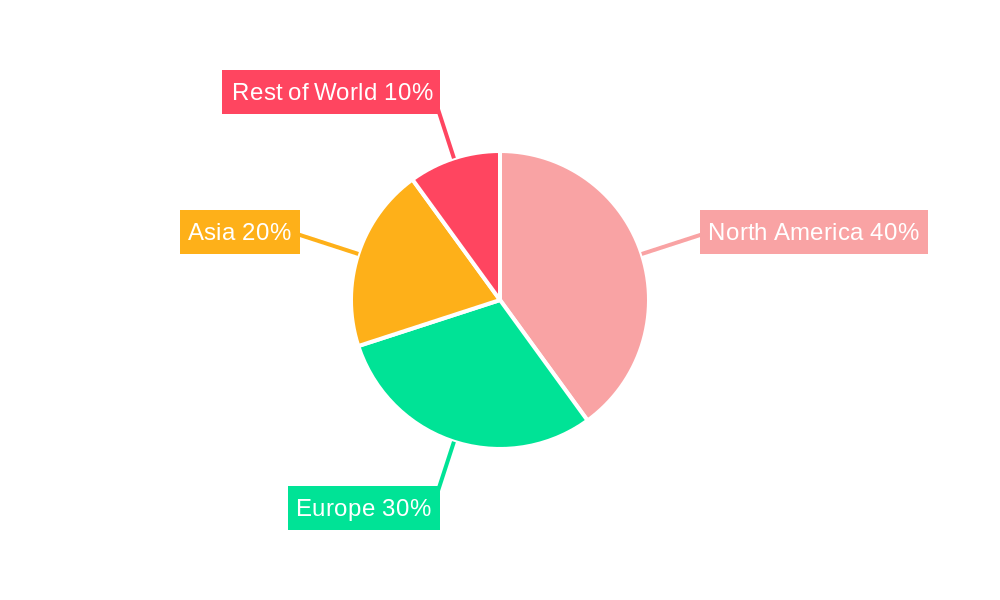
The United States dominates the North American gaming market, holding approximately xx% of the total market share in 2025, followed by Canada with xx%. Within gaming types, the digital segment, encompassing downloads and online games, constitutes the largest share (xx%), driven by the convenience and accessibility of digital distribution. Online/Microtransactions is the fastest-growing segment, fueled by the popularity of free-to-play games and in-game purchases.
- US Dominance: Larger market size, higher disposable income, and established infrastructure contribute to US leadership.
- Canada's Growth: Growing adoption of digital gaming and expanding regulatory frameworks drive growth in Canada.
- Digital Segment's Preeminence: Ease of access, diverse game library, and subscription models boost digital gaming’s dominance.
- Online/Microtransactions' Rapid Expansion: Free-to-play games with monetization strategies propel this segment’s growth.
Gaming Industry in North America Product Landscape
The North American gaming market showcases a diverse range of products, including console games, PC games, mobile games, and online multiplayer games. These products incorporate advanced technologies like realistic graphics, AI-powered NPCs, and cross-platform compatibility. Unique selling propositions include immersive storylines, competitive multiplayer modes, and regular content updates to maintain player engagement. Technological advancements constantly push the boundaries of gaming experiences, leading to more immersive and engaging gameplay.
Key Drivers, Barriers & Challenges in Gaming Industry in North America
Key Drivers: Technological advancements (VR/AR, cloud gaming), increasing smartphone penetration, rising disposable incomes, and the growing popularity of esports are key drivers of market expansion.
Challenges: Intense competition, piracy, regulatory hurdles concerning in-app purchases and loot boxes, and supply chain disruptions (e.g., semiconductor shortages impacting console production, potentially reducing xx million unit sales in 2025) create significant challenges.
Emerging Opportunities in Gaming Industry in North America
Emerging trends like cloud gaming, metaverse integration, and the expansion of esports present significant opportunities. Untapped markets within specific demographics, niche genres, and emerging technologies offer significant potential for growth. Evolving consumer preferences towards personalized experiences and community-driven content necessitate innovation.
Growth Accelerators in the Gaming Industry in North America Industry
Strategic partnerships, technological breakthroughs in game development, and expansion into new markets (e.g., cloud gaming) are key growth catalysts. Investment in research and development, focusing on immersive technologies and personalized gaming experiences, will play a critical role in driving long-term expansion.
Key Players Shaping the Gaming Industry in North America Market
Notable Milestones in Gaming Industry in North America Sector
- July 2022: Nuvei Corporation and GAN Limited partnered to expand payment solutions across the US and Canada.
- October 2022: Meta and Microsoft partnered to bring Windows apps and games to Meta Quest devices.
In-Depth Gaming Industry in North America Market Outlook
The North American gaming market is poised for continued growth, driven by technological innovations and evolving consumer preferences. Strategic partnerships, expansion into new markets, and a focus on immersive experiences will shape the future of the industry. The market's robust growth trajectory presents significant opportunities for players who adapt to evolving consumer demands and embrace technological advancements.
Gaming Industry in North America Segmentation
-
1. Product Type
- 1.1. Digital Games
- 1.2. Physical Games
- 1.3. Online/Microtransactions
- 1.4. Virtual Reality (VR) and Augmented Reality (AR) Games
- 1.5. Mobile Games
-
2. Platform
- 2.1. Consoles
- 2.2. PCs
- 2.3. Mobile Devices
- 2.4. Virtual Reality Headsets
-
3. Region
- 3.1. United States
- 3.2. Canada
- 3.3. Mexico
Gaming Industry in North America Segmentation By Geography
-
1. North America
- 1.1. United States
- 1.2. Canada
- 1.3. Mexico
Gaming Industry in North America Regional Market Share
Geographic Coverage of Gaming Industry in North America
Gaming Industry in North America REPORT HIGHLIGHTS
| Aspects | Details |
|---|---|
| Study Period | 2020-2034 |
| Base Year | 2025 |
| Estimated Year | 2026 |
| Forecast Period | 2026-2034 |
| Historical Period | 2020-2025 |
| Growth Rate | CAGR of 8.65% from 2020-2034 |
| Segmentation |
|
Table of Contents
- 1. Introduction
- 1.1. Research Scope
- 1.2. Market Segmentation
- 1.3. Research Objective
- 1.4. Definitions and Assumptions
- 2. Executive Summary
- 2.1. Market Snapshot
- 3. Market Dynamics
- 3.1. Market Drivers
- 3.2. Market Restrains
- 3.3. Market Trends
- 3.4. Market Opportunities
- 4. Market Factor Analysis
- 4.1. Porters Five Forces
- 4.1.1. Bargaining Power of Suppliers
- 4.1.2. Bargaining Power of Buyers
- 4.1.3. Threat of New Entrants
- 4.1.4. Threat of Substitutes
- 4.1.5. Competitive Rivalry
- 4.2. PESTEL analysis
- 4.3. BCG Analysis
- 4.3.1. Stars (High Growth, High Market Share)
- 4.3.2. Cash Cows (Low Growth, High Market Share)
- 4.3.3. Question Mark (High Growth, Low Market Share)
- 4.3.4. Dogs (Low Growth, Low Market Share)
- 4.4. Ansoff Matrix Analysis
- 4.5. Supply Chain Analysis
- 4.6. Regulatory Landscape
- 4.7. Current Market Potential and Opportunity Assessment (TAM–SAM–SOM Framework)
- 4.8. VDR Analyst Note
- 4.1. Porters Five Forces
- 5. Market Analysis, Insights and Forecast 2021-2033
- 5.1. Market Analysis, Insights and Forecast - by Product Type
- 5.1.1. Digital Games
- 5.1.2. Physical Games
- 5.1.3. Online/Microtransactions
- 5.1.4. Virtual Reality (VR) and Augmented Reality (AR) Games
- 5.1.5. Mobile Games
- 5.2. Market Analysis, Insights and Forecast - by Platform
- 5.2.1. Consoles
- 5.2.2. PCs
- 5.2.3. Mobile Devices
- 5.2.4. Virtual Reality Headsets
- 5.3. Market Analysis, Insights and Forecast - by Region
- 5.3.1. United States
- 5.3.2. Canada
- 5.3.3. Mexico
- 5.4. Market Analysis, Insights and Forecast - by Region
- 5.4.1. North America
- 5.1. Market Analysis, Insights and Forecast - by Product Type
- 6. Global Gaming Industry in North America Analysis, Insights and Forecast, 2021-2033
- 6.1. Market Analysis, Insights and Forecast - by Product Type
- 6.1.1. Digital Games
- 6.1.2. Physical Games
- 6.1.3. Online/Microtransactions
- 6.1.4. Virtual Reality (VR) and Augmented Reality (AR) Games
- 6.1.5. Mobile Games
- 6.2. Market Analysis, Insights and Forecast - by Platform
- 6.2.1. Consoles
- 6.2.2. PCs
- 6.2.3. Mobile Devices
- 6.2.4. Virtual Reality Headsets
- 6.3. Market Analysis, Insights and Forecast - by Region
- 6.3.1. United States
- 6.3.2. Canada
- 6.3.3. Mexico
- 6.1. Market Analysis, Insights and Forecast - by Product Type
- 7. Competitive Analysis
- 7.1. Company Profiles
- 7.1.1 Zynga Inc
- 7.1.1.1. Company Overview
- 7.1.1.2. Products
- 7.1.1.3. Company Financials
- 7.1.1.4. SWOT Analysis
- 7.1.2 Electronic Arts Inc
- 7.1.2.1. Company Overview
- 7.1.2.2. Products
- 7.1.2.3. Company Financials
- 7.1.2.4. SWOT Analysis
- 7.1.3 BioWare
- 7.1.3.1. Company Overview
- 7.1.3.2. Products
- 7.1.3.3. Company Financials
- 7.1.3.4. SWOT Analysis
- 7.1.4 Valve Corporatio
- 7.1.4.1. Company Overview
- 7.1.4.2. Products
- 7.1.4.3. Company Financials
- 7.1.4.4. SWOT Analysis
- 7.1.5 Activision Blizzard Inc
- 7.1.5.1. Company Overview
- 7.1.5.2. Products
- 7.1.5.3. Company Financials
- 7.1.5.4. SWOT Analysis
- 7.1.6 Microsoft Corporation
- 7.1.6.1. Company Overview
- 7.1.6.2. Products
- 7.1.6.3. Company Financials
- 7.1.6.4. SWOT Analysis
- 7.1.7 Ubisoft Entertainment SA
- 7.1.7.1. Company Overview
- 7.1.7.2. Products
- 7.1.7.3. Company Financials
- 7.1.7.4. SWOT Analysis
- 7.1.8 Nintendo Co Ltd
- 7.1.8.1. Company Overview
- 7.1.8.2. Products
- 7.1.8.3. Company Financials
- 7.1.8.4. SWOT Analysis
- 7.1.9 Take-Two Interactive Software Inc
- 7.1.9.1. Company Overview
- 7.1.9.2. Products
- 7.1.9.3. Company Financials
- 7.1.9.4. SWOT Analysis
- 7.1.10 Sony Corporation
- 7.1.10.1. Company Overview
- 7.1.10.2. Products
- 7.1.10.3. Company Financials
- 7.1.10.4. SWOT Analysis
- 7.1.1 Zynga Inc
- 7.2. Market Entropy
- 7.2.1 Company's Key Areas Served
- 7.2.2 Recent Developments
- 7.3. Company Market Share Analysis 2025
- 7.3.1 Top 5 Companies Market Share Analysis
- 7.3.2 Top 3 Companies Market Share Analysis
- 7.4. List of Potential Customers
- 8. Research Methodology
List of Figures
- Figure 1: Global Gaming Industry in North America Revenue Breakdown (Million, %) by Region 2025 & 2033
- Figure 2: Global Gaming Industry in North America Volume Breakdown (K Unit, %) by Region 2025 & 2033
- Figure 3: North America Gaming Industry in North America Revenue (Million), by Product Type 2025 & 2033
- Figure 4: North America Gaming Industry in North America Volume (K Unit), by Product Type 2025 & 2033
- Figure 5: North America Gaming Industry in North America Revenue Share (%), by Product Type 2025 & 2033
- Figure 6: North America Gaming Industry in North America Volume Share (%), by Product Type 2025 & 2033
- Figure 7: North America Gaming Industry in North America Revenue (Million), by Platform 2025 & 2033
- Figure 8: North America Gaming Industry in North America Volume (K Unit), by Platform 2025 & 2033
- Figure 9: North America Gaming Industry in North America Revenue Share (%), by Platform 2025 & 2033
- Figure 10: North America Gaming Industry in North America Volume Share (%), by Platform 2025 & 2033
- Figure 11: North America Gaming Industry in North America Revenue (Million), by Region 2025 & 2033
- Figure 12: North America Gaming Industry in North America Volume (K Unit), by Region 2025 & 2033
- Figure 13: North America Gaming Industry in North America Revenue Share (%), by Region 2025 & 2033
- Figure 14: North America Gaming Industry in North America Volume Share (%), by Region 2025 & 2033
- Figure 15: North America Gaming Industry in North America Revenue (Million), by Country 2025 & 2033
- Figure 16: North America Gaming Industry in North America Volume (K Unit), by Country 2025 & 2033
- Figure 17: North America Gaming Industry in North America Revenue Share (%), by Country 2025 & 2033
- Figure 18: North America Gaming Industry in North America Volume Share (%), by Country 2025 & 2033
List of Tables
- Table 1: Global Gaming Industry in North America Revenue Million Forecast, by Product Type 2020 & 2033
- Table 2: Global Gaming Industry in North America Volume K Unit Forecast, by Product Type 2020 & 2033
- Table 3: Global Gaming Industry in North America Revenue Million Forecast, by Platform 2020 & 2033
- Table 4: Global Gaming Industry in North America Volume K Unit Forecast, by Platform 2020 & 2033
- Table 5: Global Gaming Industry in North America Revenue Million Forecast, by Region 2020 & 2033
- Table 6: Global Gaming Industry in North America Volume K Unit Forecast, by Region 2020 & 2033
- Table 7: Global Gaming Industry in North America Revenue Million Forecast, by Region 2020 & 2033
- Table 8: Global Gaming Industry in North America Volume K Unit Forecast, by Region 2020 & 2033
- Table 9: Global Gaming Industry in North America Revenue Million Forecast, by Product Type 2020 & 2033
- Table 10: Global Gaming Industry in North America Volume K Unit Forecast, by Product Type 2020 & 2033
- Table 11: Global Gaming Industry in North America Revenue Million Forecast, by Platform 2020 & 2033
- Table 12: Global Gaming Industry in North America Volume K Unit Forecast, by Platform 2020 & 2033
- Table 13: Global Gaming Industry in North America Revenue Million Forecast, by Region 2020 & 2033
- Table 14: Global Gaming Industry in North America Volume K Unit Forecast, by Region 2020 & 2033
- Table 15: Global Gaming Industry in North America Revenue Million Forecast, by Country 2020 & 2033
- Table 16: Global Gaming Industry in North America Volume K Unit Forecast, by Country 2020 & 2033
- Table 17: United States Gaming Industry in North America Revenue (Million) Forecast, by Application 2020 & 2033
- Table 18: United States Gaming Industry in North America Volume (K Unit) Forecast, by Application 2020 & 2033
- Table 19: Canada Gaming Industry in North America Revenue (Million) Forecast, by Application 2020 & 2033
- Table 20: Canada Gaming Industry in North America Volume (K Unit) Forecast, by Application 2020 & 2033
- Table 21: Mexico Gaming Industry in North America Revenue (Million) Forecast, by Application 2020 & 2033
- Table 22: Mexico Gaming Industry in North America Volume (K Unit) Forecast, by Application 2020 & 2033
Frequently Asked Questions
1. What is the projected Compound Annual Growth Rate (CAGR) of the Gaming Industry in North America?
The projected CAGR is approximately 8.65%.
2. Which companies are prominent players in the Gaming Industry in North America?
Key companies in the market include Zynga Inc, Electronic Arts Inc, BioWare, Valve Corporatio, Activision Blizzard Inc, Microsoft Corporation, Ubisoft Entertainment SA, Nintendo Co Ltd, Take-Two Interactive Software Inc, Sony Corporation.
3. What are the main segments of the Gaming Industry in North America?
The market segments include Product Type , Platform, Region.
4. Can you provide details about the market size?
The market size is estimated to be USD 68.57 Million as of 2022.
5. What are some drivers contributing to market growth?
Rising Smartphone and Internet Penetration; Adoption of Gaming Platforms. such as E-sports Betting and Fantasy Sites.
6. What are the notable trends driving market growth?
Rising Smartphone adoption and Internet Penetration Driving the Market Growth.
7. Are there any restraints impacting market growth?
Implementation and Integration Concerns Hindering the Market.
8. Can you provide examples of recent developments in the market?
October 2022 - Meta partnered with Microsoft Corporation to bring Teams, Windows apps, and games to Quest devices. The partnership is to bring new content, including Windows apps and Teams tie-ins, to Meta's metaverse hardware efforts.
9. What pricing options are available for accessing the report?
Pricing options include single-user, multi-user, and enterprise licenses priced at USD 4750, USD 4950, and USD 6800 respectively.
10. Is the market size provided in terms of value or volume?
The market size is provided in terms of value, measured in Million and volume, measured in K Unit.
11. Are there any specific market keywords associated with the report?
Yes, the market keyword associated with the report is "Gaming Industry in North America," which aids in identifying and referencing the specific market segment covered.
12. How do I determine which pricing option suits my needs best?
The pricing options vary based on user requirements and access needs. Individual users may opt for single-user licenses, while businesses requiring broader access may choose multi-user or enterprise licenses for cost-effective access to the report.
13. Are there any additional resources or data provided in the Gaming Industry in North America report?
While the report offers comprehensive insights, it's advisable to review the specific contents or supplementary materials provided to ascertain if additional resources or data are available.
14. How can I stay updated on further developments or reports in the Gaming Industry in North America?
To stay informed about further developments, trends, and reports in the Gaming Industry in North America, consider subscribing to industry newsletters, following relevant companies and organizations, or regularly checking reputable industry news sources and publications.
Methodology
Step 1 - Identification of Relevant Samples Size from Population Database


Step 2 - Approaches for Defining Global Market Size (Value, Volume* & Price*)

Note*: In applicable scenarios
Step 3 - Data Sources
Primary Research
- Web Analytics
- Survey Reports
- Research Institute
- Latest Research Reports
- Opinion Leaders
Secondary Research
- Annual Reports
- White Paper
- Latest Press Release
- Industry Association
- Paid Database
- Investor Presentations

Step 4 - Data Triangulation
Involves using different sources of information in order to increase the validity of a study
These sources are likely to be stakeholders in a program - participants, other researchers, program staff, other community members, and so on.
Then we put all data in single framework & apply various statistical tools to find out the dynamic on the market.
During the analysis stage, feedback from the stakeholder groups would be compared to determine areas of agreement as well as areas of divergence