

Key Insights
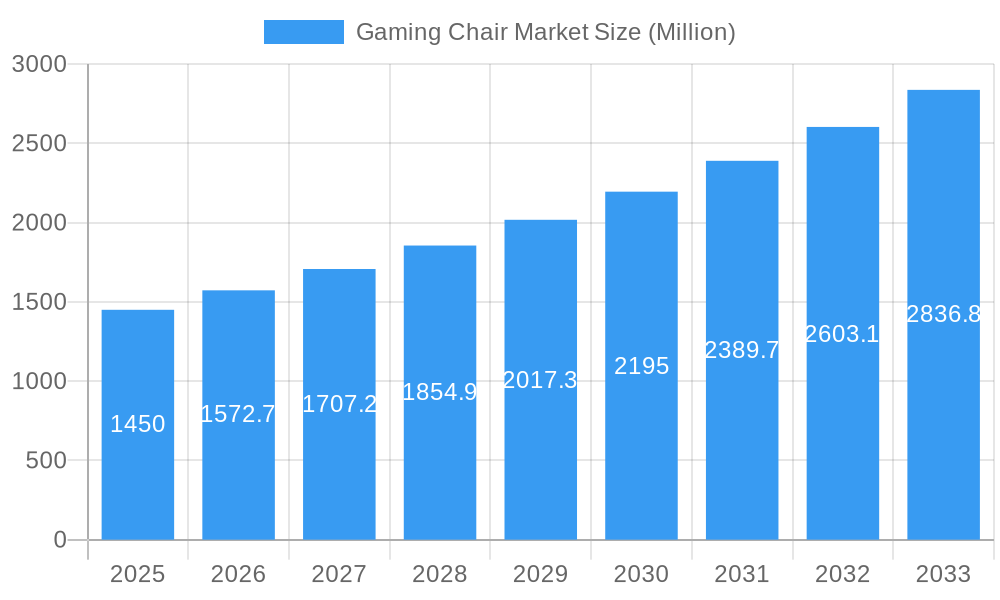
The global gaming chair market, valued at $1.45 billion in 2025, is projected to experience robust growth, exhibiting a compound annual growth rate (CAGR) of 8.15% from 2025 to 2033. This expansion is fueled by several key drivers. The rising popularity of esports and competitive gaming is a significant factor, driving demand for ergonomic and high-performance chairs designed to enhance comfort and improve gameplay. Technological advancements, such as the integration of advanced features like customizable lumbar support, integrated speakers, and vibration feedback, are further boosting market appeal. Increased disposable incomes, particularly among younger demographics who are avid gamers, contribute to higher consumer spending on premium gaming accessories, including chairs. The market is segmented by end-user (residential and commercial), distribution channel (home centers, specialty stores, online, and other channels), and chair type (PC gaming chairs, hybrid gaming chairs, platform gaming chairs, and others). The online distribution channel is expected to witness significant growth due to its convenience and accessibility. While the market faces potential restraints such as price sensitivity in certain regions and intense competition among numerous established and emerging brands, the overall growth trajectory remains positive, driven by the expanding gaming community and technological innovation.

Gaming Chair Market Market Size (In Billion)
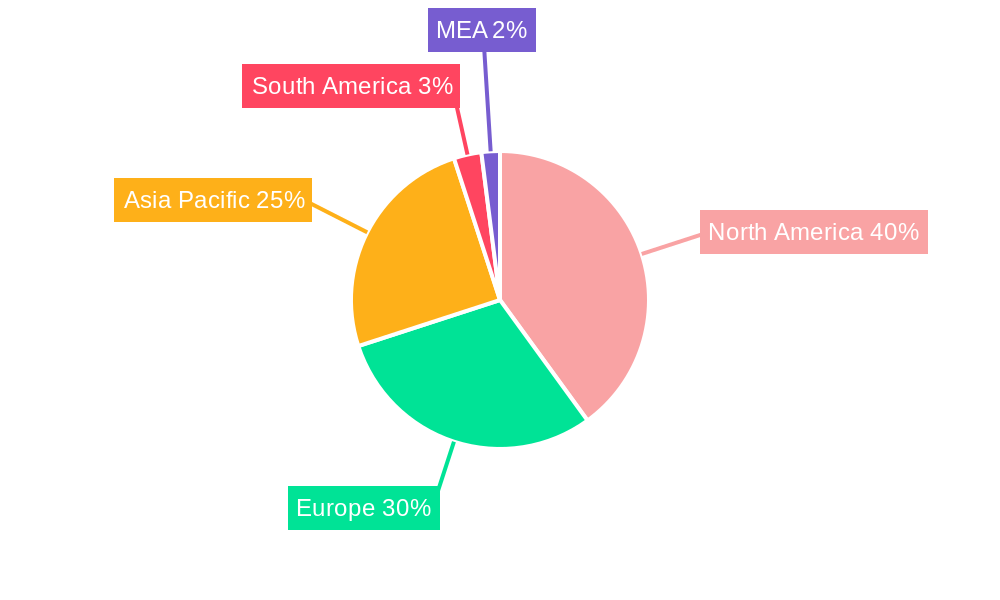
The North American market currently holds a substantial share, driven by a large established gaming community and high disposable incomes. However, the Asia-Pacific region is poised for significant growth, fueled by a rapidly expanding gaming market in countries like China and India. Europe also presents a considerable market opportunity, with increasing adoption of gaming chairs across diverse demographics. Key players like GT Omega Racing, Corsair, and Secretlab are actively engaged in product innovation, strategic partnerships, and aggressive marketing to maintain their competitive edge. Future market dynamics will likely involve increased focus on sustainability, the introduction of innovative materials and designs, and the expansion into niche markets catering to specific gaming preferences and ergonomic needs. The continued growth of esports and the evolving gaming landscape will continue to shape the market's trajectory over the forecast period.
Gaming Chair Market Company Market Share
Gaming Chair Market: A Comprehensive Report (2019-2033)
This in-depth report provides a comprehensive analysis of the Gaming Chair Market, encompassing market dynamics, growth trends, regional insights, product landscape, key players, and future outlook. The study period covers 2019-2033, with 2025 as the base year and a forecast period of 2025-2033. The report segments the market by end-user (residential, commercial), distribution channel (home centers, specialty stores, online, other), and chair type (PC gaming chair, hybrid gaming chair, platform gaming chair, other). The market size is presented in million units.
Gaming Chair Market Dynamics & Structure
This section analyzes the competitive landscape, technological advancements, regulatory aspects, and market trends within the gaming chair industry. The market is characterized by moderate concentration, with key players vying for market share through innovation and branding. Technological advancements, such as improved ergonomics and materials, are driving growth, while regulatory frameworks concerning safety and materials impact product development. The rise of esports and increased home-based gaming contribute to substantial growth. Mergers and acquisitions (M&A) activity within the sector remains relatively low (xx deals in the last 5 years), suggesting a focus on organic growth.
- Market Concentration: Moderately concentrated, with top 10 players holding xx% market share in 2024.
- Technological Innovation: Focus on ergonomics, advanced materials (memory foam, breathable fabrics), and customizable features.
- Regulatory Frameworks: Safety standards and material regulations influence product design and manufacturing.
- Competitive Substitutes: Traditional office chairs and other seating solutions pose indirect competition.
- End-User Demographics: Predominantly young adults (18-35 years) and gamers are the primary target demographic.
- M&A Trends: Low M&A activity, with a preference for organic growth strategies among major players.
Gaming Chair Market Growth Trends & Insights
The global gaming chair market experienced significant growth during the historical period (2019-2024), driven by rising gaming popularity, increasing disposable incomes, and technological advancements. The market size reached xx million units in 2024, exhibiting a CAGR of xx% during this period. The forecast period (2025-2033) projects continued growth, albeit at a slightly moderated pace, reaching an estimated xx million units by 2033, with a projected CAGR of xx%. This growth is fueled by factors like the increasing popularity of esports, the rising demand for comfortable and ergonomic gaming setups, and the expansion of the online gaming market. The market penetration rate is expected to increase from xx% in 2024 to xx% by 2033. Technological disruptions, such as the integration of smart features and advanced materials, will further drive market expansion. Consumer behavior shifts, indicating a preference for high-quality, customizable chairs, are also impacting the market.
Dominant Regions, Countries, or Segments in Gaming Chair Market
The North American region is currently the largest market segment for gaming chairs, followed by Europe and Asia-Pacific. The residential segment dominates by end-user, driven by the increasing number of home gamers. Online distribution channels are gaining significant traction, offering convenience and wider reach compared to traditional retail. PC gaming chairs constitute the largest share of the market by type.
- Key Drivers: Increasing disposable incomes, expanding gaming communities, rising esports popularity.
- North America: High adoption rate due to strong gaming culture and higher disposable income.
- Europe: Significant growth potential, driven by increasing esports participation and gaming industry expansion.
- Asia-Pacific: Fastest-growing region, boosted by rising internet penetration and a growing young population.
- Residential Segment: Dominant end-user segment, driven by individual gaming enthusiasts.
- Online Channel: Growing market share due to convenience and extensive product selection.
- PC Gaming Chairs: Leading market segment by type, reflecting the popularity of PC gaming.
Gaming Chair Market Product Landscape
The gaming chair market features a diverse range of products, encompassing PC gaming chairs designed for extended comfort during gameplay, hybrid chairs offering versatility for both gaming and work, platform gaming chairs for console users, and other specialized chair types. Key product innovations include improved ergonomic designs, the use of high-quality materials such as breathable fabrics and memory foam, adjustable features for personalized comfort, and the integration of technological advancements like built-in speakers or vibration motors. These features aim to enhance the gaming experience and cater to the diverse needs and preferences of gamers. Unique selling propositions focus on comfort, ergonomics, customization, and brand image.
Key Drivers, Barriers & Challenges in Gaming Chair Market
Key Drivers:
- Rising popularity of esports and online gaming
- Increasing disposable income among young adults
- Technological advancements in chair design and materials
- Growing demand for ergonomic and comfortable gaming setups
Challenges and Restraints:
- Intense competition among numerous brands
- Fluctuations in raw material prices impacting manufacturing costs
- Supply chain disruptions influencing production and delivery times
- Potential for regulatory changes affecting product safety and compliance
Emerging Opportunities in Gaming Chair Market
- Expanding into untapped markets in developing economies.
- Development of specialized gaming chairs for different gaming platforms (VR, AR).
- Increased focus on customization options and personalized designs.
- Exploring collaborations with gaming brands and esports organizations.
Growth Accelerators in the Gaming Chair Market Industry
Strategic partnerships between gaming chair manufacturers and esports organizations will drive substantial growth. The development of innovative materials and ergonomic designs that prioritize player health will further accelerate the market’s expansion. Furthermore, the growing popularity of virtual reality (VR) and augmented reality (AR) gaming will create new opportunities for specialized gaming chairs tailored to these immersive technologies.
Key Players Shaping the Gaming Chair Market Market
- GT Omega Racing
- Corsair
- X Rocker
- DxRacer USA
- Arozzi
- AkRacing
- Noblechairs
- Vertagear
- Ace Casual Furniture
- Secretlab
Notable Milestones in Gaming Chair Market Sector
- June 2022: CORSAIR launched the CORSAIR TC200 Fabric and Leatherette Gaming Chairs, expanding its gaming furniture lineup.
- August 2022: Cybeart announced the world's first Lord of the Rings Chair, expanding its licensed product range.
In-Depth Gaming Chair Market Market Outlook
The gaming chair market is poised for continued growth, driven by technological advancements, increasing gaming adoption, and expanding market segments. Strategic partnerships, product diversification, and a focus on ergonomic designs will be crucial for success. The market presents significant opportunities for manufacturers to innovate and capture market share in this dynamic and rapidly evolving sector.
Gaming Chair Market Segmentation
-
1. Type
- 1.1. PC Gaming Chair
- 1.2. Hybrid Gaming Chair
- 1.3. Platform Gaming Chair
-
2. End User
- 2.1. Residential
- 2.2. Commercial
-
3. Distribution Channel
- 3.1. Home Centers
- 3.2. Specialty Stores
- 3.3. Online
Gaming Chair Market Segmentation By Geography
-
1. North America
- 1.1. United States
- 1.2. Canada
- 1.3. Rest of North America
-
2. Europe
- 2.1. United Kingdom
- 2.2. Germany
- 2.3. Rest of Europe
-
3. Asia Pacific
- 3.1. India
- 3.2. Japan
- 3.3. Rest of Asia Pacific
-
4. South America
- 4.1. Brazil
- 4.2. Peru
- 4.3. Rest of South America
-
5. Middle East and Africa
- 5.1. Saudi Arabia
- 5.2. United Arab Emirates
- 5.3. Rest of Middle East and Africa
Gaming Chair Market Regional Market Share
Geographic Coverage of Gaming Chair Market
Gaming Chair Market REPORT HIGHLIGHTS
| Aspects | Details |
|---|---|
| Study Period | 2020-2034 |
| Base Year | 2025 |
| Estimated Year | 2026 |
| Forecast Period | 2026-2034 |
| Historical Period | 2020-2025 |
| Growth Rate | CAGR of 8.15% from 2020-2034 |
| Segmentation |
|
Table of Contents
- 1. Introduction
- 1.1. Research Scope
- 1.2. Market Segmentation
- 1.3. Research Objective
- 1.4. Definitions and Assumptions
- 2. Executive Summary
- 2.1. Market Snapshot
- 3. Market Dynamics
- 3.1. Market Drivers
- 3.2. Market Restrains
- 3.3. Market Trends
- 3.4. Market Opportunities
- 4. Market Factor Analysis
- 4.1. Porters Five Forces
- 4.1.1. Bargaining Power of Suppliers
- 4.1.2. Bargaining Power of Buyers
- 4.1.3. Threat of New Entrants
- 4.1.4. Threat of Substitutes
- 4.1.5. Competitive Rivalry
- 4.2. PESTEL analysis
- 4.3. BCG Analysis
- 4.3.1. Stars (High Growth, High Market Share)
- 4.3.2. Cash Cows (Low Growth, High Market Share)
- 4.3.3. Question Mark (High Growth, Low Market Share)
- 4.3.4. Dogs (Low Growth, Low Market Share)
- 4.4. Ansoff Matrix Analysis
- 4.5. Supply Chain Analysis
- 4.6. Regulatory Landscape
- 4.7. Current Market Potential and Opportunity Assessment (TAM–SAM–SOM Framework)
- 4.8. VDR Analyst Note
- 4.1. Porters Five Forces
- 5. Market Analysis, Insights and Forecast 2021-2033
- 5.1. Market Analysis, Insights and Forecast - by Type
- 5.1.1. PC Gaming Chair
- 5.1.2. Hybrid Gaming Chair
- 5.1.3. Platform Gaming Chair
- 5.2. Market Analysis, Insights and Forecast - by End User
- 5.2.1. Residential
- 5.2.2. Commercial
- 5.3. Market Analysis, Insights and Forecast - by Distribution Channel
- 5.3.1. Home Centers
- 5.3.2. Specialty Stores
- 5.3.3. Online
- 5.4. Market Analysis, Insights and Forecast - by Region
- 5.4.1. North America
- 5.4.2. Europe
- 5.4.3. Asia Pacific
- 5.4.4. South America
- 5.4.5. Middle East and Africa
- 5.1. Market Analysis, Insights and Forecast - by Type
- 6. Global Gaming Chair Market Analysis, Insights and Forecast, 2021-2033
- 6.1. Market Analysis, Insights and Forecast - by Type
- 6.1.1. PC Gaming Chair
- 6.1.2. Hybrid Gaming Chair
- 6.1.3. Platform Gaming Chair
- 6.2. Market Analysis, Insights and Forecast - by End User
- 6.2.1. Residential
- 6.2.2. Commercial
- 6.3. Market Analysis, Insights and Forecast - by Distribution Channel
- 6.3.1. Home Centers
- 6.3.2. Specialty Stores
- 6.3.3. Online
- 6.1. Market Analysis, Insights and Forecast - by Type
- 7. North America Gaming Chair Market Analysis, Insights and Forecast, 2021-2033
- 7.1. Market Analysis, Insights and Forecast - by Type
- 7.1.1. PC Gaming Chair
- 7.1.2. Hybrid Gaming Chair
- 7.1.3. Platform Gaming Chair
- 7.2. Market Analysis, Insights and Forecast - by End User
- 7.2.1. Residential
- 7.2.2. Commercial
- 7.3. Market Analysis, Insights and Forecast - by Distribution Channel
- 7.3.1. Home Centers
- 7.3.2. Specialty Stores
- 7.3.3. Online
- 7.1. Market Analysis, Insights and Forecast - by Type
- 8. Europe Gaming Chair Market Analysis, Insights and Forecast, 2021-2033
- 8.1. Market Analysis, Insights and Forecast - by Type
- 8.1.1. PC Gaming Chair
- 8.1.2. Hybrid Gaming Chair
- 8.1.3. Platform Gaming Chair
- 8.2. Market Analysis, Insights and Forecast - by End User
- 8.2.1. Residential
- 8.2.2. Commercial
- 8.3. Market Analysis, Insights and Forecast - by Distribution Channel
- 8.3.1. Home Centers
- 8.3.2. Specialty Stores
- 8.3.3. Online
- 8.1. Market Analysis, Insights and Forecast - by Type
- 9. Asia Pacific Gaming Chair Market Analysis, Insights and Forecast, 2021-2033
- 9.1. Market Analysis, Insights and Forecast - by Type
- 9.1.1. PC Gaming Chair
- 9.1.2. Hybrid Gaming Chair
- 9.1.3. Platform Gaming Chair
- 9.2. Market Analysis, Insights and Forecast - by End User
- 9.2.1. Residential
- 9.2.2. Commercial
- 9.3. Market Analysis, Insights and Forecast - by Distribution Channel
- 9.3.1. Home Centers
- 9.3.2. Specialty Stores
- 9.3.3. Online
- 9.1. Market Analysis, Insights and Forecast - by Type
- 10. South America Gaming Chair Market Analysis, Insights and Forecast, 2021-2033
- 10.1. Market Analysis, Insights and Forecast - by Type
- 10.1.1. PC Gaming Chair
- 10.1.2. Hybrid Gaming Chair
- 10.1.3. Platform Gaming Chair
- 10.2. Market Analysis, Insights and Forecast - by End User
- 10.2.1. Residential
- 10.2.2. Commercial
- 10.3. Market Analysis, Insights and Forecast - by Distribution Channel
- 10.3.1. Home Centers
- 10.3.2. Specialty Stores
- 10.3.3. Online
- 10.1. Market Analysis, Insights and Forecast - by Type
- 11. Middle East and Africa Gaming Chair Market Analysis, Insights and Forecast, 2021-2033
- 11.1. Market Analysis, Insights and Forecast - by Type
- 11.1.1. PC Gaming Chair
- 11.1.2. Hybrid Gaming Chair
- 11.1.3. Platform Gaming Chair
- 11.2. Market Analysis, Insights and Forecast - by End User
- 11.2.1. Residential
- 11.2.2. Commercial
- 11.3. Market Analysis, Insights and Forecast - by Distribution Channel
- 11.3.1. Home Centers
- 11.3.2. Specialty Stores
- 11.3.3. Online
- 11.1. Market Analysis, Insights and Forecast - by Type
- 12. Competitive Analysis
- 12.1. Company Profiles
- 12.1.1 GT Omega Racing
- 12.1.1.1. Company Overview
- 12.1.1.2. Products
- 12.1.1.3. Company Financials
- 12.1.1.4. SWOT Analysis
- 12.1.2 Corsair
- 12.1.2.1. Company Overview
- 12.1.2.2. Products
- 12.1.2.3. Company Financials
- 12.1.2.4. SWOT Analysis
- 12.1.3 X Rocker
- 12.1.3.1. Company Overview
- 12.1.3.2. Products
- 12.1.3.3. Company Financials
- 12.1.3.4. SWOT Analysis
- 12.1.4 DxRacer USA
- 12.1.4.1. Company Overview
- 12.1.4.2. Products
- 12.1.4.3. Company Financials
- 12.1.4.4. SWOT Analysis
- 12.1.5 Arozzi
- 12.1.5.1. Company Overview
- 12.1.5.2. Products
- 12.1.5.3. Company Financials
- 12.1.5.4. SWOT Analysis
- 12.1.6 AkRacing
- 12.1.6.1. Company Overview
- 12.1.6.2. Products
- 12.1.6.3. Company Financials
- 12.1.6.4. SWOT Analysis
- 12.1.7 Noblechairs
- 12.1.7.1. Company Overview
- 12.1.7.2. Products
- 12.1.7.3. Company Financials
- 12.1.7.4. SWOT Analysis
- 12.1.8 Vertagear
- 12.1.8.1. Company Overview
- 12.1.8.2. Products
- 12.1.8.3. Company Financials
- 12.1.8.4. SWOT Analysis
- 12.1.9 Ace Casual Furniture
- 12.1.9.1. Company Overview
- 12.1.9.2. Products
- 12.1.9.3. Company Financials
- 12.1.9.4. SWOT Analysis
- 12.1.10 Secretlab
- 12.1.10.1. Company Overview
- 12.1.10.2. Products
- 12.1.10.3. Company Financials
- 12.1.10.4. SWOT Analysis
- 12.1.1 GT Omega Racing
- 12.2. Market Entropy
- 12.2.1 Company's Key Areas Served
- 12.2.2 Recent Developments
- 12.3. Company Market Share Analysis 2025
- 12.3.1 Top 5 Companies Market Share Analysis
- 12.3.2 Top 3 Companies Market Share Analysis
- 12.4. List of Potential Customers
- 13. Research Methodology
List of Figures
- Figure 1: Global Gaming Chair Market Revenue Breakdown (Million, %) by Region 2025 & 2033
- Figure 2: Global Gaming Chair Market Volume Breakdown (K Units, %) by Region 2025 & 2033
- Figure 3: North America Gaming Chair Market Revenue (Million), by Type 2025 & 2033
- Figure 4: North America Gaming Chair Market Volume (K Units), by Type 2025 & 2033
- Figure 5: North America Gaming Chair Market Revenue Share (%), by Type 2025 & 2033
- Figure 6: North America Gaming Chair Market Volume Share (%), by Type 2025 & 2033
- Figure 7: North America Gaming Chair Market Revenue (Million), by End User 2025 & 2033
- Figure 8: North America Gaming Chair Market Volume (K Units), by End User 2025 & 2033
- Figure 9: North America Gaming Chair Market Revenue Share (%), by End User 2025 & 2033
- Figure 10: North America Gaming Chair Market Volume Share (%), by End User 2025 & 2033
- Figure 11: North America Gaming Chair Market Revenue (Million), by Distribution Channel 2025 & 2033
- Figure 12: North America Gaming Chair Market Volume (K Units), by Distribution Channel 2025 & 2033
- Figure 13: North America Gaming Chair Market Revenue Share (%), by Distribution Channel 2025 & 2033
- Figure 14: North America Gaming Chair Market Volume Share (%), by Distribution Channel 2025 & 2033
- Figure 15: North America Gaming Chair Market Revenue (Million), by Country 2025 & 2033
- Figure 16: North America Gaming Chair Market Volume (K Units), by Country 2025 & 2033
- Figure 17: North America Gaming Chair Market Revenue Share (%), by Country 2025 & 2033
- Figure 18: North America Gaming Chair Market Volume Share (%), by Country 2025 & 2033
- Figure 19: Europe Gaming Chair Market Revenue (Million), by Type 2025 & 2033
- Figure 20: Europe Gaming Chair Market Volume (K Units), by Type 2025 & 2033
- Figure 21: Europe Gaming Chair Market Revenue Share (%), by Type 2025 & 2033
- Figure 22: Europe Gaming Chair Market Volume Share (%), by Type 2025 & 2033
- Figure 23: Europe Gaming Chair Market Revenue (Million), by End User 2025 & 2033
- Figure 24: Europe Gaming Chair Market Volume (K Units), by End User 2025 & 2033
- Figure 25: Europe Gaming Chair Market Revenue Share (%), by End User 2025 & 2033
- Figure 26: Europe Gaming Chair Market Volume Share (%), by End User 2025 & 2033
- Figure 27: Europe Gaming Chair Market Revenue (Million), by Distribution Channel 2025 & 2033
- Figure 28: Europe Gaming Chair Market Volume (K Units), by Distribution Channel 2025 & 2033
- Figure 29: Europe Gaming Chair Market Revenue Share (%), by Distribution Channel 2025 & 2033
- Figure 30: Europe Gaming Chair Market Volume Share (%), by Distribution Channel 2025 & 2033
- Figure 31: Europe Gaming Chair Market Revenue (Million), by Country 2025 & 2033
- Figure 32: Europe Gaming Chair Market Volume (K Units), by Country 2025 & 2033
- Figure 33: Europe Gaming Chair Market Revenue Share (%), by Country 2025 & 2033
- Figure 34: Europe Gaming Chair Market Volume Share (%), by Country 2025 & 2033
- Figure 35: Asia Pacific Gaming Chair Market Revenue (Million), by Type 2025 & 2033
- Figure 36: Asia Pacific Gaming Chair Market Volume (K Units), by Type 2025 & 2033
- Figure 37: Asia Pacific Gaming Chair Market Revenue Share (%), by Type 2025 & 2033
- Figure 38: Asia Pacific Gaming Chair Market Volume Share (%), by Type 2025 & 2033
- Figure 39: Asia Pacific Gaming Chair Market Revenue (Million), by End User 2025 & 2033
- Figure 40: Asia Pacific Gaming Chair Market Volume (K Units), by End User 2025 & 2033
- Figure 41: Asia Pacific Gaming Chair Market Revenue Share (%), by End User 2025 & 2033
- Figure 42: Asia Pacific Gaming Chair Market Volume Share (%), by End User 2025 & 2033
- Figure 43: Asia Pacific Gaming Chair Market Revenue (Million), by Distribution Channel 2025 & 2033
- Figure 44: Asia Pacific Gaming Chair Market Volume (K Units), by Distribution Channel 2025 & 2033
- Figure 45: Asia Pacific Gaming Chair Market Revenue Share (%), by Distribution Channel 2025 & 2033
- Figure 46: Asia Pacific Gaming Chair Market Volume Share (%), by Distribution Channel 2025 & 2033
- Figure 47: Asia Pacific Gaming Chair Market Revenue (Million), by Country 2025 & 2033
- Figure 48: Asia Pacific Gaming Chair Market Volume (K Units), by Country 2025 & 2033
- Figure 49: Asia Pacific Gaming Chair Market Revenue Share (%), by Country 2025 & 2033
- Figure 50: Asia Pacific Gaming Chair Market Volume Share (%), by Country 2025 & 2033
- Figure 51: South America Gaming Chair Market Revenue (Million), by Type 2025 & 2033
- Figure 52: South America Gaming Chair Market Volume (K Units), by Type 2025 & 2033
- Figure 53: South America Gaming Chair Market Revenue Share (%), by Type 2025 & 2033
- Figure 54: South America Gaming Chair Market Volume Share (%), by Type 2025 & 2033
- Figure 55: South America Gaming Chair Market Revenue (Million), by End User 2025 & 2033
- Figure 56: South America Gaming Chair Market Volume (K Units), by End User 2025 & 2033
- Figure 57: South America Gaming Chair Market Revenue Share (%), by End User 2025 & 2033
- Figure 58: South America Gaming Chair Market Volume Share (%), by End User 2025 & 2033
- Figure 59: South America Gaming Chair Market Revenue (Million), by Distribution Channel 2025 & 2033
- Figure 60: South America Gaming Chair Market Volume (K Units), by Distribution Channel 2025 & 2033
- Figure 61: South America Gaming Chair Market Revenue Share (%), by Distribution Channel 2025 & 2033
- Figure 62: South America Gaming Chair Market Volume Share (%), by Distribution Channel 2025 & 2033
- Figure 63: South America Gaming Chair Market Revenue (Million), by Country 2025 & 2033
- Figure 64: South America Gaming Chair Market Volume (K Units), by Country 2025 & 2033
- Figure 65: South America Gaming Chair Market Revenue Share (%), by Country 2025 & 2033
- Figure 66: South America Gaming Chair Market Volume Share (%), by Country 2025 & 2033
- Figure 67: Middle East and Africa Gaming Chair Market Revenue (Million), by Type 2025 & 2033
- Figure 68: Middle East and Africa Gaming Chair Market Volume (K Units), by Type 2025 & 2033
- Figure 69: Middle East and Africa Gaming Chair Market Revenue Share (%), by Type 2025 & 2033
- Figure 70: Middle East and Africa Gaming Chair Market Volume Share (%), by Type 2025 & 2033
- Figure 71: Middle East and Africa Gaming Chair Market Revenue (Million), by End User 2025 & 2033
- Figure 72: Middle East and Africa Gaming Chair Market Volume (K Units), by End User 2025 & 2033
- Figure 73: Middle East and Africa Gaming Chair Market Revenue Share (%), by End User 2025 & 2033
- Figure 74: Middle East and Africa Gaming Chair Market Volume Share (%), by End User 2025 & 2033
- Figure 75: Middle East and Africa Gaming Chair Market Revenue (Million), by Distribution Channel 2025 & 2033
- Figure 76: Middle East and Africa Gaming Chair Market Volume (K Units), by Distribution Channel 2025 & 2033
- Figure 77: Middle East and Africa Gaming Chair Market Revenue Share (%), by Distribution Channel 2025 & 2033
- Figure 78: Middle East and Africa Gaming Chair Market Volume Share (%), by Distribution Channel 2025 & 2033
- Figure 79: Middle East and Africa Gaming Chair Market Revenue (Million), by Country 2025 & 2033
- Figure 80: Middle East and Africa Gaming Chair Market Volume (K Units), by Country 2025 & 2033
- Figure 81: Middle East and Africa Gaming Chair Market Revenue Share (%), by Country 2025 & 2033
- Figure 82: Middle East and Africa Gaming Chair Market Volume Share (%), by Country 2025 & 2033
List of Tables
- Table 1: Global Gaming Chair Market Revenue Million Forecast, by Type 2020 & 2033
- Table 2: Global Gaming Chair Market Volume K Units Forecast, by Type 2020 & 2033
- Table 3: Global Gaming Chair Market Revenue Million Forecast, by End User 2020 & 2033
- Table 4: Global Gaming Chair Market Volume K Units Forecast, by End User 2020 & 2033
- Table 5: Global Gaming Chair Market Revenue Million Forecast, by Distribution Channel 2020 & 2033
- Table 6: Global Gaming Chair Market Volume K Units Forecast, by Distribution Channel 2020 & 2033
- Table 7: Global Gaming Chair Market Revenue Million Forecast, by Region 2020 & 2033
- Table 8: Global Gaming Chair Market Volume K Units Forecast, by Region 2020 & 2033
- Table 9: Global Gaming Chair Market Revenue Million Forecast, by Type 2020 & 2033
- Table 10: Global Gaming Chair Market Volume K Units Forecast, by Type 2020 & 2033
- Table 11: Global Gaming Chair Market Revenue Million Forecast, by End User 2020 & 2033
- Table 12: Global Gaming Chair Market Volume K Units Forecast, by End User 2020 & 2033
- Table 13: Global Gaming Chair Market Revenue Million Forecast, by Distribution Channel 2020 & 2033
- Table 14: Global Gaming Chair Market Volume K Units Forecast, by Distribution Channel 2020 & 2033
- Table 15: Global Gaming Chair Market Revenue Million Forecast, by Country 2020 & 2033
- Table 16: Global Gaming Chair Market Volume K Units Forecast, by Country 2020 & 2033
- Table 17: United States Gaming Chair Market Revenue (Million) Forecast, by Application 2020 & 2033
- Table 18: United States Gaming Chair Market Volume (K Units) Forecast, by Application 2020 & 2033
- Table 19: Canada Gaming Chair Market Revenue (Million) Forecast, by Application 2020 & 2033
- Table 20: Canada Gaming Chair Market Volume (K Units) Forecast, by Application 2020 & 2033
- Table 21: Rest of North America Gaming Chair Market Revenue (Million) Forecast, by Application 2020 & 2033
- Table 22: Rest of North America Gaming Chair Market Volume (K Units) Forecast, by Application 2020 & 2033
- Table 23: Global Gaming Chair Market Revenue Million Forecast, by Type 2020 & 2033
- Table 24: Global Gaming Chair Market Volume K Units Forecast, by Type 2020 & 2033
- Table 25: Global Gaming Chair Market Revenue Million Forecast, by End User 2020 & 2033
- Table 26: Global Gaming Chair Market Volume K Units Forecast, by End User 2020 & 2033
- Table 27: Global Gaming Chair Market Revenue Million Forecast, by Distribution Channel 2020 & 2033
- Table 28: Global Gaming Chair Market Volume K Units Forecast, by Distribution Channel 2020 & 2033
- Table 29: Global Gaming Chair Market Revenue Million Forecast, by Country 2020 & 2033
- Table 30: Global Gaming Chair Market Volume K Units Forecast, by Country 2020 & 2033
- Table 31: United Kingdom Gaming Chair Market Revenue (Million) Forecast, by Application 2020 & 2033
- Table 32: United Kingdom Gaming Chair Market Volume (K Units) Forecast, by Application 2020 & 2033
- Table 33: Germany Gaming Chair Market Revenue (Million) Forecast, by Application 2020 & 2033
- Table 34: Germany Gaming Chair Market Volume (K Units) Forecast, by Application 2020 & 2033
- Table 35: Rest of Europe Gaming Chair Market Revenue (Million) Forecast, by Application 2020 & 2033
- Table 36: Rest of Europe Gaming Chair Market Volume (K Units) Forecast, by Application 2020 & 2033
- Table 37: Global Gaming Chair Market Revenue Million Forecast, by Type 2020 & 2033
- Table 38: Global Gaming Chair Market Volume K Units Forecast, by Type 2020 & 2033
- Table 39: Global Gaming Chair Market Revenue Million Forecast, by End User 2020 & 2033
- Table 40: Global Gaming Chair Market Volume K Units Forecast, by End User 2020 & 2033
- Table 41: Global Gaming Chair Market Revenue Million Forecast, by Distribution Channel 2020 & 2033
- Table 42: Global Gaming Chair Market Volume K Units Forecast, by Distribution Channel 2020 & 2033
- Table 43: Global Gaming Chair Market Revenue Million Forecast, by Country 2020 & 2033
- Table 44: Global Gaming Chair Market Volume K Units Forecast, by Country 2020 & 2033
- Table 45: India Gaming Chair Market Revenue (Million) Forecast, by Application 2020 & 2033
- Table 46: India Gaming Chair Market Volume (K Units) Forecast, by Application 2020 & 2033
- Table 47: Japan Gaming Chair Market Revenue (Million) Forecast, by Application 2020 & 2033
- Table 48: Japan Gaming Chair Market Volume (K Units) Forecast, by Application 2020 & 2033
- Table 49: Rest of Asia Pacific Gaming Chair Market Revenue (Million) Forecast, by Application 2020 & 2033
- Table 50: Rest of Asia Pacific Gaming Chair Market Volume (K Units) Forecast, by Application 2020 & 2033
- Table 51: Global Gaming Chair Market Revenue Million Forecast, by Type 2020 & 2033
- Table 52: Global Gaming Chair Market Volume K Units Forecast, by Type 2020 & 2033
- Table 53: Global Gaming Chair Market Revenue Million Forecast, by End User 2020 & 2033
- Table 54: Global Gaming Chair Market Volume K Units Forecast, by End User 2020 & 2033
- Table 55: Global Gaming Chair Market Revenue Million Forecast, by Distribution Channel 2020 & 2033
- Table 56: Global Gaming Chair Market Volume K Units Forecast, by Distribution Channel 2020 & 2033
- Table 57: Global Gaming Chair Market Revenue Million Forecast, by Country 2020 & 2033
- Table 58: Global Gaming Chair Market Volume K Units Forecast, by Country 2020 & 2033
- Table 59: Brazil Gaming Chair Market Revenue (Million) Forecast, by Application 2020 & 2033
- Table 60: Brazil Gaming Chair Market Volume (K Units) Forecast, by Application 2020 & 2033
- Table 61: Peru Gaming Chair Market Revenue (Million) Forecast, by Application 2020 & 2033
- Table 62: Peru Gaming Chair Market Volume (K Units) Forecast, by Application 2020 & 2033
- Table 63: Rest of South America Gaming Chair Market Revenue (Million) Forecast, by Application 2020 & 2033
- Table 64: Rest of South America Gaming Chair Market Volume (K Units) Forecast, by Application 2020 & 2033
- Table 65: Global Gaming Chair Market Revenue Million Forecast, by Type 2020 & 2033
- Table 66: Global Gaming Chair Market Volume K Units Forecast, by Type 2020 & 2033
- Table 67: Global Gaming Chair Market Revenue Million Forecast, by End User 2020 & 2033
- Table 68: Global Gaming Chair Market Volume K Units Forecast, by End User 2020 & 2033
- Table 69: Global Gaming Chair Market Revenue Million Forecast, by Distribution Channel 2020 & 2033
- Table 70: Global Gaming Chair Market Volume K Units Forecast, by Distribution Channel 2020 & 2033
- Table 71: Global Gaming Chair Market Revenue Million Forecast, by Country 2020 & 2033
- Table 72: Global Gaming Chair Market Volume K Units Forecast, by Country 2020 & 2033
- Table 73: Saudi Arabia Gaming Chair Market Revenue (Million) Forecast, by Application 2020 & 2033
- Table 74: Saudi Arabia Gaming Chair Market Volume (K Units) Forecast, by Application 2020 & 2033
- Table 75: United Arab Emirates Gaming Chair Market Revenue (Million) Forecast, by Application 2020 & 2033
- Table 76: United Arab Emirates Gaming Chair Market Volume (K Units) Forecast, by Application 2020 & 2033
- Table 77: Rest of Middle East and Africa Gaming Chair Market Revenue (Million) Forecast, by Application 2020 & 2033
- Table 78: Rest of Middle East and Africa Gaming Chair Market Volume (K Units) Forecast, by Application 2020 & 2033
Frequently Asked Questions
1. What is the projected Compound Annual Growth Rate (CAGR) of the Gaming Chair Market?
The projected CAGR is approximately 8.15%.
2. Which companies are prominent players in the Gaming Chair Market?
Key companies in the market include GT Omega Racing, Corsair, X Rocker, DxRacer USA, Arozzi, AkRacing, Noblechairs, Vertagear, Ace Casual Furniture, Secretlab.
3. What are the main segments of the Gaming Chair Market?
The market segments include Type, End User, Distribution Channel.
4. Can you provide details about the market size?
The market size is estimated to be USD 1.45 Million as of 2022.
5. What are some drivers contributing to market growth?
Technological Advancement booming the industry; Focus on Ergonomics and Comfort.
6. What are the notable trends driving market growth?
Expanding Video Gaming Industry is Driving the Market.
7. Are there any restraints impacting market growth?
High cost; Limited Target Audience.
8. Can you provide examples of recent developments in the market?
August 2022: Cybeart, a Canadian manufacturer of premium gaming accessories, announced the world's first Lord of the Rings Chair on 25th August 2022. In addition to Cybeart's existing range of officially licensed products, the upcoming product line will be a continuation of its ongoing partnership with Warner Bros.
9. What pricing options are available for accessing the report?
Pricing options include single-user, multi-user, and enterprise licenses priced at USD 4750, USD 5250, and USD 8750 respectively.
10. Is the market size provided in terms of value or volume?
The market size is provided in terms of value, measured in Million and volume, measured in K Units.
11. Are there any specific market keywords associated with the report?
Yes, the market keyword associated with the report is "Gaming Chair Market," which aids in identifying and referencing the specific market segment covered.
12. How do I determine which pricing option suits my needs best?
The pricing options vary based on user requirements and access needs. Individual users may opt for single-user licenses, while businesses requiring broader access may choose multi-user or enterprise licenses for cost-effective access to the report.
13. Are there any additional resources or data provided in the Gaming Chair Market report?
While the report offers comprehensive insights, it's advisable to review the specific contents or supplementary materials provided to ascertain if additional resources or data are available.
14. How can I stay updated on further developments or reports in the Gaming Chair Market?
To stay informed about further developments, trends, and reports in the Gaming Chair Market, consider subscribing to industry newsletters, following relevant companies and organizations, or regularly checking reputable industry news sources and publications.
Methodology
Step 1 - Identification of Relevant Samples Size from Population Database


Step 2 - Approaches for Defining Global Market Size (Value, Volume* & Price*)

Note*: In applicable scenarios
Step 3 - Data Sources
Primary Research
- Web Analytics
- Survey Reports
- Research Institute
- Latest Research Reports
- Opinion Leaders
Secondary Research
- Annual Reports
- White Paper
- Latest Press Release
- Industry Association
- Paid Database
- Investor Presentations

Step 4 - Data Triangulation
Involves using different sources of information in order to increase the validity of a study
These sources are likely to be stakeholders in a program - participants, other researchers, program staff, other community members, and so on.
Then we put all data in single framework & apply various statistical tools to find out the dynamic on the market.
During the analysis stage, feedback from the stakeholder groups would be compared to determine areas of agreement as well as areas of divergence