
Key Insights
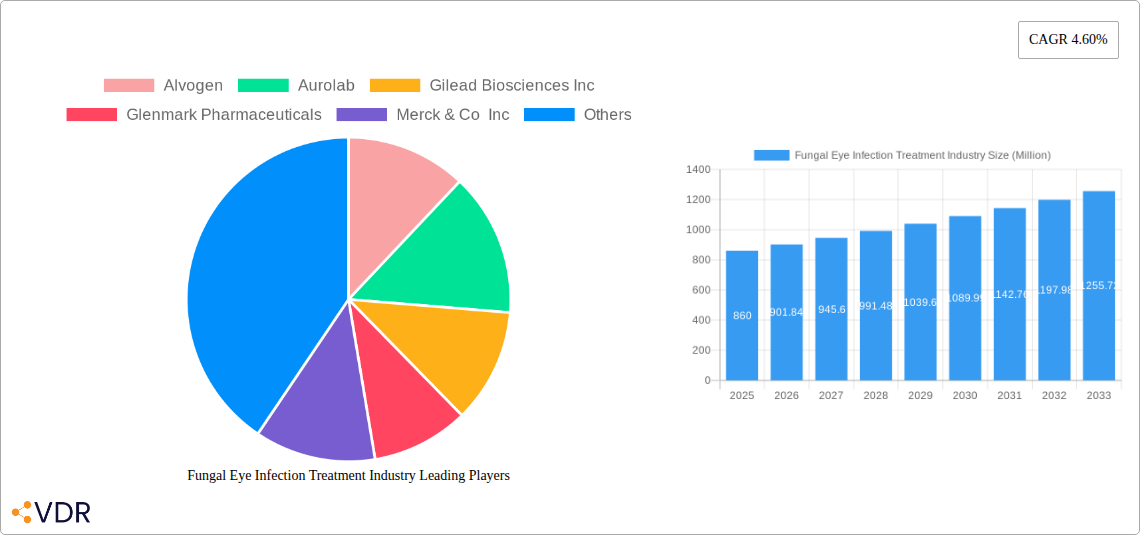
The global fungal eye infection treatment market, valued at $0.86 billion in 2025, is projected to experience robust growth, driven by rising prevalence of fungal keratitis and other ocular mycoses, particularly in regions with high humidity and inadequate hygiene practices. This growth is further fueled by an aging population, increasing susceptibility to opportunistic infections among immunocompromised individuals, and the expanding use of contact lenses. The market's 4.60% CAGR suggests a steady expansion over the forecast period (2025-2033), with significant opportunities emerging in emerging economies experiencing rapid urbanization and improved healthcare infrastructure. Treatment options, including oral, topical, and injectable antifungals, cater to diverse infection severities and patient needs. Hospitals and drug stores represent the primary distribution channels, while patient and healthcare professional segments drive demand. The competitive landscape features established pharmaceutical players like Pfizer, Merck, and Gilead, alongside specialized companies like Leadiant Biosciences and Eyevance Pharmaceuticals, actively involved in R&D and new product launches to cater to the evolving needs of this market. Geographical analysis reveals strong performance in North America and Europe, attributable to high healthcare expenditure and advanced medical facilities. However, Asia-Pacific presents a significant growth opportunity given its large and rapidly growing population base, increasing awareness of fungal eye infections, and improving healthcare access.
The market's growth, however, faces certain constraints. High treatment costs, particularly for specialized formulations, can limit accessibility in low-income regions. The development of antifungal drug resistance also poses a challenge, requiring ongoing research and development of new treatment modalities. Furthermore, the relatively low awareness of fungal eye infections among the general population in some regions can hinder timely diagnosis and treatment. Addressing these challenges through public health initiatives, improved diagnostic capabilities, and the development of more cost-effective treatment options will be crucial for unlocking the full potential of this market and improving patient outcomes.
Fungal Eye Infection Treatment Industry Market Report: 2019-2033
This comprehensive report provides a detailed analysis of the Fungal Eye Infection Treatment industry, encompassing market dynamics, growth trends, regional segmentation, product landscape, competitive analysis, and future outlook. The study period covers 2019-2033, with 2025 as the base and estimated year, and a forecast period of 2025-2033. The report is designed for industry professionals, investors, and researchers seeking in-depth insights into this crucial healthcare sector. The total market size in 2025 is estimated at xx Million.
Fungal Eye Infection Treatment Industry Market Dynamics & Structure
The Fungal Eye Infection Treatment market is characterized by moderate concentration, with key players such as Gilead Biosciences Inc, Merck & Co Inc, Pfizer Inc, and Bausch Health holding significant market share. The market is driven by technological advancements in diagnostics and therapeutics, increasing prevalence of fungal eye infections, and rising healthcare expenditure globally. However, stringent regulatory approvals and high R&D costs pose significant challenges. Mergers and acquisitions (M&A) activity has been moderate in recent years, with xx deals recorded between 2019 and 2024, primarily focused on expanding product portfolios and geographic reach.
- Market Concentration: Moderately concentrated, with top 5 players holding approximately xx% market share in 2025.
- Technological Innovation: Focus on developing novel antifungal agents with improved efficacy and safety profiles. Barriers include high R&D costs and lengthy regulatory processes.
- Regulatory Framework: Stringent regulatory approvals in major markets impact market entry and product lifecycle.
- Competitive Product Substitutes: Limited availability of effective alternatives drives market growth.
- End-User Demographics: Aging population and increasing prevalence of immunocompromised individuals contribute to market expansion.
- M&A Trends: Consolidation expected to continue, driven by strategic partnerships and geographic expansion.
Fungal Eye Infection Treatment Industry Growth Trends & Insights
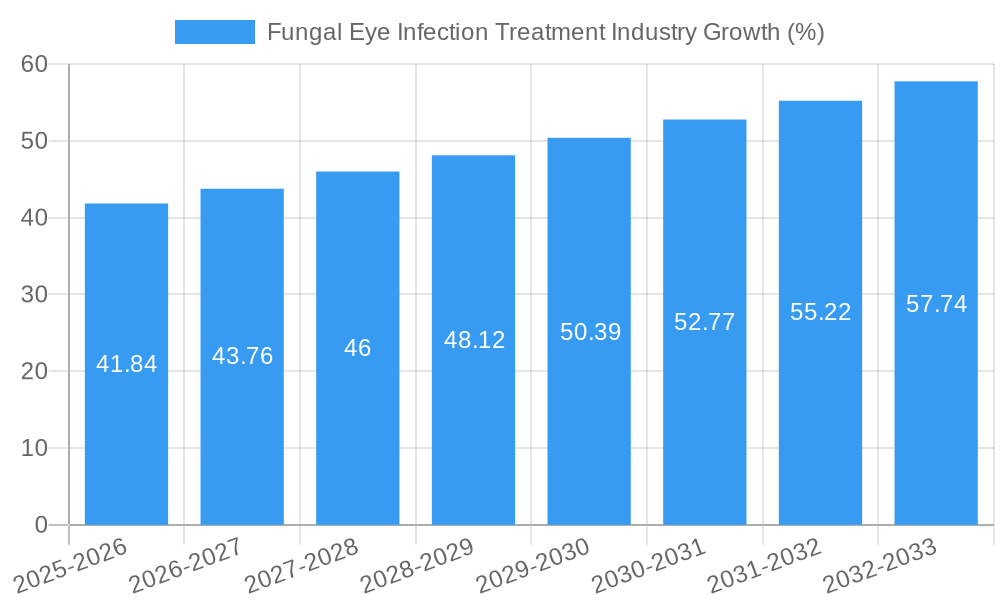
The Fungal Eye Infection Treatment market experienced robust growth during the historical period (2019-2024), with a Compound Annual Growth Rate (CAGR) of xx%. This growth is primarily attributed to the rising incidence of fungal keratitis, candida infections, and other fungal eye diseases. Market penetration of effective treatments remains relatively low, particularly in developing economies. Technological advancements, such as improved diagnostic tools and targeted drug delivery systems, are further driving market expansion. Changes in consumer behavior, including increased awareness of fungal eye infections and proactive healthcare seeking, are also contributing to market growth. The forecast period (2025-2033) is projected to witness continued growth, with a projected CAGR of xx%, driven by factors such as expanding awareness campaigns, increased healthcare spending, and the introduction of innovative therapies. The market is expected to reach xx Million by 2033.
Dominant Regions, Countries, or Segments in Fungal Eye Infection Treatment Industry
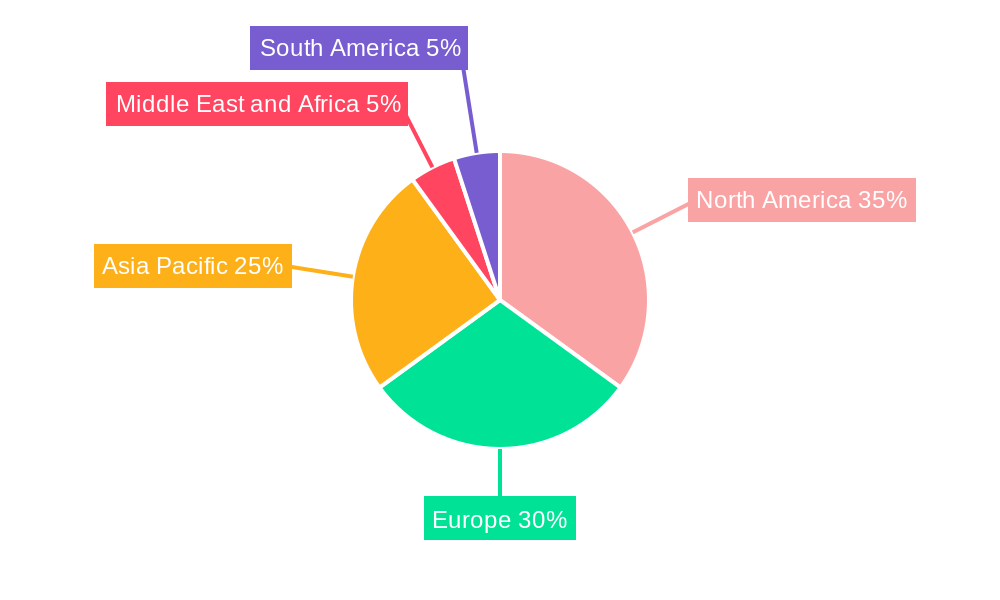
North America currently holds the largest market share in the Fungal Eye Infection Treatment industry, driven by high healthcare expenditure, advanced healthcare infrastructure, and a large patient population. However, Asia-Pacific is expected to witness significant growth in the coming years due to increasing prevalence of fungal eye infections, rising disposable incomes, and expanding healthcare access.
Dominant Segments:
- Distribution Channel: Hospitals currently dominate the distribution channel, followed by drug stores. The "Others" segment, encompassing online pharmacies and specialty clinics, is showing promising growth.
- Route of Administration: Topical administration is the most prevalent route, owing to its ease of application and targeted delivery. Oral and injection routes are used for systemic infections.
- End User: Patients represent the primary end user, followed by healthcare professionals involved in diagnosis and treatment.
Key Drivers:
- North America: High healthcare spending, advanced infrastructure, robust regulatory frameworks.
- Asia-Pacific: Rising prevalence of fungal eye infections, increasing healthcare expenditure, growing awareness.
- Europe: Well-established healthcare systems, increasing geriatric population.
Fungal Eye Infection Treatment Industry Product Landscape
The Fungal Eye Infection Treatment market offers a range of products, including antifungal drops, ointments, and injections. Recent innovations focus on improving drug delivery systems to enhance efficacy and reduce side effects. Products with broad-spectrum antifungal activity and extended release formulations are gaining traction. Unique selling propositions include improved patient compliance, reduced treatment duration, and minimized side effects. Technological advancements in drug delivery systems, such as nanoparticles and liposomes, are enhancing therapeutic effectiveness.
Key Drivers, Barriers & Challenges in Fungal Eye Infection Treatment Industry
Key Drivers:
- Rising prevalence of fungal eye infections due to increased use of contact lenses and immunocompromised individuals.
- Growing healthcare expenditure and improved access to healthcare in emerging economies.
- Technological advancements in diagnostics and treatment.
Challenges & Restraints:
- High R&D costs associated with developing novel antifungal agents.
- Stringent regulatory approvals slowing down product launches.
- Limited availability of effective treatments in certain regions.
- Competition from generic drugs.
Emerging Opportunities in Fungal Eye Infection Treatment Industry
- Untapped markets in developing countries offer significant growth potential.
- Development of personalized medicine approaches targeting specific fungal species.
- Focus on improving patient education and awareness campaigns.
- Exploration of innovative drug delivery systems to enhance efficacy and patient compliance.
Growth Accelerators in the Fungal Eye Infection Treatment Industry
Technological breakthroughs in antifungal drug development, strategic partnerships between pharmaceutical companies and research institutions, and expansion into untapped markets will be key growth drivers in the coming years. Furthermore, collaborations between healthcare professionals and patient advocacy groups will enhance awareness and improve patient outcomes.
Key Players Shaping the Fungal Eye Infection Treatment Market
- Alvogen
- Aurolab
- Gilead Biosciences Inc
- Glenmark Pharmaceuticals
- Merck & Co Inc
- Leadiant Biosciences
- Pfizer Inc
- Bausch Health
- Eyevance Pharmaceuticals LLC
- Novo Holdings A/S (Xellia Pharmaceuticals)
Notable Milestones in Fungal Eye Infection Treatment Industry Sector
- 2021: Launch of a novel antifungal agent with improved efficacy.
- 2022: Acquisition of a smaller pharmaceutical company specializing in fungal eye infection treatments.
- 2023: FDA approval of a new topical antifungal formulation.
- 2024: Publication of key research findings on fungal eye infection pathogenesis.
In-Depth Fungal Eye Infection Treatment Industry Market Outlook
The Fungal Eye Infection Treatment market is poised for continued growth, driven by technological advancements, increased awareness, and expanding healthcare access. Strategic partnerships, innovative product development, and targeted market expansion strategies will play a crucial role in shaping the future of this sector. The market presents significant opportunities for both established players and emerging companies to capitalize on the unmet needs in this crucial area of healthcare.
Fungal Eye Infection Treatment Industry Segmentation
-
1. Route of Administration
- 1.1. Oral
- 1.2. Injection
- 1.3. Topical
-
2. Distribution Channel
- 2.1. Hospitals
- 2.2. Drug Stores
- 2.3. Others
Fungal Eye Infection Treatment Industry Segmentation By Geography
-
1. North America
- 1.1. United States
- 1.2. Canada
- 1.3. Mexico
-
2. Europe
- 2.1. Germany
- 2.2. United Kingdom
- 2.3. France
- 2.4. Italy
- 2.5. Spain
- 2.6. Rest of Europe
-
3. Asia Pacific
- 3.1. China
- 3.2. Japan
- 3.3. India
- 3.4. Australia
- 3.5. South Korea
- 3.6. Rest of Asia Pacific
-
4. Middle East and Africa
- 4.1. GCC
- 4.2. South Africa
- 4.3. Rest of Middle East and Africa
-
5. South America
- 5.1. Brazil
- 5.2. Argentina
- 5.3. Rest of South America
Fungal Eye Infection Treatment Industry REPORT HIGHLIGHTS
| Aspects | Details |
|---|---|
| Study Period | 2019-2033 |
| Base Year | 2024 |
| Estimated Year | 2025 |
| Forecast Period | 2025-2033 |
| Historical Period | 2019-2024 |
| Growth Rate | CAGR of 4.60% from 2019-2033 |
| Segmentation |
|
Table of Contents
- 1. Introduction
- 1.1. Research Scope
- 1.2. Market Segmentation
- 1.3. Research Methodology
- 1.4. Definitions and Assumptions
- 2. Executive Summary
- 2.1. Introduction
- 3. Market Dynamics
- 3.1. Introduction
- 3.2. Market Drivers
- 3.2.1. Growing Burden of Fungal Keratitis Disease; Increasing Research and Development Activities
- 3.3. Market Restrains
- 3.3.1. Loss of Patents and Side Effects Associated with Fungal Keratitis Treatment Drugs
- 3.4. Market Trends
- 3.4.1. Topical Segment is Expected to Show a Significant Growth Rate in the Fungal Keratitis Treatment Market Over the Forecast Period
- 4. Market Factor Analysis
- 4.1. Porters Five Forces
- 4.2. Supply/Value Chain
- 4.3. PESTEL analysis
- 4.4. Market Entropy
- 4.5. Patent/Trademark Analysis
- 5. Global Fungal Eye Infection Treatment Industry Analysis, Insights and Forecast, 2019-2031
- 5.1. Market Analysis, Insights and Forecast - by Route of Administration
- 5.1.1. Oral
- 5.1.2. Injection
- 5.1.3. Topical
- 5.2. Market Analysis, Insights and Forecast - by Distribution Channel
- 5.2.1. Hospitals
- 5.2.2. Drug Stores
- 5.2.3. Others
- 5.3. Market Analysis, Insights and Forecast - by Region
- 5.3.1. North America
- 5.3.2. Europe
- 5.3.3. Asia Pacific
- 5.3.4. Middle East and Africa
- 5.3.5. South America
- 5.1. Market Analysis, Insights and Forecast - by Route of Administration
- 6. North America Fungal Eye Infection Treatment Industry Analysis, Insights and Forecast, 2019-2031
- 6.1. Market Analysis, Insights and Forecast - by Route of Administration
- 6.1.1. Oral
- 6.1.2. Injection
- 6.1.3. Topical
- 6.2. Market Analysis, Insights and Forecast - by Distribution Channel
- 6.2.1. Hospitals
- 6.2.2. Drug Stores
- 6.2.3. Others
- 6.1. Market Analysis, Insights and Forecast - by Route of Administration
- 7. Europe Fungal Eye Infection Treatment Industry Analysis, Insights and Forecast, 2019-2031
- 7.1. Market Analysis, Insights and Forecast - by Route of Administration
- 7.1.1. Oral
- 7.1.2. Injection
- 7.1.3. Topical
- 7.2. Market Analysis, Insights and Forecast - by Distribution Channel
- 7.2.1. Hospitals
- 7.2.2. Drug Stores
- 7.2.3. Others
- 7.1. Market Analysis, Insights and Forecast - by Route of Administration
- 8. Asia Pacific Fungal Eye Infection Treatment Industry Analysis, Insights and Forecast, 2019-2031
- 8.1. Market Analysis, Insights and Forecast - by Route of Administration
- 8.1.1. Oral
- 8.1.2. Injection
- 8.1.3. Topical
- 8.2. Market Analysis, Insights and Forecast - by Distribution Channel
- 8.2.1. Hospitals
- 8.2.2. Drug Stores
- 8.2.3. Others
- 8.1. Market Analysis, Insights and Forecast - by Route of Administration
- 9. Middle East and Africa Fungal Eye Infection Treatment Industry Analysis, Insights and Forecast, 2019-2031
- 9.1. Market Analysis, Insights and Forecast - by Route of Administration
- 9.1.1. Oral
- 9.1.2. Injection
- 9.1.3. Topical
- 9.2. Market Analysis, Insights and Forecast - by Distribution Channel
- 9.2.1. Hospitals
- 9.2.2. Drug Stores
- 9.2.3. Others
- 9.1. Market Analysis, Insights and Forecast - by Route of Administration
- 10. South America Fungal Eye Infection Treatment Industry Analysis, Insights and Forecast, 2019-2031
- 10.1. Market Analysis, Insights and Forecast - by Route of Administration
- 10.1.1. Oral
- 10.1.2. Injection
- 10.1.3. Topical
- 10.2. Market Analysis, Insights and Forecast - by Distribution Channel
- 10.2.1. Hospitals
- 10.2.2. Drug Stores
- 10.2.3. Others
- 10.1. Market Analysis, Insights and Forecast - by Route of Administration
- 11. North America Fungal Eye Infection Treatment Industry Analysis, Insights and Forecast, 2019-2031
- 11.1. Market Analysis, Insights and Forecast - By Country/Sub-region
- 11.1.1 United States
- 11.1.2 Canada
- 11.1.3 Mexico
- 12. Europe Fungal Eye Infection Treatment Industry Analysis, Insights and Forecast, 2019-2031
- 12.1. Market Analysis, Insights and Forecast - By Country/Sub-region
- 12.1.1 Germany
- 12.1.2 United Kingdom
- 12.1.3 France
- 12.1.4 Italy
- 12.1.5 Spain
- 12.1.6 Rest of Europe
- 13. Asia Pacific Fungal Eye Infection Treatment Industry Analysis, Insights and Forecast, 2019-2031
- 13.1. Market Analysis, Insights and Forecast - By Country/Sub-region
- 13.1.1 China
- 13.1.2 Japan
- 13.1.3 India
- 13.1.4 Australia
- 13.1.5 South Korea
- 13.1.6 Rest of Asia Pacific
- 14. Middle East and Africa Fungal Eye Infection Treatment Industry Analysis, Insights and Forecast, 2019-2031
- 14.1. Market Analysis, Insights and Forecast - By Country/Sub-region
- 14.1.1 GCC
- 14.1.2 South Africa
- 14.1.3 Rest of Middle East and Africa
- 15. South America Fungal Eye Infection Treatment Industry Analysis, Insights and Forecast, 2019-2031
- 15.1. Market Analysis, Insights and Forecast - By Country/Sub-region
- 15.1.1 Brazil
- 15.1.2 Argentina
- 15.1.3 Rest of South America
- 16. Competitive Analysis
- 16.1. Global Market Share Analysis 2024
- 16.2. Company Profiles
- 16.2.1 Alvogen
- 16.2.1.1. Overview
- 16.2.1.2. Products
- 16.2.1.3. SWOT Analysis
- 16.2.1.4. Recent Developments
- 16.2.1.5. Financials (Based on Availability)
- 16.2.2 Aurolab
- 16.2.2.1. Overview
- 16.2.2.2. Products
- 16.2.2.3. SWOT Analysis
- 16.2.2.4. Recent Developments
- 16.2.2.5. Financials (Based on Availability)
- 16.2.3 Gilead Biosciences Inc
- 16.2.3.1. Overview
- 16.2.3.2. Products
- 16.2.3.3. SWOT Analysis
- 16.2.3.4. Recent Developments
- 16.2.3.5. Financials (Based on Availability)
- 16.2.4 Glenmark Pharmaceuticals
- 16.2.4.1. Overview
- 16.2.4.2. Products
- 16.2.4.3. SWOT Analysis
- 16.2.4.4. Recent Developments
- 16.2.4.5. Financials (Based on Availability)
- 16.2.5 Merck & Co Inc
- 16.2.5.1. Overview
- 16.2.5.2. Products
- 16.2.5.3. SWOT Analysis
- 16.2.5.4. Recent Developments
- 16.2.5.5. Financials (Based on Availability)
- 16.2.6 Leadiant Biosciences
- 16.2.6.1. Overview
- 16.2.6.2. Products
- 16.2.6.3. SWOT Analysis
- 16.2.6.4. Recent Developments
- 16.2.6.5. Financials (Based on Availability)
- 16.2.7 Pfizer Inc
- 16.2.7.1. Overview
- 16.2.7.2. Products
- 16.2.7.3. SWOT Analysis
- 16.2.7.4. Recent Developments
- 16.2.7.5. Financials (Based on Availability)
- 16.2.8 Bausch Health
- 16.2.8.1. Overview
- 16.2.8.2. Products
- 16.2.8.3. SWOT Analysis
- 16.2.8.4. Recent Developments
- 16.2.8.5. Financials (Based on Availability)
- 16.2.9 Eyevance Pharmaceuticals LLC
- 16.2.9.1. Overview
- 16.2.9.2. Products
- 16.2.9.3. SWOT Analysis
- 16.2.9.4. Recent Developments
- 16.2.9.5. Financials (Based on Availability)
- 16.2.10 Novo Holdings A/S (Xellia Pharmaceuticals)
- 16.2.10.1. Overview
- 16.2.10.2. Products
- 16.2.10.3. SWOT Analysis
- 16.2.10.4. Recent Developments
- 16.2.10.5. Financials (Based on Availability)
- 16.2.1 Alvogen
List of Figures
- Figure 1: Global Fungal Eye Infection Treatment Industry Revenue Breakdown (Million, %) by Region 2024 & 2032
- Figure 2: Global Fungal Eye Infection Treatment Industry Volume Breakdown (K Units, %) by Region 2024 & 2032
- Figure 3: North America Fungal Eye Infection Treatment Industry Revenue (Million), by Country 2024 & 2032
- Figure 4: North America Fungal Eye Infection Treatment Industry Volume (K Units), by Country 2024 & 2032
- Figure 5: North America Fungal Eye Infection Treatment Industry Revenue Share (%), by Country 2024 & 2032
- Figure 6: North America Fungal Eye Infection Treatment Industry Volume Share (%), by Country 2024 & 2032
- Figure 7: Europe Fungal Eye Infection Treatment Industry Revenue (Million), by Country 2024 & 2032
- Figure 8: Europe Fungal Eye Infection Treatment Industry Volume (K Units), by Country 2024 & 2032
- Figure 9: Europe Fungal Eye Infection Treatment Industry Revenue Share (%), by Country 2024 & 2032
- Figure 10: Europe Fungal Eye Infection Treatment Industry Volume Share (%), by Country 2024 & 2032
- Figure 11: Asia Pacific Fungal Eye Infection Treatment Industry Revenue (Million), by Country 2024 & 2032
- Figure 12: Asia Pacific Fungal Eye Infection Treatment Industry Volume (K Units), by Country 2024 & 2032
- Figure 13: Asia Pacific Fungal Eye Infection Treatment Industry Revenue Share (%), by Country 2024 & 2032
- Figure 14: Asia Pacific Fungal Eye Infection Treatment Industry Volume Share (%), by Country 2024 & 2032
- Figure 15: Middle East and Africa Fungal Eye Infection Treatment Industry Revenue (Million), by Country 2024 & 2032
- Figure 16: Middle East and Africa Fungal Eye Infection Treatment Industry Volume (K Units), by Country 2024 & 2032
- Figure 17: Middle East and Africa Fungal Eye Infection Treatment Industry Revenue Share (%), by Country 2024 & 2032
- Figure 18: Middle East and Africa Fungal Eye Infection Treatment Industry Volume Share (%), by Country 2024 & 2032
- Figure 19: South America Fungal Eye Infection Treatment Industry Revenue (Million), by Country 2024 & 2032
- Figure 20: South America Fungal Eye Infection Treatment Industry Volume (K Units), by Country 2024 & 2032
- Figure 21: South America Fungal Eye Infection Treatment Industry Revenue Share (%), by Country 2024 & 2032
- Figure 22: South America Fungal Eye Infection Treatment Industry Volume Share (%), by Country 2024 & 2032
- Figure 23: North America Fungal Eye Infection Treatment Industry Revenue (Million), by Route of Administration 2024 & 2032
- Figure 24: North America Fungal Eye Infection Treatment Industry Volume (K Units), by Route of Administration 2024 & 2032
- Figure 25: North America Fungal Eye Infection Treatment Industry Revenue Share (%), by Route of Administration 2024 & 2032
- Figure 26: North America Fungal Eye Infection Treatment Industry Volume Share (%), by Route of Administration 2024 & 2032
- Figure 27: North America Fungal Eye Infection Treatment Industry Revenue (Million), by Distribution Channel 2024 & 2032
- Figure 28: North America Fungal Eye Infection Treatment Industry Volume (K Units), by Distribution Channel 2024 & 2032
- Figure 29: North America Fungal Eye Infection Treatment Industry Revenue Share (%), by Distribution Channel 2024 & 2032
- Figure 30: North America Fungal Eye Infection Treatment Industry Volume Share (%), by Distribution Channel 2024 & 2032
- Figure 31: North America Fungal Eye Infection Treatment Industry Revenue (Million), by Country 2024 & 2032
- Figure 32: North America Fungal Eye Infection Treatment Industry Volume (K Units), by Country 2024 & 2032
- Figure 33: North America Fungal Eye Infection Treatment Industry Revenue Share (%), by Country 2024 & 2032
- Figure 34: North America Fungal Eye Infection Treatment Industry Volume Share (%), by Country 2024 & 2032
- Figure 35: Europe Fungal Eye Infection Treatment Industry Revenue (Million), by Route of Administration 2024 & 2032
- Figure 36: Europe Fungal Eye Infection Treatment Industry Volume (K Units), by Route of Administration 2024 & 2032
- Figure 37: Europe Fungal Eye Infection Treatment Industry Revenue Share (%), by Route of Administration 2024 & 2032
- Figure 38: Europe Fungal Eye Infection Treatment Industry Volume Share (%), by Route of Administration 2024 & 2032
- Figure 39: Europe Fungal Eye Infection Treatment Industry Revenue (Million), by Distribution Channel 2024 & 2032
- Figure 40: Europe Fungal Eye Infection Treatment Industry Volume (K Units), by Distribution Channel 2024 & 2032
- Figure 41: Europe Fungal Eye Infection Treatment Industry Revenue Share (%), by Distribution Channel 2024 & 2032
- Figure 42: Europe Fungal Eye Infection Treatment Industry Volume Share (%), by Distribution Channel 2024 & 2032
- Figure 43: Europe Fungal Eye Infection Treatment Industry Revenue (Million), by Country 2024 & 2032
- Figure 44: Europe Fungal Eye Infection Treatment Industry Volume (K Units), by Country 2024 & 2032
- Figure 45: Europe Fungal Eye Infection Treatment Industry Revenue Share (%), by Country 2024 & 2032
- Figure 46: Europe Fungal Eye Infection Treatment Industry Volume Share (%), by Country 2024 & 2032
- Figure 47: Asia Pacific Fungal Eye Infection Treatment Industry Revenue (Million), by Route of Administration 2024 & 2032
- Figure 48: Asia Pacific Fungal Eye Infection Treatment Industry Volume (K Units), by Route of Administration 2024 & 2032
- Figure 49: Asia Pacific Fungal Eye Infection Treatment Industry Revenue Share (%), by Route of Administration 2024 & 2032
- Figure 50: Asia Pacific Fungal Eye Infection Treatment Industry Volume Share (%), by Route of Administration 2024 & 2032
- Figure 51: Asia Pacific Fungal Eye Infection Treatment Industry Revenue (Million), by Distribution Channel 2024 & 2032
- Figure 52: Asia Pacific Fungal Eye Infection Treatment Industry Volume (K Units), by Distribution Channel 2024 & 2032
- Figure 53: Asia Pacific Fungal Eye Infection Treatment Industry Revenue Share (%), by Distribution Channel 2024 & 2032
- Figure 54: Asia Pacific Fungal Eye Infection Treatment Industry Volume Share (%), by Distribution Channel 2024 & 2032
- Figure 55: Asia Pacific Fungal Eye Infection Treatment Industry Revenue (Million), by Country 2024 & 2032
- Figure 56: Asia Pacific Fungal Eye Infection Treatment Industry Volume (K Units), by Country 2024 & 2032
- Figure 57: Asia Pacific Fungal Eye Infection Treatment Industry Revenue Share (%), by Country 2024 & 2032
- Figure 58: Asia Pacific Fungal Eye Infection Treatment Industry Volume Share (%), by Country 2024 & 2032
- Figure 59: Middle East and Africa Fungal Eye Infection Treatment Industry Revenue (Million), by Route of Administration 2024 & 2032
- Figure 60: Middle East and Africa Fungal Eye Infection Treatment Industry Volume (K Units), by Route of Administration 2024 & 2032
- Figure 61: Middle East and Africa Fungal Eye Infection Treatment Industry Revenue Share (%), by Route of Administration 2024 & 2032
- Figure 62: Middle East and Africa Fungal Eye Infection Treatment Industry Volume Share (%), by Route of Administration 2024 & 2032
- Figure 63: Middle East and Africa Fungal Eye Infection Treatment Industry Revenue (Million), by Distribution Channel 2024 & 2032
- Figure 64: Middle East and Africa Fungal Eye Infection Treatment Industry Volume (K Units), by Distribution Channel 2024 & 2032
- Figure 65: Middle East and Africa Fungal Eye Infection Treatment Industry Revenue Share (%), by Distribution Channel 2024 & 2032
- Figure 66: Middle East and Africa Fungal Eye Infection Treatment Industry Volume Share (%), by Distribution Channel 2024 & 2032
- Figure 67: Middle East and Africa Fungal Eye Infection Treatment Industry Revenue (Million), by Country 2024 & 2032
- Figure 68: Middle East and Africa Fungal Eye Infection Treatment Industry Volume (K Units), by Country 2024 & 2032
- Figure 69: Middle East and Africa Fungal Eye Infection Treatment Industry Revenue Share (%), by Country 2024 & 2032
- Figure 70: Middle East and Africa Fungal Eye Infection Treatment Industry Volume Share (%), by Country 2024 & 2032
- Figure 71: South America Fungal Eye Infection Treatment Industry Revenue (Million), by Route of Administration 2024 & 2032
- Figure 72: South America Fungal Eye Infection Treatment Industry Volume (K Units), by Route of Administration 2024 & 2032
- Figure 73: South America Fungal Eye Infection Treatment Industry Revenue Share (%), by Route of Administration 2024 & 2032
- Figure 74: South America Fungal Eye Infection Treatment Industry Volume Share (%), by Route of Administration 2024 & 2032
- Figure 75: South America Fungal Eye Infection Treatment Industry Revenue (Million), by Distribution Channel 2024 & 2032
- Figure 76: South America Fungal Eye Infection Treatment Industry Volume (K Units), by Distribution Channel 2024 & 2032
- Figure 77: South America Fungal Eye Infection Treatment Industry Revenue Share (%), by Distribution Channel 2024 & 2032
- Figure 78: South America Fungal Eye Infection Treatment Industry Volume Share (%), by Distribution Channel 2024 & 2032
- Figure 79: South America Fungal Eye Infection Treatment Industry Revenue (Million), by Country 2024 & 2032
- Figure 80: South America Fungal Eye Infection Treatment Industry Volume (K Units), by Country 2024 & 2032
- Figure 81: South America Fungal Eye Infection Treatment Industry Revenue Share (%), by Country 2024 & 2032
- Figure 82: South America Fungal Eye Infection Treatment Industry Volume Share (%), by Country 2024 & 2032
List of Tables
- Table 1: Global Fungal Eye Infection Treatment Industry Revenue Million Forecast, by Region 2019 & 2032
- Table 2: Global Fungal Eye Infection Treatment Industry Volume K Units Forecast, by Region 2019 & 2032
- Table 3: Global Fungal Eye Infection Treatment Industry Revenue Million Forecast, by Route of Administration 2019 & 2032
- Table 4: Global Fungal Eye Infection Treatment Industry Volume K Units Forecast, by Route of Administration 2019 & 2032
- Table 5: Global Fungal Eye Infection Treatment Industry Revenue Million Forecast, by Distribution Channel 2019 & 2032
- Table 6: Global Fungal Eye Infection Treatment Industry Volume K Units Forecast, by Distribution Channel 2019 & 2032
- Table 7: Global Fungal Eye Infection Treatment Industry Revenue Million Forecast, by Region 2019 & 2032
- Table 8: Global Fungal Eye Infection Treatment Industry Volume K Units Forecast, by Region 2019 & 2032
- Table 9: Global Fungal Eye Infection Treatment Industry Revenue Million Forecast, by Country 2019 & 2032
- Table 10: Global Fungal Eye Infection Treatment Industry Volume K Units Forecast, by Country 2019 & 2032
- Table 11: United States Fungal Eye Infection Treatment Industry Revenue (Million) Forecast, by Application 2019 & 2032
- Table 12: United States Fungal Eye Infection Treatment Industry Volume (K Units) Forecast, by Application 2019 & 2032
- Table 13: Canada Fungal Eye Infection Treatment Industry Revenue (Million) Forecast, by Application 2019 & 2032
- Table 14: Canada Fungal Eye Infection Treatment Industry Volume (K Units) Forecast, by Application 2019 & 2032
- Table 15: Mexico Fungal Eye Infection Treatment Industry Revenue (Million) Forecast, by Application 2019 & 2032
- Table 16: Mexico Fungal Eye Infection Treatment Industry Volume (K Units) Forecast, by Application 2019 & 2032
- Table 17: Global Fungal Eye Infection Treatment Industry Revenue Million Forecast, by Country 2019 & 2032
- Table 18: Global Fungal Eye Infection Treatment Industry Volume K Units Forecast, by Country 2019 & 2032
- Table 19: Germany Fungal Eye Infection Treatment Industry Revenue (Million) Forecast, by Application 2019 & 2032
- Table 20: Germany Fungal Eye Infection Treatment Industry Volume (K Units) Forecast, by Application 2019 & 2032
- Table 21: United Kingdom Fungal Eye Infection Treatment Industry Revenue (Million) Forecast, by Application 2019 & 2032
- Table 22: United Kingdom Fungal Eye Infection Treatment Industry Volume (K Units) Forecast, by Application 2019 & 2032
- Table 23: France Fungal Eye Infection Treatment Industry Revenue (Million) Forecast, by Application 2019 & 2032
- Table 24: France Fungal Eye Infection Treatment Industry Volume (K Units) Forecast, by Application 2019 & 2032
- Table 25: Italy Fungal Eye Infection Treatment Industry Revenue (Million) Forecast, by Application 2019 & 2032
- Table 26: Italy Fungal Eye Infection Treatment Industry Volume (K Units) Forecast, by Application 2019 & 2032
- Table 27: Spain Fungal Eye Infection Treatment Industry Revenue (Million) Forecast, by Application 2019 & 2032
- Table 28: Spain Fungal Eye Infection Treatment Industry Volume (K Units) Forecast, by Application 2019 & 2032
- Table 29: Rest of Europe Fungal Eye Infection Treatment Industry Revenue (Million) Forecast, by Application 2019 & 2032
- Table 30: Rest of Europe Fungal Eye Infection Treatment Industry Volume (K Units) Forecast, by Application 2019 & 2032
- Table 31: Global Fungal Eye Infection Treatment Industry Revenue Million Forecast, by Country 2019 & 2032
- Table 32: Global Fungal Eye Infection Treatment Industry Volume K Units Forecast, by Country 2019 & 2032
- Table 33: China Fungal Eye Infection Treatment Industry Revenue (Million) Forecast, by Application 2019 & 2032
- Table 34: China Fungal Eye Infection Treatment Industry Volume (K Units) Forecast, by Application 2019 & 2032
- Table 35: Japan Fungal Eye Infection Treatment Industry Revenue (Million) Forecast, by Application 2019 & 2032
- Table 36: Japan Fungal Eye Infection Treatment Industry Volume (K Units) Forecast, by Application 2019 & 2032
- Table 37: India Fungal Eye Infection Treatment Industry Revenue (Million) Forecast, by Application 2019 & 2032
- Table 38: India Fungal Eye Infection Treatment Industry Volume (K Units) Forecast, by Application 2019 & 2032
- Table 39: Australia Fungal Eye Infection Treatment Industry Revenue (Million) Forecast, by Application 2019 & 2032
- Table 40: Australia Fungal Eye Infection Treatment Industry Volume (K Units) Forecast, by Application 2019 & 2032
- Table 41: South Korea Fungal Eye Infection Treatment Industry Revenue (Million) Forecast, by Application 2019 & 2032
- Table 42: South Korea Fungal Eye Infection Treatment Industry Volume (K Units) Forecast, by Application 2019 & 2032
- Table 43: Rest of Asia Pacific Fungal Eye Infection Treatment Industry Revenue (Million) Forecast, by Application 2019 & 2032
- Table 44: Rest of Asia Pacific Fungal Eye Infection Treatment Industry Volume (K Units) Forecast, by Application 2019 & 2032
- Table 45: Global Fungal Eye Infection Treatment Industry Revenue Million Forecast, by Country 2019 & 2032
- Table 46: Global Fungal Eye Infection Treatment Industry Volume K Units Forecast, by Country 2019 & 2032
- Table 47: GCC Fungal Eye Infection Treatment Industry Revenue (Million) Forecast, by Application 2019 & 2032
- Table 48: GCC Fungal Eye Infection Treatment Industry Volume (K Units) Forecast, by Application 2019 & 2032
- Table 49: South Africa Fungal Eye Infection Treatment Industry Revenue (Million) Forecast, by Application 2019 & 2032
- Table 50: South Africa Fungal Eye Infection Treatment Industry Volume (K Units) Forecast, by Application 2019 & 2032
- Table 51: Rest of Middle East and Africa Fungal Eye Infection Treatment Industry Revenue (Million) Forecast, by Application 2019 & 2032
- Table 52: Rest of Middle East and Africa Fungal Eye Infection Treatment Industry Volume (K Units) Forecast, by Application 2019 & 2032
- Table 53: Global Fungal Eye Infection Treatment Industry Revenue Million Forecast, by Country 2019 & 2032
- Table 54: Global Fungal Eye Infection Treatment Industry Volume K Units Forecast, by Country 2019 & 2032
- Table 55: Brazil Fungal Eye Infection Treatment Industry Revenue (Million) Forecast, by Application 2019 & 2032
- Table 56: Brazil Fungal Eye Infection Treatment Industry Volume (K Units) Forecast, by Application 2019 & 2032
- Table 57: Argentina Fungal Eye Infection Treatment Industry Revenue (Million) Forecast, by Application 2019 & 2032
- Table 58: Argentina Fungal Eye Infection Treatment Industry Volume (K Units) Forecast, by Application 2019 & 2032
- Table 59: Rest of South America Fungal Eye Infection Treatment Industry Revenue (Million) Forecast, by Application 2019 & 2032
- Table 60: Rest of South America Fungal Eye Infection Treatment Industry Volume (K Units) Forecast, by Application 2019 & 2032
- Table 61: Global Fungal Eye Infection Treatment Industry Revenue Million Forecast, by Route of Administration 2019 & 2032
- Table 62: Global Fungal Eye Infection Treatment Industry Volume K Units Forecast, by Route of Administration 2019 & 2032
- Table 63: Global Fungal Eye Infection Treatment Industry Revenue Million Forecast, by Distribution Channel 2019 & 2032
- Table 64: Global Fungal Eye Infection Treatment Industry Volume K Units Forecast, by Distribution Channel 2019 & 2032
- Table 65: Global Fungal Eye Infection Treatment Industry Revenue Million Forecast, by Country 2019 & 2032
- Table 66: Global Fungal Eye Infection Treatment Industry Volume K Units Forecast, by Country 2019 & 2032
- Table 67: United States Fungal Eye Infection Treatment Industry Revenue (Million) Forecast, by Application 2019 & 2032
- Table 68: United States Fungal Eye Infection Treatment Industry Volume (K Units) Forecast, by Application 2019 & 2032
- Table 69: Canada Fungal Eye Infection Treatment Industry Revenue (Million) Forecast, by Application 2019 & 2032
- Table 70: Canada Fungal Eye Infection Treatment Industry Volume (K Units) Forecast, by Application 2019 & 2032
- Table 71: Mexico Fungal Eye Infection Treatment Industry Revenue (Million) Forecast, by Application 2019 & 2032
- Table 72: Mexico Fungal Eye Infection Treatment Industry Volume (K Units) Forecast, by Application 2019 & 2032
- Table 73: Global Fungal Eye Infection Treatment Industry Revenue Million Forecast, by Route of Administration 2019 & 2032
- Table 74: Global Fungal Eye Infection Treatment Industry Volume K Units Forecast, by Route of Administration 2019 & 2032
- Table 75: Global Fungal Eye Infection Treatment Industry Revenue Million Forecast, by Distribution Channel 2019 & 2032
- Table 76: Global Fungal Eye Infection Treatment Industry Volume K Units Forecast, by Distribution Channel 2019 & 2032
- Table 77: Global Fungal Eye Infection Treatment Industry Revenue Million Forecast, by Country 2019 & 2032
- Table 78: Global Fungal Eye Infection Treatment Industry Volume K Units Forecast, by Country 2019 & 2032
- Table 79: Germany Fungal Eye Infection Treatment Industry Revenue (Million) Forecast, by Application 2019 & 2032
- Table 80: Germany Fungal Eye Infection Treatment Industry Volume (K Units) Forecast, by Application 2019 & 2032
- Table 81: United Kingdom Fungal Eye Infection Treatment Industry Revenue (Million) Forecast, by Application 2019 & 2032
- Table 82: United Kingdom Fungal Eye Infection Treatment Industry Volume (K Units) Forecast, by Application 2019 & 2032
- Table 83: France Fungal Eye Infection Treatment Industry Revenue (Million) Forecast, by Application 2019 & 2032
- Table 84: France Fungal Eye Infection Treatment Industry Volume (K Units) Forecast, by Application 2019 & 2032
- Table 85: Italy Fungal Eye Infection Treatment Industry Revenue (Million) Forecast, by Application 2019 & 2032
- Table 86: Italy Fungal Eye Infection Treatment Industry Volume (K Units) Forecast, by Application 2019 & 2032
- Table 87: Spain Fungal Eye Infection Treatment Industry Revenue (Million) Forecast, by Application 2019 & 2032
- Table 88: Spain Fungal Eye Infection Treatment Industry Volume (K Units) Forecast, by Application 2019 & 2032
- Table 89: Rest of Europe Fungal Eye Infection Treatment Industry Revenue (Million) Forecast, by Application 2019 & 2032
- Table 90: Rest of Europe Fungal Eye Infection Treatment Industry Volume (K Units) Forecast, by Application 2019 & 2032
- Table 91: Global Fungal Eye Infection Treatment Industry Revenue Million Forecast, by Route of Administration 2019 & 2032
- Table 92: Global Fungal Eye Infection Treatment Industry Volume K Units Forecast, by Route of Administration 2019 & 2032
- Table 93: Global Fungal Eye Infection Treatment Industry Revenue Million Forecast, by Distribution Channel 2019 & 2032
- Table 94: Global Fungal Eye Infection Treatment Industry Volume K Units Forecast, by Distribution Channel 2019 & 2032
- Table 95: Global Fungal Eye Infection Treatment Industry Revenue Million Forecast, by Country 2019 & 2032
- Table 96: Global Fungal Eye Infection Treatment Industry Volume K Units Forecast, by Country 2019 & 2032
- Table 97: China Fungal Eye Infection Treatment Industry Revenue (Million) Forecast, by Application 2019 & 2032
- Table 98: China Fungal Eye Infection Treatment Industry Volume (K Units) Forecast, by Application 2019 & 2032
- Table 99: Japan Fungal Eye Infection Treatment Industry Revenue (Million) Forecast, by Application 2019 & 2032
- Table 100: Japan Fungal Eye Infection Treatment Industry Volume (K Units) Forecast, by Application 2019 & 2032
- Table 101: India Fungal Eye Infection Treatment Industry Revenue (Million) Forecast, by Application 2019 & 2032
- Table 102: India Fungal Eye Infection Treatment Industry Volume (K Units) Forecast, by Application 2019 & 2032
- Table 103: Australia Fungal Eye Infection Treatment Industry Revenue (Million) Forecast, by Application 2019 & 2032
- Table 104: Australia Fungal Eye Infection Treatment Industry Volume (K Units) Forecast, by Application 2019 & 2032
- Table 105: South Korea Fungal Eye Infection Treatment Industry Revenue (Million) Forecast, by Application 2019 & 2032
- Table 106: South Korea Fungal Eye Infection Treatment Industry Volume (K Units) Forecast, by Application 2019 & 2032
- Table 107: Rest of Asia Pacific Fungal Eye Infection Treatment Industry Revenue (Million) Forecast, by Application 2019 & 2032
- Table 108: Rest of Asia Pacific Fungal Eye Infection Treatment Industry Volume (K Units) Forecast, by Application 2019 & 2032
- Table 109: Global Fungal Eye Infection Treatment Industry Revenue Million Forecast, by Route of Administration 2019 & 2032
- Table 110: Global Fungal Eye Infection Treatment Industry Volume K Units Forecast, by Route of Administration 2019 & 2032
- Table 111: Global Fungal Eye Infection Treatment Industry Revenue Million Forecast, by Distribution Channel 2019 & 2032
- Table 112: Global Fungal Eye Infection Treatment Industry Volume K Units Forecast, by Distribution Channel 2019 & 2032
- Table 113: Global Fungal Eye Infection Treatment Industry Revenue Million Forecast, by Country 2019 & 2032
- Table 114: Global Fungal Eye Infection Treatment Industry Volume K Units Forecast, by Country 2019 & 2032
- Table 115: GCC Fungal Eye Infection Treatment Industry Revenue (Million) Forecast, by Application 2019 & 2032
- Table 116: GCC Fungal Eye Infection Treatment Industry Volume (K Units) Forecast, by Application 2019 & 2032
- Table 117: South Africa Fungal Eye Infection Treatment Industry Revenue (Million) Forecast, by Application 2019 & 2032
- Table 118: South Africa Fungal Eye Infection Treatment Industry Volume (K Units) Forecast, by Application 2019 & 2032
- Table 119: Rest of Middle East and Africa Fungal Eye Infection Treatment Industry Revenue (Million) Forecast, by Application 2019 & 2032
- Table 120: Rest of Middle East and Africa Fungal Eye Infection Treatment Industry Volume (K Units) Forecast, by Application 2019 & 2032
- Table 121: Global Fungal Eye Infection Treatment Industry Revenue Million Forecast, by Route of Administration 2019 & 2032
- Table 122: Global Fungal Eye Infection Treatment Industry Volume K Units Forecast, by Route of Administration 2019 & 2032
- Table 123: Global Fungal Eye Infection Treatment Industry Revenue Million Forecast, by Distribution Channel 2019 & 2032
- Table 124: Global Fungal Eye Infection Treatment Industry Volume K Units Forecast, by Distribution Channel 2019 & 2032
- Table 125: Global Fungal Eye Infection Treatment Industry Revenue Million Forecast, by Country 2019 & 2032
- Table 126: Global Fungal Eye Infection Treatment Industry Volume K Units Forecast, by Country 2019 & 2032
- Table 127: Brazil Fungal Eye Infection Treatment Industry Revenue (Million) Forecast, by Application 2019 & 2032
- Table 128: Brazil Fungal Eye Infection Treatment Industry Volume (K Units) Forecast, by Application 2019 & 2032
- Table 129: Argentina Fungal Eye Infection Treatment Industry Revenue (Million) Forecast, by Application 2019 & 2032
- Table 130: Argentina Fungal Eye Infection Treatment Industry Volume (K Units) Forecast, by Application 2019 & 2032
- Table 131: Rest of South America Fungal Eye Infection Treatment Industry Revenue (Million) Forecast, by Application 2019 & 2032
- Table 132: Rest of South America Fungal Eye Infection Treatment Industry Volume (K Units) Forecast, by Application 2019 & 2032
Frequently Asked Questions
1. What is the projected Compound Annual Growth Rate (CAGR) of the Fungal Eye Infection Treatment Industry?
The projected CAGR is approximately 4.60%.
2. Which companies are prominent players in the Fungal Eye Infection Treatment Industry?
Key companies in the market include Alvogen, Aurolab, Gilead Biosciences Inc, Glenmark Pharmaceuticals, Merck & Co Inc, Leadiant Biosciences, Pfizer Inc , Bausch Health, Eyevance Pharmaceuticals LLC, Novo Holdings A/S (Xellia Pharmaceuticals).
3. What are the main segments of the Fungal Eye Infection Treatment Industry?
The market segments include Route of Administration, Distribution Channel.
4. Can you provide details about the market size?
The market size is estimated to be USD 0.86 Million as of 2022.
5. What are some drivers contributing to market growth?
Growing Burden of Fungal Keratitis Disease; Increasing Research and Development Activities.
6. What are the notable trends driving market growth?
Topical Segment is Expected to Show a Significant Growth Rate in the Fungal Keratitis Treatment Market Over the Forecast Period.
7. Are there any restraints impacting market growth?
Loss of Patents and Side Effects Associated with Fungal Keratitis Treatment Drugs.
8. Can you provide examples of recent developments in the market?
N/A
9. What pricing options are available for accessing the report?
Pricing options include single-user, multi-user, and enterprise licenses priced at USD 4750, USD 5250, and USD 8750 respectively.
10. Is the market size provided in terms of value or volume?
The market size is provided in terms of value, measured in Million and volume, measured in K Units.
11. Are there any specific market keywords associated with the report?
Yes, the market keyword associated with the report is "Fungal Eye Infection Treatment Industry," which aids in identifying and referencing the specific market segment covered.
12. How do I determine which pricing option suits my needs best?
The pricing options vary based on user requirements and access needs. Individual users may opt for single-user licenses, while businesses requiring broader access may choose multi-user or enterprise licenses for cost-effective access to the report.
13. Are there any additional resources or data provided in the Fungal Eye Infection Treatment Industry report?
While the report offers comprehensive insights, it's advisable to review the specific contents or supplementary materials provided to ascertain if additional resources or data are available.
14. How can I stay updated on further developments or reports in the Fungal Eye Infection Treatment Industry?
To stay informed about further developments, trends, and reports in the Fungal Eye Infection Treatment Industry, consider subscribing to industry newsletters, following relevant companies and organizations, or regularly checking reputable industry news sources and publications.
Methodology
Step 1 - Identification of Relevant Samples Size from Population Database


Step 2 - Approaches for Defining Global Market Size (Value, Volume* & Price*)

Note*: In applicable scenarios
Step 3 - Data Sources
Primary Research
- Web Analytics
- Survey Reports
- Research Institute
- Latest Research Reports
- Opinion Leaders
Secondary Research
- Annual Reports
- White Paper
- Latest Press Release
- Industry Association
- Paid Database
- Investor Presentations

Step 4 - Data Triangulation
Involves using different sources of information in order to increase the validity of a study
These sources are likely to be stakeholders in a program - participants, other researchers, program staff, other community members, and so on.
Then we put all data in single framework & apply various statistical tools to find out the dynamic on the market.
During the analysis stage, feedback from the stakeholder groups would be compared to determine areas of agreement as well as areas of divergence


