
Key Insights
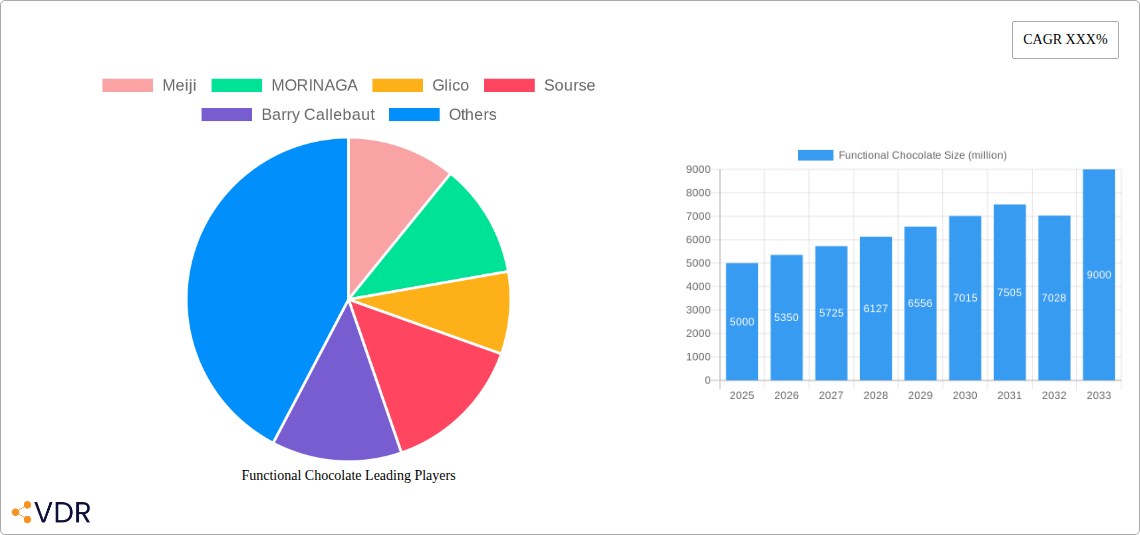
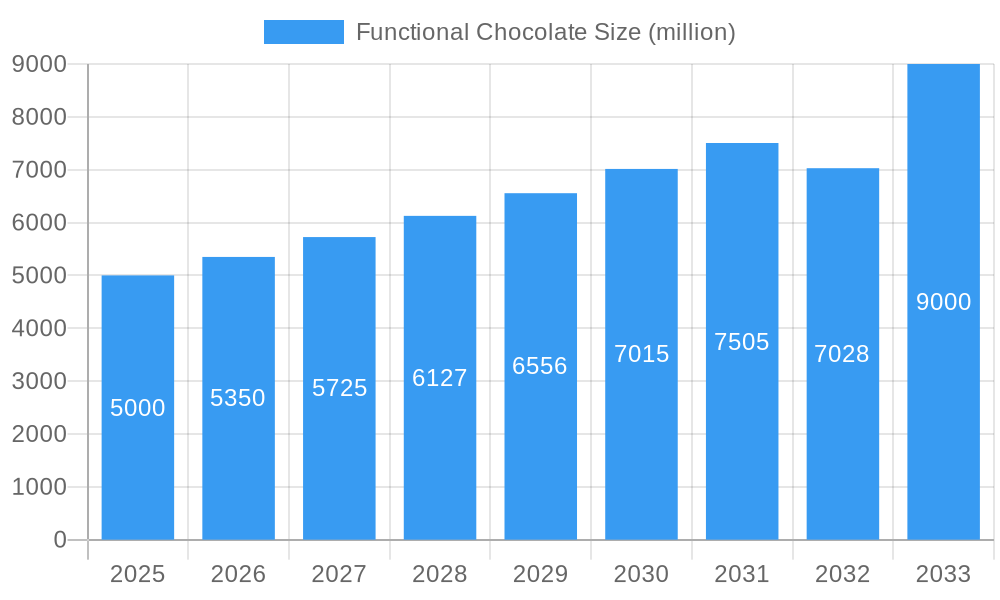
The functional chocolate market is experiencing robust growth, driven by increasing consumer awareness of health and wellness, coupled with a desire for indulgence without compromising on nutritional benefits. The market, estimated at $5 billion in 2025, is projected to exhibit a Compound Annual Growth Rate (CAGR) of 7% from 2025 to 2033, reaching approximately $9 billion by 2033. This growth is fueled by several key drivers: the rising prevalence of chronic diseases prompting consumers to seek functional foods, the increasing demand for convenient and palatable health supplements, and the innovative product development by major players like Meiji, Morinaga, Glico, Nestle, Mars, and Barry Callebaut, who are incorporating ingredients like probiotics, prebiotics, vitamins, and antioxidants into their chocolate offerings. Emerging trends include the rise of plant-based functional chocolate, customized functional chocolate solutions targeting specific health needs, and a focus on sustainable and ethically sourced ingredients.
Functional Chocolate Market Size (In Billion)

However, the market faces certain restraints. High production costs associated with incorporating functional ingredients can lead to premium pricing, potentially limiting market accessibility. Consumer skepticism regarding the efficacy of functional food claims and the potential for negative interactions with existing medications also pose challenges. Furthermore, stringent regulatory requirements for labeling and approval of functional food products can slow down market expansion. Despite these challenges, the overall outlook for the functional chocolate market remains positive, with significant opportunities for growth in untapped markets and through the development of innovative product formulations that effectively address consumer health and wellness needs. Segmentation within the market includes different types of functional additions (e.g., protein, probiotics, antioxidants), forms (bars, powders, drinks), and distribution channels.
Functional Chocolate Company Market Share
Functional Chocolate Market Report: 2019-2033
This comprehensive report provides an in-depth analysis of the global functional chocolate market, offering invaluable insights for industry professionals, investors, and strategic decision-makers. The study period covers 2019-2033, with a base year of 2025 and a forecast period of 2025-2033. We leverage extensive data analysis and expert insights to paint a clear picture of this dynamic market, encompassing market sizing, growth trends, competitive dynamics, and future opportunities. The report delves into specific segments within the broader confectionery market, focusing on the high-growth functional chocolate sector and its parent market, the chocolate confectionery market.
Functional Chocolate Market Dynamics & Structure
The global functional chocolate market, valued at $xx million in 2025, exhibits a moderately concentrated structure with key players like Meiji, Morinaga, Glico, and Nestle SA holding significant market share. Technological innovation, driven by the increasing demand for healthier and functional food products, is a primary growth driver. Stringent regulatory frameworks regarding labeling and ingredient claims influence market dynamics. Competitive substitutes include other functional foods and confectionery items, while the emergence of plant-based and sustainable alternatives presents both challenges and opportunities. Mergers and acquisitions (M&A) activity within the industry is moderate, with xx deals recorded in the historical period (2019-2024). End-user demographics show a growing preference for functional foods among health-conscious consumers, especially millennials and Gen Z.
- Market Concentration: Moderately concentrated, with top 5 players holding xx% market share in 2025.
- Technological Innovation: Focus on incorporating probiotics, prebiotics, vitamins, and adaptogens.
- Regulatory Landscape: Stringent labeling and health claim regulations vary across geographies.
- Competitive Substitutes: Health bars, functional snacks, and other confectionery items.
- M&A Activity: xx deals recorded between 2019 and 2024, with an estimated xx million USD in total transaction value.
- Innovation Barriers: High R&D costs, maintaining product stability, and securing regulatory approvals.
Functional Chocolate Growth Trends & Insights
The global functional chocolate market demonstrates robust growth, exhibiting a CAGR of xx% during the historical period (2019-2024) and a projected CAGR of xx% during the forecast period (2025-2033). This growth is propelled by increasing consumer awareness of health and wellness, rising disposable incomes in developing economies, and the expanding product portfolio of functional chocolate. Market penetration is currently at xx% in developed markets and expected to reach xx% by 2033. Technological disruptions, such as advancements in ingredient sourcing and processing, contribute to product innovation and improved functionalities. Shifting consumer behaviors toward healthier food choices and personalized nutrition further fuel market expansion. The integration of smart packaging and traceability solutions enhances consumer trust and product transparency. Premiumization and diversification within product offerings are also key factors in accelerating market expansion.
Dominant Regions, Countries, or Segments in Functional Chocolate
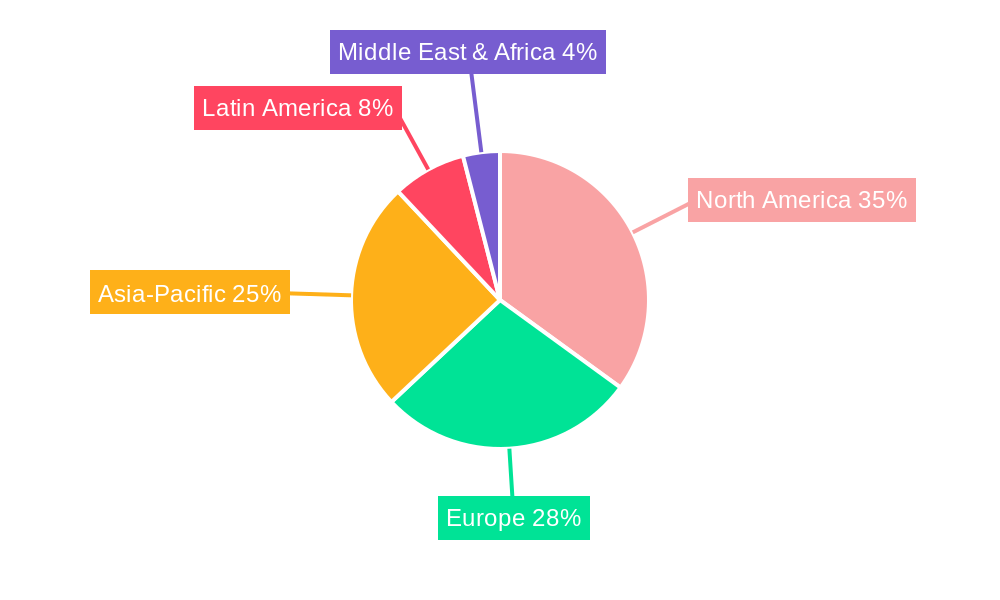
North America currently dominates the functional chocolate market, accounting for xx% of global revenue in 2025, driven by high consumer spending on premium and functional foods, and a well-established health and wellness culture. Europe holds the second largest market share, followed by Asia-Pacific. Within North America, the United States leads, benefiting from robust R&D activities, significant market penetration, and strong consumer demand for premium confectionery. The growth in the Asia-Pacific region is stimulated by rising disposable incomes, growing health consciousness, and increased product availability.
- Key Drivers in North America: Strong consumer demand for premium functional food, established distribution network, and high disposable income.
- Key Drivers in Europe: Growing awareness of health benefits, increasing adoption of plant-based products, and high consumer spending on functional foods.
- Key Drivers in Asia-Pacific: Rising disposable income, growing health consciousness, and increasing product availability in major markets like China and India.
Functional Chocolate Product Landscape
The functional chocolate market offers a wide array of products, including chocolate bars enriched with probiotics, vitamins, minerals, antioxidants, and other beneficial ingredients. Innovations focus on improving taste profiles while maintaining functional benefits. Performance metrics include sustained release of functional ingredients, improved bioavailability, and enhanced shelf life. Unique selling propositions often emphasize natural ingredients, organic certification, or specific health claims, catering to diverse consumer needs and preferences. Technological advancements are focused on incorporating novel delivery systems for active ingredients, such as nanoencapsulation and microencapsulation technologies.
Key Drivers, Barriers & Challenges in Functional Chocolate
Key Drivers:
- Increasing health consciousness and demand for functional foods.
- Growing popularity of personalized nutrition and tailored dietary solutions.
- Advancements in food technology leading to improved functionality and taste.
- Expansion of retail channels and e-commerce platforms.
Challenges & Restraints:
- High production costs associated with functional ingredients.
- Stringent regulations and labeling requirements.
- Maintaining product stability and shelf life while retaining functional properties.
- Intense competition among established players and new entrants. This competition may lead to price wars, affecting profit margins for smaller companies.
Emerging Opportunities in Functional Chocolate
Emerging opportunities lie in expanding into untapped markets in developing countries, developing innovative product formats like functional chocolate drinks and confectionery, creating specialized products targeting specific health needs (e.g., sports nutrition, weight management), and catering to evolving consumer demands for sustainability and ethical sourcing. The incorporation of personalized nutrition strategies, using genomics or microbiome data, represents a significant opportunity for future growth.
Growth Accelerators in the Functional Chocolate Industry
Technological breakthroughs in ingredient extraction and processing will continue to drive innovation. Strategic partnerships between confectionery companies and health supplement providers enhance product development and market reach. Expanding into new markets and expanding distribution networks, especially in emerging economies, provides substantial growth potential. Furthermore, increasing awareness among consumers about functional foods and proactive health strategies fosters sustained market expansion.
Notable Milestones in Functional Chocolate Sector
- 2020: Nestle launched a range of functional chocolate bars incorporating adaptogens.
- 2021: Barry Callebaut unveiled a new chocolate processing technology enhancing the stability of functional ingredients.
- 2022: Meiji introduced a new line of probiotics-enriched functional chocolates for children.
- 2023: A significant merger between two smaller functional chocolate companies resulted in a broadened product portfolio and expanded distribution channels.
- 2024: Increased regulatory scrutiny led to stricter guidelines on health claims for functional chocolate products.
In-Depth Functional Chocolate Market Outlook
The functional chocolate market is poised for significant growth driven by continued technological innovation, expanding consumer awareness, and strategic partnerships. Future opportunities lie in personalized nutrition, sustainable sourcing, and expansion into new product categories. The market will experience an evolution towards more sophisticated products incorporating targeted health benefits and advanced delivery systems. This will create opportunities for companies that can effectively leverage these trends and cater to the evolving needs and preferences of health-conscious consumers.
Functional Chocolate Segmentation
-
1. Application
- 1.1. Online Sales
- 1.2. Offline Sales
-
2. Type
- 2.1. Chocolate Candy
- 2.2. Chocolate Stick
Functional Chocolate Segmentation By Geography
-
1. North America
- 1.1. United States
- 1.2. Canada
- 1.3. Mexico
-
2. South America
- 2.1. Brazil
- 2.2. Argentina
- 2.3. Rest of South America
-
3. Europe
- 3.1. United Kingdom
- 3.2. Germany
- 3.3. France
- 3.4. Italy
- 3.5. Spain
- 3.6. Russia
- 3.7. Benelux
- 3.8. Nordics
- 3.9. Rest of Europe
-
4. Middle East & Africa
- 4.1. Turkey
- 4.2. Israel
- 4.3. GCC
- 4.4. North Africa
- 4.5. South Africa
- 4.6. Rest of Middle East & Africa
-
5. Asia Pacific
- 5.1. China
- 5.2. India
- 5.3. Japan
- 5.4. South Korea
- 5.5. ASEAN
- 5.6. Oceania
- 5.7. Rest of Asia Pacific
Functional Chocolate Regional Market Share
Geographic Coverage of Functional Chocolate
Functional Chocolate REPORT HIGHLIGHTS
| Aspects | Details |
|---|---|
| Study Period | 2020-2034 |
| Base Year | 2025 |
| Estimated Year | 2026 |
| Forecast Period | 2026-2034 |
| Historical Period | 2020-2025 |
| Growth Rate | CAGR of 4.2% from 2020-2034 |
| Segmentation |
|
Table of Contents
- 1. Introduction
- 1.1. Research Scope
- 1.2. Market Segmentation
- 1.3. Research Methodology
- 1.4. Definitions and Assumptions
- 2. Executive Summary
- 2.1. Introduction
- 3. Market Dynamics
- 3.1. Introduction
- 3.2. Market Drivers
- 3.3. Market Restrains
- 3.4. Market Trends
- 4. Market Factor Analysis
- 4.1. Porters Five Forces
- 4.2. Supply/Value Chain
- 4.3. PESTEL analysis
- 4.4. Market Entropy
- 4.5. Patent/Trademark Analysis
- 5. Global Functional Chocolate Analysis, Insights and Forecast, 2020-2032
- 5.1. Market Analysis, Insights and Forecast - by Application
- 5.1.1. Online Sales
- 5.1.2. Offline Sales
- 5.2. Market Analysis, Insights and Forecast - by Type
- 5.2.1. Chocolate Candy
- 5.2.2. Chocolate Stick
- 5.3. Market Analysis, Insights and Forecast - by Region
- 5.3.1. North America
- 5.3.2. South America
- 5.3.3. Europe
- 5.3.4. Middle East & Africa
- 5.3.5. Asia Pacific
- 5.1. Market Analysis, Insights and Forecast - by Application
- 6. North America Functional Chocolate Analysis, Insights and Forecast, 2020-2032
- 6.1. Market Analysis, Insights and Forecast - by Application
- 6.1.1. Online Sales
- 6.1.2. Offline Sales
- 6.2. Market Analysis, Insights and Forecast - by Type
- 6.2.1. Chocolate Candy
- 6.2.2. Chocolate Stick
- 6.1. Market Analysis, Insights and Forecast - by Application
- 7. South America Functional Chocolate Analysis, Insights and Forecast, 2020-2032
- 7.1. Market Analysis, Insights and Forecast - by Application
- 7.1.1. Online Sales
- 7.1.2. Offline Sales
- 7.2. Market Analysis, Insights and Forecast - by Type
- 7.2.1. Chocolate Candy
- 7.2.2. Chocolate Stick
- 7.1. Market Analysis, Insights and Forecast - by Application
- 8. Europe Functional Chocolate Analysis, Insights and Forecast, 2020-2032
- 8.1. Market Analysis, Insights and Forecast - by Application
- 8.1.1. Online Sales
- 8.1.2. Offline Sales
- 8.2. Market Analysis, Insights and Forecast - by Type
- 8.2.1. Chocolate Candy
- 8.2.2. Chocolate Stick
- 8.1. Market Analysis, Insights and Forecast - by Application
- 9. Middle East & Africa Functional Chocolate Analysis, Insights and Forecast, 2020-2032
- 9.1. Market Analysis, Insights and Forecast - by Application
- 9.1.1. Online Sales
- 9.1.2. Offline Sales
- 9.2. Market Analysis, Insights and Forecast - by Type
- 9.2.1. Chocolate Candy
- 9.2.2. Chocolate Stick
- 9.1. Market Analysis, Insights and Forecast - by Application
- 10. Asia Pacific Functional Chocolate Analysis, Insights and Forecast, 2020-2032
- 10.1. Market Analysis, Insights and Forecast - by Application
- 10.1.1. Online Sales
- 10.1.2. Offline Sales
- 10.2. Market Analysis, Insights and Forecast - by Type
- 10.2.1. Chocolate Candy
- 10.2.2. Chocolate Stick
- 10.1. Market Analysis, Insights and Forecast - by Application
- 11. Competitive Analysis
- 11.1. Global Market Share Analysis 2025
- 11.2. Company Profiles
- 11.2.1 Meiji
- 11.2.1.1. Overview
- 11.2.1.2. Products
- 11.2.1.3. SWOT Analysis
- 11.2.1.4. Recent Developments
- 11.2.1.5. Financials (Based on Availability)
- 11.2.2 MORINAGA
- 11.2.2.1. Overview
- 11.2.2.2. Products
- 11.2.2.3. SWOT Analysis
- 11.2.2.4. Recent Developments
- 11.2.2.5. Financials (Based on Availability)
- 11.2.3 Glico
- 11.2.3.1. Overview
- 11.2.3.2. Products
- 11.2.3.3. SWOT Analysis
- 11.2.3.4. Recent Developments
- 11.2.3.5. Financials (Based on Availability)
- 11.2.4 Sourse
- 11.2.4.1. Overview
- 11.2.4.2. Products
- 11.2.4.3. SWOT Analysis
- 11.2.4.4. Recent Developments
- 11.2.4.5. Financials (Based on Availability)
- 11.2.5 Barry Callebaut
- 11.2.5.1. Overview
- 11.2.5.2. Products
- 11.2.5.3. SWOT Analysis
- 11.2.5.4. Recent Developments
- 11.2.5.5. Financials (Based on Availability)
- 11.2.6 Nestle SA
- 11.2.6.1. Overview
- 11.2.6.2. Products
- 11.2.6.3. SWOT Analysis
- 11.2.6.4. Recent Developments
- 11.2.6.5. Financials (Based on Availability)
- 11.2.7 Mars
- 11.2.7.1. Overview
- 11.2.7.2. Products
- 11.2.7.3. SWOT Analysis
- 11.2.7.4. Recent Developments
- 11.2.7.5. Financials (Based on Availability)
- 11.2.8 Kerry
- 11.2.8.1. Overview
- 11.2.8.2. Products
- 11.2.8.3. SWOT Analysis
- 11.2.8.4. Recent Developments
- 11.2.8.5. Financials (Based on Availability)
- 11.2.9 Blommer Chocolate
- 11.2.9.1. Overview
- 11.2.9.2. Products
- 11.2.9.3. SWOT Analysis
- 11.2.9.4. Recent Developments
- 11.2.9.5. Financials (Based on Availability)
- 11.2.10 LOTTE
- 11.2.10.1. Overview
- 11.2.10.2. Products
- 11.2.10.3. SWOT Analysis
- 11.2.10.4. Recent Developments
- 11.2.10.5. Financials (Based on Availability)
- 11.2.1 Meiji
List of Figures
- Figure 1: Global Functional Chocolate Revenue Breakdown (undefined, %) by Region 2025 & 2033
- Figure 2: North America Functional Chocolate Revenue (undefined), by Application 2025 & 2033
- Figure 3: North America Functional Chocolate Revenue Share (%), by Application 2025 & 2033
- Figure 4: North America Functional Chocolate Revenue (undefined), by Type 2025 & 2033
- Figure 5: North America Functional Chocolate Revenue Share (%), by Type 2025 & 2033
- Figure 6: North America Functional Chocolate Revenue (undefined), by Country 2025 & 2033
- Figure 7: North America Functional Chocolate Revenue Share (%), by Country 2025 & 2033
- Figure 8: South America Functional Chocolate Revenue (undefined), by Application 2025 & 2033
- Figure 9: South America Functional Chocolate Revenue Share (%), by Application 2025 & 2033
- Figure 10: South America Functional Chocolate Revenue (undefined), by Type 2025 & 2033
- Figure 11: South America Functional Chocolate Revenue Share (%), by Type 2025 & 2033
- Figure 12: South America Functional Chocolate Revenue (undefined), by Country 2025 & 2033
- Figure 13: South America Functional Chocolate Revenue Share (%), by Country 2025 & 2033
- Figure 14: Europe Functional Chocolate Revenue (undefined), by Application 2025 & 2033
- Figure 15: Europe Functional Chocolate Revenue Share (%), by Application 2025 & 2033
- Figure 16: Europe Functional Chocolate Revenue (undefined), by Type 2025 & 2033
- Figure 17: Europe Functional Chocolate Revenue Share (%), by Type 2025 & 2033
- Figure 18: Europe Functional Chocolate Revenue (undefined), by Country 2025 & 2033
- Figure 19: Europe Functional Chocolate Revenue Share (%), by Country 2025 & 2033
- Figure 20: Middle East & Africa Functional Chocolate Revenue (undefined), by Application 2025 & 2033
- Figure 21: Middle East & Africa Functional Chocolate Revenue Share (%), by Application 2025 & 2033
- Figure 22: Middle East & Africa Functional Chocolate Revenue (undefined), by Type 2025 & 2033
- Figure 23: Middle East & Africa Functional Chocolate Revenue Share (%), by Type 2025 & 2033
- Figure 24: Middle East & Africa Functional Chocolate Revenue (undefined), by Country 2025 & 2033
- Figure 25: Middle East & Africa Functional Chocolate Revenue Share (%), by Country 2025 & 2033
- Figure 26: Asia Pacific Functional Chocolate Revenue (undefined), by Application 2025 & 2033
- Figure 27: Asia Pacific Functional Chocolate Revenue Share (%), by Application 2025 & 2033
- Figure 28: Asia Pacific Functional Chocolate Revenue (undefined), by Type 2025 & 2033
- Figure 29: Asia Pacific Functional Chocolate Revenue Share (%), by Type 2025 & 2033
- Figure 30: Asia Pacific Functional Chocolate Revenue (undefined), by Country 2025 & 2033
- Figure 31: Asia Pacific Functional Chocolate Revenue Share (%), by Country 2025 & 2033
List of Tables
- Table 1: Global Functional Chocolate Revenue undefined Forecast, by Application 2020 & 2033
- Table 2: Global Functional Chocolate Revenue undefined Forecast, by Type 2020 & 2033
- Table 3: Global Functional Chocolate Revenue undefined Forecast, by Region 2020 & 2033
- Table 4: Global Functional Chocolate Revenue undefined Forecast, by Application 2020 & 2033
- Table 5: Global Functional Chocolate Revenue undefined Forecast, by Type 2020 & 2033
- Table 6: Global Functional Chocolate Revenue undefined Forecast, by Country 2020 & 2033
- Table 7: United States Functional Chocolate Revenue (undefined) Forecast, by Application 2020 & 2033
- Table 8: Canada Functional Chocolate Revenue (undefined) Forecast, by Application 2020 & 2033
- Table 9: Mexico Functional Chocolate Revenue (undefined) Forecast, by Application 2020 & 2033
- Table 10: Global Functional Chocolate Revenue undefined Forecast, by Application 2020 & 2033
- Table 11: Global Functional Chocolate Revenue undefined Forecast, by Type 2020 & 2033
- Table 12: Global Functional Chocolate Revenue undefined Forecast, by Country 2020 & 2033
- Table 13: Brazil Functional Chocolate Revenue (undefined) Forecast, by Application 2020 & 2033
- Table 14: Argentina Functional Chocolate Revenue (undefined) Forecast, by Application 2020 & 2033
- Table 15: Rest of South America Functional Chocolate Revenue (undefined) Forecast, by Application 2020 & 2033
- Table 16: Global Functional Chocolate Revenue undefined Forecast, by Application 2020 & 2033
- Table 17: Global Functional Chocolate Revenue undefined Forecast, by Type 2020 & 2033
- Table 18: Global Functional Chocolate Revenue undefined Forecast, by Country 2020 & 2033
- Table 19: United Kingdom Functional Chocolate Revenue (undefined) Forecast, by Application 2020 & 2033
- Table 20: Germany Functional Chocolate Revenue (undefined) Forecast, by Application 2020 & 2033
- Table 21: France Functional Chocolate Revenue (undefined) Forecast, by Application 2020 & 2033
- Table 22: Italy Functional Chocolate Revenue (undefined) Forecast, by Application 2020 & 2033
- Table 23: Spain Functional Chocolate Revenue (undefined) Forecast, by Application 2020 & 2033
- Table 24: Russia Functional Chocolate Revenue (undefined) Forecast, by Application 2020 & 2033
- Table 25: Benelux Functional Chocolate Revenue (undefined) Forecast, by Application 2020 & 2033
- Table 26: Nordics Functional Chocolate Revenue (undefined) Forecast, by Application 2020 & 2033
- Table 27: Rest of Europe Functional Chocolate Revenue (undefined) Forecast, by Application 2020 & 2033
- Table 28: Global Functional Chocolate Revenue undefined Forecast, by Application 2020 & 2033
- Table 29: Global Functional Chocolate Revenue undefined Forecast, by Type 2020 & 2033
- Table 30: Global Functional Chocolate Revenue undefined Forecast, by Country 2020 & 2033
- Table 31: Turkey Functional Chocolate Revenue (undefined) Forecast, by Application 2020 & 2033
- Table 32: Israel Functional Chocolate Revenue (undefined) Forecast, by Application 2020 & 2033
- Table 33: GCC Functional Chocolate Revenue (undefined) Forecast, by Application 2020 & 2033
- Table 34: North Africa Functional Chocolate Revenue (undefined) Forecast, by Application 2020 & 2033
- Table 35: South Africa Functional Chocolate Revenue (undefined) Forecast, by Application 2020 & 2033
- Table 36: Rest of Middle East & Africa Functional Chocolate Revenue (undefined) Forecast, by Application 2020 & 2033
- Table 37: Global Functional Chocolate Revenue undefined Forecast, by Application 2020 & 2033
- Table 38: Global Functional Chocolate Revenue undefined Forecast, by Type 2020 & 2033
- Table 39: Global Functional Chocolate Revenue undefined Forecast, by Country 2020 & 2033
- Table 40: China Functional Chocolate Revenue (undefined) Forecast, by Application 2020 & 2033
- Table 41: India Functional Chocolate Revenue (undefined) Forecast, by Application 2020 & 2033
- Table 42: Japan Functional Chocolate Revenue (undefined) Forecast, by Application 2020 & 2033
- Table 43: South Korea Functional Chocolate Revenue (undefined) Forecast, by Application 2020 & 2033
- Table 44: ASEAN Functional Chocolate Revenue (undefined) Forecast, by Application 2020 & 2033
- Table 45: Oceania Functional Chocolate Revenue (undefined) Forecast, by Application 2020 & 2033
- Table 46: Rest of Asia Pacific Functional Chocolate Revenue (undefined) Forecast, by Application 2020 & 2033
Frequently Asked Questions
1. What is the projected Compound Annual Growth Rate (CAGR) of the Functional Chocolate?
The projected CAGR is approximately 4.2%.
2. Which companies are prominent players in the Functional Chocolate?
Key companies in the market include Meiji, MORINAGA, Glico, Sourse, Barry Callebaut, Nestle SA, Mars, Kerry, Blommer Chocolate, LOTTE.
3. What are the main segments of the Functional Chocolate?
The market segments include Application, Type.
4. Can you provide details about the market size?
The market size is estimated to be USD XXX N/A as of 2022.
5. What are some drivers contributing to market growth?
N/A
6. What are the notable trends driving market growth?
N/A
7. Are there any restraints impacting market growth?
N/A
8. Can you provide examples of recent developments in the market?
N/A
9. What pricing options are available for accessing the report?
Pricing options include single-user, multi-user, and enterprise licenses priced at USD 2900.00, USD 4350.00, and USD 5800.00 respectively.
10. Is the market size provided in terms of value or volume?
The market size is provided in terms of value, measured in N/A.
11. Are there any specific market keywords associated with the report?
Yes, the market keyword associated with the report is "Functional Chocolate," which aids in identifying and referencing the specific market segment covered.
12. How do I determine which pricing option suits my needs best?
The pricing options vary based on user requirements and access needs. Individual users may opt for single-user licenses, while businesses requiring broader access may choose multi-user or enterprise licenses for cost-effective access to the report.
13. Are there any additional resources or data provided in the Functional Chocolate report?
While the report offers comprehensive insights, it's advisable to review the specific contents or supplementary materials provided to ascertain if additional resources or data are available.
14. How can I stay updated on further developments or reports in the Functional Chocolate?
To stay informed about further developments, trends, and reports in the Functional Chocolate, consider subscribing to industry newsletters, following relevant companies and organizations, or regularly checking reputable industry news sources and publications.
Methodology
Step 1 - Identification of Relevant Samples Size from Population Database


Step 2 - Approaches for Defining Global Market Size (Value, Volume* & Price*)

Note*: In applicable scenarios
Step 3 - Data Sources
Primary Research
- Web Analytics
- Survey Reports
- Research Institute
- Latest Research Reports
- Opinion Leaders
Secondary Research
- Annual Reports
- White Paper
- Latest Press Release
- Industry Association
- Paid Database
- Investor Presentations

Step 4 - Data Triangulation
Involves using different sources of information in order to increase the validity of a study
These sources are likely to be stakeholders in a program - participants, other researchers, program staff, other community members, and so on.
Then we put all data in single framework & apply various statistical tools to find out the dynamic on the market.
During the analysis stage, feedback from the stakeholder groups would be compared to determine areas of agreement as well as areas of divergence

