

Key Insights
The global foam glass market is projected to reach $2.82 billion by 2025, exhibiting a Compound Annual Growth Rate (CAGR) of 5.04%. This growth is propelled by escalating demand for advanced insulation in construction, driven by stringent global energy efficiency mandates. Foam glass's superior thermal insulation, fire resistance, and durability position it as a preferred alternative to conventional materials. The market is segmented by type (open-cell, closed-cell) and end-user industry (commercial, residential, industrial), with commercial applications currently leading. Emerging trends include integration into sustainable building practices and specialized uses in infrastructure and transportation. Key restraints include higher production costs compared to alternatives like mineral wool or polystyrene, alongside raw material availability and manufacturing complexities.
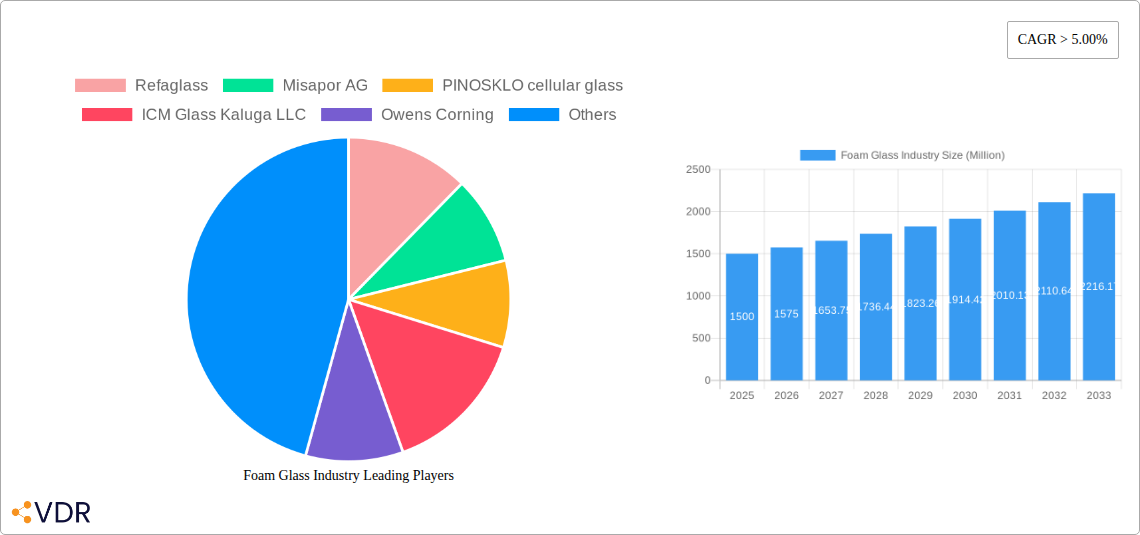
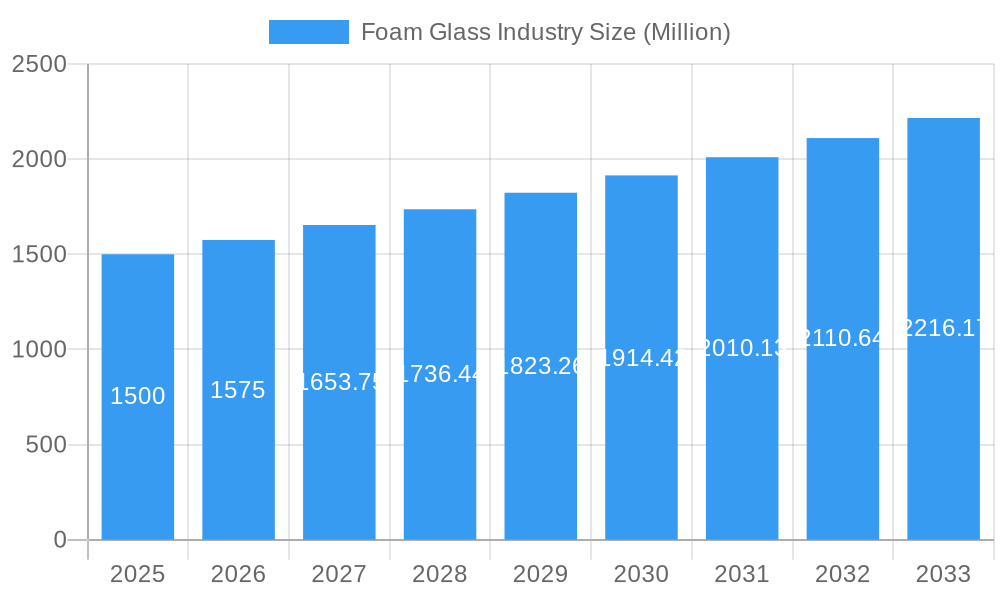
Foam Glass Industry Market Size (In Billion)
Despite these challenges, the long-term outlook for the foam glass market is optimistic, fueled by persistent emphasis on energy efficiency, sustainable construction, and technological advancements to reduce production costs. The Asia-Pacific region, particularly China and India, is expected to see substantial growth due to rapid urbanization and infrastructure development. North America and Europe retain strong positions due to established building codes and high sustainability awareness. The competitive landscape features established and emerging manufacturers, fostering innovation and price competition. Future market success will depend on continued technological innovation, cost-effective production, and effectively communicating the value of foam glass to stakeholders.
Foam Glass Industry Company Market Share
Foam Glass Industry Market Report: 2019-2033
This comprehensive report provides a detailed analysis of the global foam glass industry, encompassing market dynamics, growth trends, regional landscapes, competitive analysis, and future outlook. The study period spans from 2019 to 2033, with 2025 serving as the base and estimated year. This report is essential for industry professionals, investors, and researchers seeking a deep understanding of this evolving market. Market values are presented in million units.
Foam Glass Industry Market Dynamics & Structure
The foam glass market, encompassing open-cell, closed-cell, and other types, is characterized by moderate concentration, with key players like Refaglass, Misapor AG, and Owens Corning holding significant shares. Technological innovation, driven by the need for improved insulation and lightweight materials, is a key driver. Stringent environmental regulations, promoting energy efficiency, further fuel market growth. Competitive substitutes include other insulation materials, such as mineral wool and expanded polystyrene, creating pressure on pricing and innovation. The end-user demographics show a diverse landscape, including commercial, residential, and industrial sectors, with varying demand patterns based on building codes and construction practices. M&A activity has been relatively low in recent years (xx deals in 2024), reflecting the established nature of some segments, but strategic acquisitions are expected to increase as companies seek to expand their product portfolios and geographical reach.
- Market Concentration: Moderately concentrated, with top 5 players holding xx% market share in 2024.
- Technological Innovation: Focus on improving thermal performance, reducing production costs, and enhancing durability.
- Regulatory Framework: Stringent energy efficiency standards are driving demand in key regions.
- Competitive Substitutes: Mineral wool, expanded polystyrene, and other insulation materials pose a competitive challenge.
- End-User Demographics: Significant demand from construction (commercial, residential, industrial), with industrial applications showing the fastest growth.
- M&A Trends: Relatively low activity in recent years, with xx major deals recorded between 2019 and 2024.
Foam Glass Industry Growth Trends & Insights
The global foam glass market experienced a CAGR of xx% during the historical period (2019-2024), reaching a market size of xx million units in 2024. This growth is attributed to rising construction activity, particularly in emerging economies, coupled with increasing demand for energy-efficient buildings. The adoption rate of foam glass insulation is steadily increasing, driven by its superior thermal performance and longevity compared to traditional insulation materials. Technological disruptions, such as advancements in production processes and the development of novel foam glass formulations, are further enhancing market penetration. Consumer behavior shifts towards sustainable and environmentally friendly building materials are contributing positively to market expansion. The forecast period (2025-2033) anticipates a CAGR of xx%, projecting a market size of xx million units by 2033. Market penetration is expected to increase significantly in developing nations, where construction activities are booming.
Dominant Regions, Countries, or Segments in Foam Glass Industry
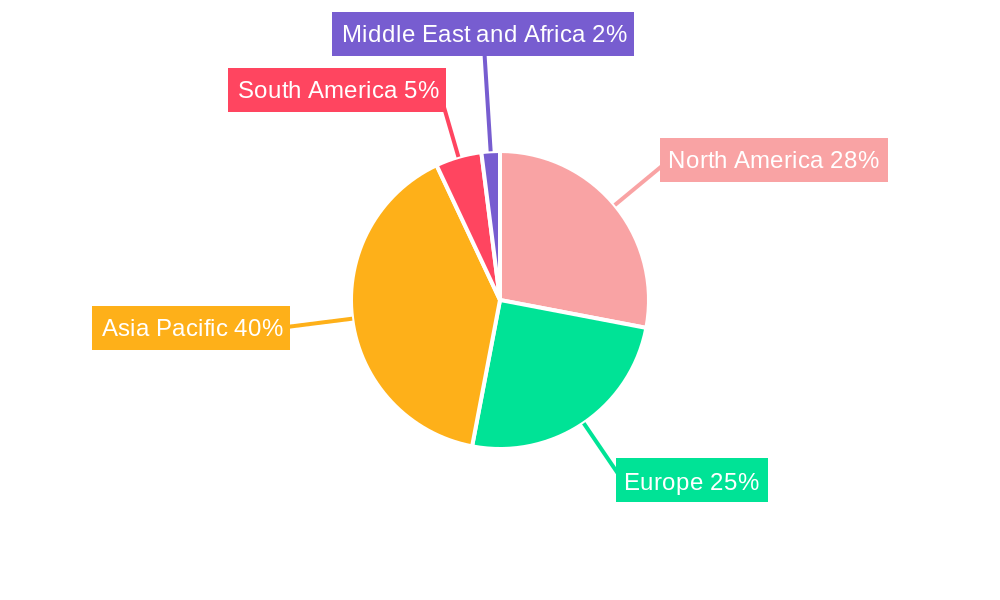
North America currently holds the largest market share in the foam glass industry, driven by strong construction activity and stringent building codes. Europe follows closely, with a significant established market. Within the product segments, closed-cell foam glass dominates, accounting for xx% of the market in 2024 due to its superior moisture resistance and insulation properties. The commercial sector shows strong growth in demand for high-performance building materials.
- Key Drivers:
- Strong construction activity in North America and Europe.
- Increasing adoption of energy-efficient building practices.
- Stringent building codes and environmental regulations.
- Superior thermal performance and durability of foam glass.
- Dominance Factors:
- Established infrastructure and technological advancements in North America.
- High construction spending and government initiatives in Europe.
- Superior insulation properties of closed-cell foam glass.
- Growing demand for energy-efficient buildings in the commercial sector.
Foam Glass Industry Product Landscape
Foam glass products are differentiated by cell structure (open-cell, closed-cell), density, and thermal conductivity. Technological advancements focus on improving insulation performance, enhancing strength, and reducing production costs. Key features include high thermal resistance, excellent water resistance (particularly closed-cell), lightweight properties, and long-term durability. Unique selling propositions often include environmental friendliness and superior lifecycle performance compared to other insulation materials.
Key Drivers, Barriers & Challenges in Foam Glass Industry
Key Drivers: The primary drivers include increasing demand for energy-efficient buildings, stringent building codes, rising construction activity in emerging markets, and the superior thermal performance of foam glass compared to traditional insulation materials. Government initiatives promoting sustainable building practices also contribute significantly.
Key Challenges & Restraints: High production costs compared to some alternative insulation materials pose a significant challenge. Fluctuations in raw material prices (e.g., recycled glass) also affect profitability. Competition from established insulation materials limits market penetration in some regions. Supply chain disruptions can impact production and delivery schedules, impacting the overall market stability.
Emerging Opportunities in Foam Glass Industry
Untapped markets in developing economies, particularly in Asia and Latin America, present substantial growth opportunities. The increasing adoption of foam glass in specialized applications, such as cryogenic insulation and fire protection, represents a significant opportunity. Innovation in sustainable manufacturing practices and recycling technologies can improve the environmental footprint and reduce overall production costs. Moreover, expanding into niche markets like specialized insulation for infrastructure projects (e.g., pipelines and railways) offer potential for market expansion.
Growth Accelerators in the Foam Glass Industry
Technological breakthroughs in production processes, leading to reduced costs and enhanced product performance, are crucial growth catalysts. Strategic partnerships between foam glass manufacturers and construction companies can facilitate market penetration. Expanding into new geographical markets and targeting specific industry segments with tailored products can drive further market expansion.
Key Players Shaping the Foam Glass Industry Market
- Refaglass
- Misapor AG
- PINOSKLO cellular glass
- ICM Glass Kaluga LLC
- Owens Corning
- GEOCELL Schaumglas GmbH
- AeroAggregates of North America LLC
- Glapor Werk Mitterteich GmbH
- Glevel
- Styro Ltd
- Anhui Huichang New Material Co Ltd
- Ningbo Yoyo Foam Glass Co Ltd
- Zhejiang Zhenshen Insulation Technology Corp
- Polydros SA
- Uusioaines Oy
Notable Milestones in Foam Glass Industry Sector
- 2021: Refaglass launched a new, high-performance closed-cell foam glass product.
- 2022: Misapor AG acquired a smaller foam glass manufacturer, expanding its production capacity.
- 2023: Several key players invested in research and development focused on reducing production costs.
- 2024: New industry standards for thermal performance were implemented in several key regions. (Further milestones to be added based on data availability)
In-Depth Foam Glass Industry Market Outlook
The foam glass market is poised for continued growth over the forecast period (2025-2033), driven by factors like increasing energy efficiency regulations, growing construction activity, and the inherent advantages of foam glass as an insulation material. Strategic partnerships, investments in R&D, and expansion into new markets will be key to unlocking the full potential of this market. The focus on sustainability and the development of innovative applications will further shape the industry's trajectory.
Foam Glass Industry Segmentation
-
1. Type
- 1.1. Open Cell
- 1.2. Closed Cell
- 1.3. Other Types
-
2. End-user Industry
- 2.1. Commercial
- 2.2. Residential
- 2.3. Industrial
Foam Glass Industry Segmentation By Geography
-
1. Asia Pacific
- 1.1. China
- 1.2. India
- 1.3. Japan
- 1.4. South Korea
- 1.5. Rest of Asia Pacific
-
2. North America
- 2.1. United States
- 2.2. Canada
- 2.3. Mexico
-
3. Europe
- 3.1. Germany
- 3.2. United Kingdom
- 3.3. France
- 3.4. Italy
- 3.5. Rest of Europe
-
4. South America
- 4.1. Brazil
- 4.2. Argentina
- 4.3. Rest of South America
-
5. Middle East and Africa
- 5.1. Saudi Arabia
- 5.2. South Africa
- 5.3. Rest of Middle East and Africa
Foam Glass Industry Regional Market Share
Geographic Coverage of Foam Glass Industry
Foam Glass Industry REPORT HIGHLIGHTS
| Aspects | Details |
|---|---|
| Study Period | 2020-2034 |
| Base Year | 2025 |
| Estimated Year | 2026 |
| Forecast Period | 2026-2034 |
| Historical Period | 2020-2025 |
| Growth Rate | CAGR of 5.04% from 2020-2034 |
| Segmentation |
|
Table of Contents
- 1. Introduction
- 1.1. Research Scope
- 1.2. Market Segmentation
- 1.3. Research Objective
- 1.4. Definitions and Assumptions
- 2. Executive Summary
- 2.1. Market Snapshot
- 3. Market Dynamics
- 3.1. Market Drivers
- 3.2. Market Restrains
- 3.3. Market Trends
- 3.4. Market Opportunities
- 4. Market Factor Analysis
- 4.1. Porters Five Forces
- 4.1.1. Bargaining Power of Suppliers
- 4.1.2. Bargaining Power of Buyers
- 4.1.3. Threat of New Entrants
- 4.1.4. Threat of Substitutes
- 4.1.5. Competitive Rivalry
- 4.2. PESTEL analysis
- 4.3. BCG Analysis
- 4.3.1. Stars (High Growth, High Market Share)
- 4.3.2. Cash Cows (Low Growth, High Market Share)
- 4.3.3. Question Mark (High Growth, Low Market Share)
- 4.3.4. Dogs (Low Growth, Low Market Share)
- 4.4. Ansoff Matrix Analysis
- 4.5. Supply Chain Analysis
- 4.6. Regulatory Landscape
- 4.7. Current Market Potential and Opportunity Assessment (TAM–SAM–SOM Framework)
- 4.8. VDR Analyst Note
- 4.1. Porters Five Forces
- 5. Market Analysis, Insights and Forecast 2021-2033
- 5.1. Market Analysis, Insights and Forecast - by Type
- 5.1.1. Open Cell
- 5.1.2. Closed Cell
- 5.1.3. Other Types
- 5.2. Market Analysis, Insights and Forecast - by End-user Industry
- 5.2.1. Commercial
- 5.2.2. Residential
- 5.2.3. Industrial
- 5.3. Market Analysis, Insights and Forecast - by Region
- 5.3.1. Asia Pacific
- 5.3.2. North America
- 5.3.3. Europe
- 5.3.4. South America
- 5.3.5. Middle East and Africa
- 5.1. Market Analysis, Insights and Forecast - by Type
- 6. Global Foam Glass Industry Analysis, Insights and Forecast, 2021-2033
- 6.1. Market Analysis, Insights and Forecast - by Type
- 6.1.1. Open Cell
- 6.1.2. Closed Cell
- 6.1.3. Other Types
- 6.2. Market Analysis, Insights and Forecast - by End-user Industry
- 6.2.1. Commercial
- 6.2.2. Residential
- 6.2.3. Industrial
- 6.1. Market Analysis, Insights and Forecast - by Type
- 7. Asia Pacific Foam Glass Industry Analysis, Insights and Forecast, 2021-2033
- 7.1. Market Analysis, Insights and Forecast - by Type
- 7.1.1. Open Cell
- 7.1.2. Closed Cell
- 7.1.3. Other Types
- 7.2. Market Analysis, Insights and Forecast - by End-user Industry
- 7.2.1. Commercial
- 7.2.2. Residential
- 7.2.3. Industrial
- 7.1. Market Analysis, Insights and Forecast - by Type
- 8. North America Foam Glass Industry Analysis, Insights and Forecast, 2021-2033
- 8.1. Market Analysis, Insights and Forecast - by Type
- 8.1.1. Open Cell
- 8.1.2. Closed Cell
- 8.1.3. Other Types
- 8.2. Market Analysis, Insights and Forecast - by End-user Industry
- 8.2.1. Commercial
- 8.2.2. Residential
- 8.2.3. Industrial
- 8.1. Market Analysis, Insights and Forecast - by Type
- 9. Europe Foam Glass Industry Analysis, Insights and Forecast, 2021-2033
- 9.1. Market Analysis, Insights and Forecast - by Type
- 9.1.1. Open Cell
- 9.1.2. Closed Cell
- 9.1.3. Other Types
- 9.2. Market Analysis, Insights and Forecast - by End-user Industry
- 9.2.1. Commercial
- 9.2.2. Residential
- 9.2.3. Industrial
- 9.1. Market Analysis, Insights and Forecast - by Type
- 10. South America Foam Glass Industry Analysis, Insights and Forecast, 2021-2033
- 10.1. Market Analysis, Insights and Forecast - by Type
- 10.1.1. Open Cell
- 10.1.2. Closed Cell
- 10.1.3. Other Types
- 10.2. Market Analysis, Insights and Forecast - by End-user Industry
- 10.2.1. Commercial
- 10.2.2. Residential
- 10.2.3. Industrial
- 10.1. Market Analysis, Insights and Forecast - by Type
- 11. Middle East and Africa Foam Glass Industry Analysis, Insights and Forecast, 2021-2033
- 11.1. Market Analysis, Insights and Forecast - by Type
- 11.1.1. Open Cell
- 11.1.2. Closed Cell
- 11.1.3. Other Types
- 11.2. Market Analysis, Insights and Forecast - by End-user Industry
- 11.2.1. Commercial
- 11.2.2. Residential
- 11.2.3. Industrial
- 11.1. Market Analysis, Insights and Forecast - by Type
- 12. Competitive Analysis
- 12.1. Company Profiles
- 12.1.1 Refaglass
- 12.1.1.1. Company Overview
- 12.1.1.2. Products
- 12.1.1.3. Company Financials
- 12.1.1.4. SWOT Analysis
- 12.1.2 Misapor AG
- 12.1.2.1. Company Overview
- 12.1.2.2. Products
- 12.1.2.3. Company Financials
- 12.1.2.4. SWOT Analysis
- 12.1.3 PINOSKLO cellular glass
- 12.1.3.1. Company Overview
- 12.1.3.2. Products
- 12.1.3.3. Company Financials
- 12.1.3.4. SWOT Analysis
- 12.1.4 ICM Glass Kaluga LLC
- 12.1.4.1. Company Overview
- 12.1.4.2. Products
- 12.1.4.3. Company Financials
- 12.1.4.4. SWOT Analysis
- 12.1.5 Owens Corning
- 12.1.5.1. Company Overview
- 12.1.5.2. Products
- 12.1.5.3. Company Financials
- 12.1.5.4. SWOT Analysis
- 12.1.6 GEOCELL Schaumglas GmbH
- 12.1.6.1. Company Overview
- 12.1.6.2. Products
- 12.1.6.3. Company Financials
- 12.1.6.4. SWOT Analysis
- 12.1.7 AeroAggregates of North America LLC
- 12.1.7.1. Company Overview
- 12.1.7.2. Products
- 12.1.7.3. Company Financials
- 12.1.7.4. SWOT Analysis
- 12.1.8 Glapor Werk Mitterteich GmbH
- 12.1.8.1. Company Overview
- 12.1.8.2. Products
- 12.1.8.3. Company Financials
- 12.1.8.4. SWOT Analysis
- 12.1.9 Glevel
- 12.1.9.1. Company Overview
- 12.1.9.2. Products
- 12.1.9.3. Company Financials
- 12.1.9.4. SWOT Analysis
- 12.1.10 Styro Ltd
- 12.1.10.1. Company Overview
- 12.1.10.2. Products
- 12.1.10.3. Company Financials
- 12.1.10.4. SWOT Analysis
- 12.1.11 Anhui Huichang New Material Co Ltd
- 12.1.11.1. Company Overview
- 12.1.11.2. Products
- 12.1.11.3. Company Financials
- 12.1.11.4. SWOT Analysis
- 12.1.12 Ningbo Yoyo Foam Glass Co Ltd
- 12.1.12.1. Company Overview
- 12.1.12.2. Products
- 12.1.12.3. Company Financials
- 12.1.12.4. SWOT Analysis
- 12.1.13 Zhejiang Zhenshen Insulation Technology Corp *List Not Exhaustive
- 12.1.13.1. Company Overview
- 12.1.13.2. Products
- 12.1.13.3. Company Financials
- 12.1.13.4. SWOT Analysis
- 12.1.14 Polydros SA
- 12.1.14.1. Company Overview
- 12.1.14.2. Products
- 12.1.14.3. Company Financials
- 12.1.14.4. SWOT Analysis
- 12.1.15 Uusioaines Oy
- 12.1.15.1. Company Overview
- 12.1.15.2. Products
- 12.1.15.3. Company Financials
- 12.1.15.4. SWOT Analysis
- 12.1.1 Refaglass
- 12.2. Market Entropy
- 12.2.1 Company's Key Areas Served
- 12.2.2 Recent Developments
- 12.3. Company Market Share Analysis 2025
- 12.3.1 Top 5 Companies Market Share Analysis
- 12.3.2 Top 3 Companies Market Share Analysis
- 12.4. List of Potential Customers
- 13. Research Methodology
List of Figures
- Figure 1: Global Foam Glass Industry Revenue Breakdown (billion, %) by Region 2025 & 2033
- Figure 2: Asia Pacific Foam Glass Industry Revenue (billion), by Type 2025 & 2033
- Figure 3: Asia Pacific Foam Glass Industry Revenue Share (%), by Type 2025 & 2033
- Figure 4: Asia Pacific Foam Glass Industry Revenue (billion), by End-user Industry 2025 & 2033
- Figure 5: Asia Pacific Foam Glass Industry Revenue Share (%), by End-user Industry 2025 & 2033
- Figure 6: Asia Pacific Foam Glass Industry Revenue (billion), by Country 2025 & 2033
- Figure 7: Asia Pacific Foam Glass Industry Revenue Share (%), by Country 2025 & 2033
- Figure 8: North America Foam Glass Industry Revenue (billion), by Type 2025 & 2033
- Figure 9: North America Foam Glass Industry Revenue Share (%), by Type 2025 & 2033
- Figure 10: North America Foam Glass Industry Revenue (billion), by End-user Industry 2025 & 2033
- Figure 11: North America Foam Glass Industry Revenue Share (%), by End-user Industry 2025 & 2033
- Figure 12: North America Foam Glass Industry Revenue (billion), by Country 2025 & 2033
- Figure 13: North America Foam Glass Industry Revenue Share (%), by Country 2025 & 2033
- Figure 14: Europe Foam Glass Industry Revenue (billion), by Type 2025 & 2033
- Figure 15: Europe Foam Glass Industry Revenue Share (%), by Type 2025 & 2033
- Figure 16: Europe Foam Glass Industry Revenue (billion), by End-user Industry 2025 & 2033
- Figure 17: Europe Foam Glass Industry Revenue Share (%), by End-user Industry 2025 & 2033
- Figure 18: Europe Foam Glass Industry Revenue (billion), by Country 2025 & 2033
- Figure 19: Europe Foam Glass Industry Revenue Share (%), by Country 2025 & 2033
- Figure 20: South America Foam Glass Industry Revenue (billion), by Type 2025 & 2033
- Figure 21: South America Foam Glass Industry Revenue Share (%), by Type 2025 & 2033
- Figure 22: South America Foam Glass Industry Revenue (billion), by End-user Industry 2025 & 2033
- Figure 23: South America Foam Glass Industry Revenue Share (%), by End-user Industry 2025 & 2033
- Figure 24: South America Foam Glass Industry Revenue (billion), by Country 2025 & 2033
- Figure 25: South America Foam Glass Industry Revenue Share (%), by Country 2025 & 2033
- Figure 26: Middle East and Africa Foam Glass Industry Revenue (billion), by Type 2025 & 2033
- Figure 27: Middle East and Africa Foam Glass Industry Revenue Share (%), by Type 2025 & 2033
- Figure 28: Middle East and Africa Foam Glass Industry Revenue (billion), by End-user Industry 2025 & 2033
- Figure 29: Middle East and Africa Foam Glass Industry Revenue Share (%), by End-user Industry 2025 & 2033
- Figure 30: Middle East and Africa Foam Glass Industry Revenue (billion), by Country 2025 & 2033
- Figure 31: Middle East and Africa Foam Glass Industry Revenue Share (%), by Country 2025 & 2033
List of Tables
- Table 1: Global Foam Glass Industry Revenue billion Forecast, by Type 2020 & 2033
- Table 2: Global Foam Glass Industry Revenue billion Forecast, by End-user Industry 2020 & 2033
- Table 3: Global Foam Glass Industry Revenue billion Forecast, by Region 2020 & 2033
- Table 4: Global Foam Glass Industry Revenue billion Forecast, by Type 2020 & 2033
- Table 5: Global Foam Glass Industry Revenue billion Forecast, by End-user Industry 2020 & 2033
- Table 6: Global Foam Glass Industry Revenue billion Forecast, by Country 2020 & 2033
- Table 7: China Foam Glass Industry Revenue (billion) Forecast, by Application 2020 & 2033
- Table 8: India Foam Glass Industry Revenue (billion) Forecast, by Application 2020 & 2033
- Table 9: Japan Foam Glass Industry Revenue (billion) Forecast, by Application 2020 & 2033
- Table 10: South Korea Foam Glass Industry Revenue (billion) Forecast, by Application 2020 & 2033
- Table 11: Rest of Asia Pacific Foam Glass Industry Revenue (billion) Forecast, by Application 2020 & 2033
- Table 12: Global Foam Glass Industry Revenue billion Forecast, by Type 2020 & 2033
- Table 13: Global Foam Glass Industry Revenue billion Forecast, by End-user Industry 2020 & 2033
- Table 14: Global Foam Glass Industry Revenue billion Forecast, by Country 2020 & 2033
- Table 15: United States Foam Glass Industry Revenue (billion) Forecast, by Application 2020 & 2033
- Table 16: Canada Foam Glass Industry Revenue (billion) Forecast, by Application 2020 & 2033
- Table 17: Mexico Foam Glass Industry Revenue (billion) Forecast, by Application 2020 & 2033
- Table 18: Global Foam Glass Industry Revenue billion Forecast, by Type 2020 & 2033
- Table 19: Global Foam Glass Industry Revenue billion Forecast, by End-user Industry 2020 & 2033
- Table 20: Global Foam Glass Industry Revenue billion Forecast, by Country 2020 & 2033
- Table 21: Germany Foam Glass Industry Revenue (billion) Forecast, by Application 2020 & 2033
- Table 22: United Kingdom Foam Glass Industry Revenue (billion) Forecast, by Application 2020 & 2033
- Table 23: France Foam Glass Industry Revenue (billion) Forecast, by Application 2020 & 2033
- Table 24: Italy Foam Glass Industry Revenue (billion) Forecast, by Application 2020 & 2033
- Table 25: Rest of Europe Foam Glass Industry Revenue (billion) Forecast, by Application 2020 & 2033
- Table 26: Global Foam Glass Industry Revenue billion Forecast, by Type 2020 & 2033
- Table 27: Global Foam Glass Industry Revenue billion Forecast, by End-user Industry 2020 & 2033
- Table 28: Global Foam Glass Industry Revenue billion Forecast, by Country 2020 & 2033
- Table 29: Brazil Foam Glass Industry Revenue (billion) Forecast, by Application 2020 & 2033
- Table 30: Argentina Foam Glass Industry Revenue (billion) Forecast, by Application 2020 & 2033
- Table 31: Rest of South America Foam Glass Industry Revenue (billion) Forecast, by Application 2020 & 2033
- Table 32: Global Foam Glass Industry Revenue billion Forecast, by Type 2020 & 2033
- Table 33: Global Foam Glass Industry Revenue billion Forecast, by End-user Industry 2020 & 2033
- Table 34: Global Foam Glass Industry Revenue billion Forecast, by Country 2020 & 2033
- Table 35: Saudi Arabia Foam Glass Industry Revenue (billion) Forecast, by Application 2020 & 2033
- Table 36: South Africa Foam Glass Industry Revenue (billion) Forecast, by Application 2020 & 2033
- Table 37: Rest of Middle East and Africa Foam Glass Industry Revenue (billion) Forecast, by Application 2020 & 2033
Frequently Asked Questions
1. What is the projected Compound Annual Growth Rate (CAGR) of the Foam Glass Industry?
The projected CAGR is approximately 5.04%.
2. Which companies are prominent players in the Foam Glass Industry?
Key companies in the market include Refaglass, Misapor AG, PINOSKLO cellular glass, ICM Glass Kaluga LLC, Owens Corning, GEOCELL Schaumglas GmbH, AeroAggregates of North America LLC, Glapor Werk Mitterteich GmbH, Glevel, Styro Ltd, Anhui Huichang New Material Co Ltd, Ningbo Yoyo Foam Glass Co Ltd, Zhejiang Zhenshen Insulation Technology Corp *List Not Exhaustive, Polydros SA, Uusioaines Oy.
3. What are the main segments of the Foam Glass Industry?
The market segments include Type, End-user Industry.
4. Can you provide details about the market size?
The market size is estimated to be USD 2.82 billion as of 2022.
5. What are some drivers contributing to market growth?
; Increasing Demand From the Industrial Sector; Other Drivers.
6. What are the notable trends driving market growth?
Industrial Segment to Dominate the Market.
7. Are there any restraints impacting market growth?
; High Capital Investment; Other Restraints.
8. Can you provide examples of recent developments in the market?
N/A
9. What pricing options are available for accessing the report?
Pricing options include single-user, multi-user, and enterprise licenses priced at USD 4750, USD 5250, and USD 8750 respectively.
10. Is the market size provided in terms of value or volume?
The market size is provided in terms of value, measured in billion.
11. Are there any specific market keywords associated with the report?
Yes, the market keyword associated with the report is "Foam Glass Industry," which aids in identifying and referencing the specific market segment covered.
12. How do I determine which pricing option suits my needs best?
The pricing options vary based on user requirements and access needs. Individual users may opt for single-user licenses, while businesses requiring broader access may choose multi-user or enterprise licenses for cost-effective access to the report.
13. Are there any additional resources or data provided in the Foam Glass Industry report?
While the report offers comprehensive insights, it's advisable to review the specific contents or supplementary materials provided to ascertain if additional resources or data are available.
14. How can I stay updated on further developments or reports in the Foam Glass Industry?
To stay informed about further developments, trends, and reports in the Foam Glass Industry, consider subscribing to industry newsletters, following relevant companies and organizations, or regularly checking reputable industry news sources and publications.
Methodology
Step 1 - Identification of Relevant Samples Size from Population Database


Step 2 - Approaches for Defining Global Market Size (Value, Volume* & Price*)

Note*: In applicable scenarios
Step 3 - Data Sources
Primary Research
- Web Analytics
- Survey Reports
- Research Institute
- Latest Research Reports
- Opinion Leaders
Secondary Research
- Annual Reports
- White Paper
- Latest Press Release
- Industry Association
- Paid Database
- Investor Presentations

Step 4 - Data Triangulation
Involves using different sources of information in order to increase the validity of a study
These sources are likely to be stakeholders in a program - participants, other researchers, program staff, other community members, and so on.
Then we put all data in single framework & apply various statistical tools to find out the dynamic on the market.
During the analysis stage, feedback from the stakeholder groups would be compared to determine areas of agreement as well as areas of divergence