
Key Insights
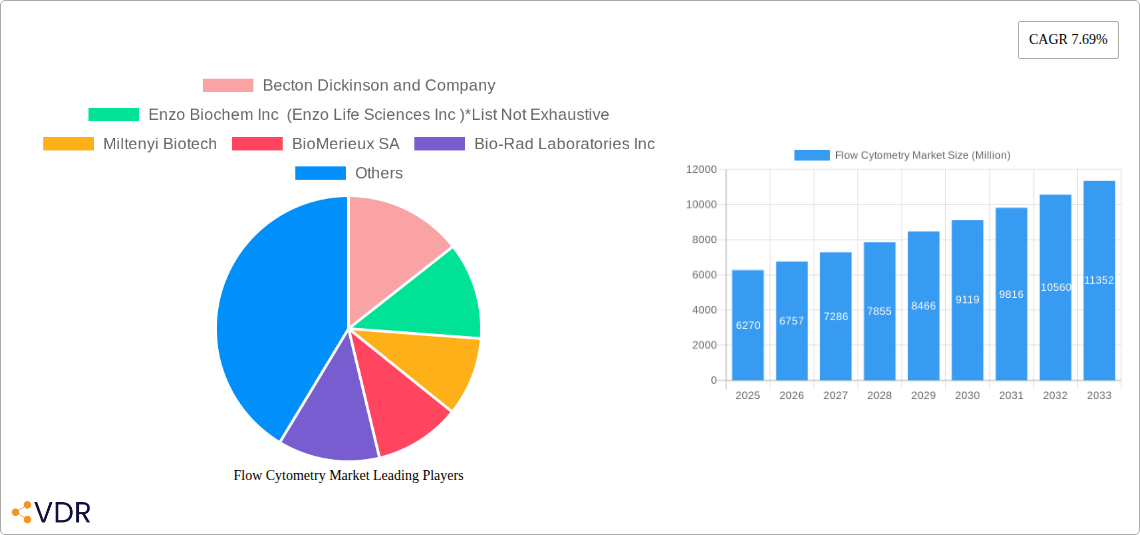
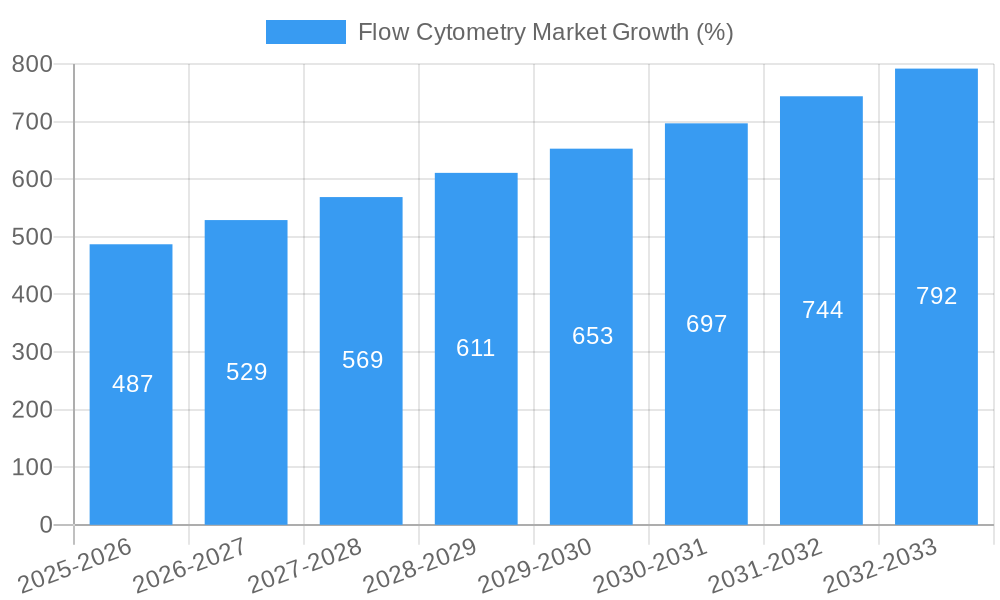
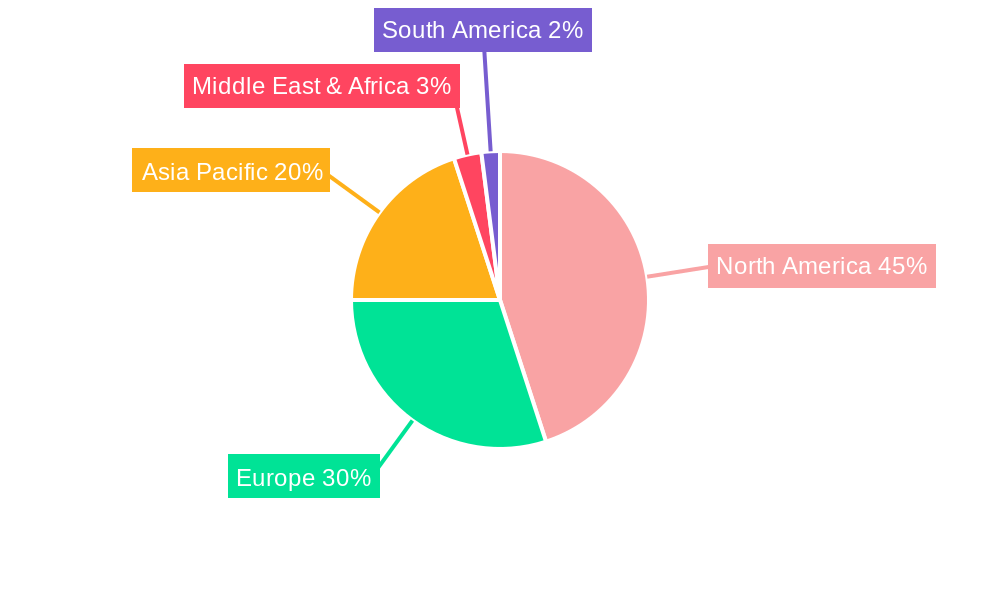
The global flow cytometry market, valued at $6.27 billion in 2025, is projected to experience robust growth, driven by a compound annual growth rate (CAGR) of 7.69% from 2025 to 2033. This expansion is fueled by several key factors. Advancements in flow cytometry technology, particularly in cell-based and bead-based systems, are enabling higher throughput, increased sensitivity, and more sophisticated analyses. The rising prevalence of chronic diseases like cancer, coupled with the increasing demand for personalized medicine, is significantly boosting the adoption of flow cytometry in diagnostics and drug discovery. Furthermore, the expanding research activities in areas such as immunology, oncology, and stem cell therapy are creating a strong demand for sophisticated flow cytometry instruments and services. The market is segmented by end-user (hospitals & clinics, research institutes, pharmaceutical companies, etc.), product type (instruments, kits & reagents, software & services), technology (cell-based, bead-based), and application (oncology, drug discovery, etc.). North America currently holds a significant market share due to the presence of major players and robust healthcare infrastructure. However, the Asia-Pacific region is anticipated to witness the fastest growth during the forecast period, driven by increasing healthcare spending and a growing focus on research and development.
Competition in the flow cytometry market is intense, with major players like Becton Dickinson, Thermo Fisher Scientific, and Danaher Corporation (Beckman Coulter) dominating the market landscape. These companies are constantly innovating and expanding their product portfolios to maintain their competitive edge. Smaller, specialized companies are also focusing on niche applications and technologies to carve out their market share. The overall market growth is expected to be influenced by factors such as the increasing cost of instruments and reagents, regulatory hurdles for new product approvals, and the need for skilled personnel to operate and interpret complex flow cytometry data. Nevertheless, the long-term outlook for the flow cytometry market remains positive, driven by the ongoing advancements in the field and the increasing need for precise and rapid cell analysis across various applications.
Flow Cytometry Market: A Comprehensive Report (2019-2033)
This comprehensive report provides a detailed analysis of the Flow Cytometry market, encompassing market dynamics, growth trends, regional segmentation, product landscape, key players, and future outlook. The study period covers 2019-2033, with 2025 as the base and estimated year, and a forecast period of 2025-2033. The report is designed to provide actionable insights for industry professionals, investors, and researchers seeking to understand and navigate this rapidly evolving market. Market values are presented in million units.
Flow Cytometry Market Dynamics & Structure
The global flow cytometry market is characterized by a moderately concentrated structure, with key players like Becton Dickinson and Company, ThermoFisher Scientific Inc, and Danaher corporation (Beckman Coulter Inc ) holding significant market share. Technological innovation, particularly in software and cloud-based solutions, is a major driver, alongside increasing demand from pharmaceutical and biotechnology companies. Stringent regulatory frameworks influence market entry and product development, while the emergence of alternative technologies presents competitive pressure. Consolidation through mergers and acquisitions (M&A) is also reshaping the landscape. The xx% market share held by the top 5 players indicates a relatively consolidated yet dynamic market.
- Market Concentration: Moderately concentrated, with top 5 players holding xx% market share.
- Technological Innovation: Cloud-based data analysis and automation are driving growth.
- Regulatory Framework: Stringent regulations impact product development and approvals.
- Competitive Substitutes: Alternative technologies pose a moderate competitive threat.
- M&A Activity: A moderate number of M&A deals in recent years, xx deals from 2019-2024.
- End-User Demographics: Growth driven primarily by pharmaceutical, biotech, and research institutions.
Flow Cytometry Market Growth Trends & Insights
The flow cytometry market is experiencing robust growth, driven by factors such as increasing prevalence of chronic diseases, rising research and development activities in the life sciences sector, and technological advancements. The market exhibited a CAGR of xx% during the historical period (2019-2024) and is projected to maintain a CAGR of xx% during the forecast period (2025-2033), reaching a market size of xx Million by 2033. This growth is fueled by rising adoption rates across various end-user segments and significant technological disruptions, particularly in areas like high-throughput screening and automation. Consumer behavior is shifting toward cloud-based solutions and integrated platforms for streamlined workflows. Market penetration is expected to increase significantly in emerging markets.
Dominant Regions, Countries, or Segments in Flow Cytometry Market
North America currently dominates the global flow cytometry market, followed by Europe and Asia Pacific. This dominance is attributed to factors such as well-established healthcare infrastructure, a robust research ecosystem, and substantial investments in life sciences research. Within the market segments, the Pharmaceutical and Biotechnology Companies segment displays the highest growth, driven by increasing drug discovery and development activities. The Instrument segment holds the largest market share by product type due to its high initial investment, but the Kit and Reagent segment shows the highest growth rate. Oncology leads the application segments, reflecting the pivotal role of flow cytometry in cancer diagnosis and treatment.
- Leading Region: North America
- Fastest-Growing Segment (End-User): Pharmaceutical and Biotechnology Companies
- Largest Segment (Product Type): Instrument
- Fastest-Growing Segment (Product Type): Kit and Reagent
- Leading Application: Oncology
Flow Cytometry Market Product Landscape
The flow cytometry market offers a diverse range of instruments, kits, reagents, and software solutions. Recent innovations include high-throughput analyzers, automated systems, and advanced software for data analysis and visualization. These advancements aim to enhance throughput, accuracy, and ease of use. Unique selling propositions focus on improved sensitivity, reduced assay times, and user-friendly interfaces. Companies are integrating AI and machine learning capabilities to improve data analysis and interpretation.
Key Drivers, Barriers & Challenges in Flow Cytometry Market
Key Drivers: The rising prevalence of chronic diseases, increased research funding, and technological advancements are significant drivers. The growing demand for personalized medicine and the adoption of advanced diagnostic techniques further accelerate market growth.
Key Challenges: High instrument costs, stringent regulatory approvals, and the need for skilled personnel are significant challenges. Supply chain disruptions and intense competition from established and emerging players also pose significant hurdles, impacting market growth by an estimated xx%.
Emerging Opportunities in Flow Cytometry Market
Emerging opportunities lie in the development of point-of-care diagnostics, the integration of flow cytometry with other analytical platforms, and expansion into emerging markets with growing healthcare spending. The increasing adoption of cloud-based solutions and advanced data analytics present further opportunities for market expansion.
Growth Accelerators in the Flow Cytometry Market Industry
Technological breakthroughs such as the development of more sensitive and faster flow cytometers are driving growth. Strategic partnerships between instrument manufacturers, reagent suppliers, and software developers are creating integrated solutions. The expansion into new applications, such as immunotherapy and personalized medicine, creates substantial opportunities for market growth.
Key Players Shaping the Flow Cytometry Market Market
- Becton Dickinson and Company
- Enzo Biochem Inc (Enzo Life Sciences Inc)
- Miltenyi Biotech
- BioMerieux SA
- Bio-Rad Laboratories Inc
- Stratedigm Inc
- Sony Biotechnology Inc (Sony Corporation of America)
- Agilent Technologies Inc
- Sysmex Corporation
- Danaher corporation (Beckman Coulter Inc)
- Luminex Corporation
- ThermoFisher Scientific Inc
Notable Milestones in Flow Cytometry Market Sector
- September 2022: Becton, Dickinson, and Company released BD Research Cloud, a cloud-based software solution streamlining flow cytometry workflows.
- November 2022: Sony Corporation released SFA-Life Sciences Cloud Platform, a cloud-based solution for analyzing flow cytometry data, enhancing rare cell identification.
In-Depth Flow Cytometry Market Market Outlook
The flow cytometry market is poised for sustained growth, driven by technological advancements and expanding applications. The increasing integration of AI and machine learning, along with the development of more user-friendly and affordable systems, will contribute to market expansion. Strategic partnerships and collaborations will further accelerate growth, opening up new opportunities for market players. The focus on personalized medicine and the increasing demand for sophisticated diagnostic tools will propel long-term market expansion and lucrative strategic opportunities.
Flow Cytometry Market Segmentation
-
1. Product Type
- 1.1. Instrument
- 1.2. Kit and Reagent
- 1.3. Software and Services
-
2. Technology
- 2.1. Cell-based Flow Cytometry
- 2.2. Bead-based Flow Cytometry
-
3. Application
- 3.1. Oncology
- 3.2. Drug Discovery
- 3.3. Stem Cell Therapy
- 3.4. Organ Transplantation
- 3.5. Hematology
- 3.6. Other Applications
-
4. End-User
- 4.1. Hospitals and Clinics
- 4.2. Academia and Research Institutes
- 4.3. Pharmaceutical and Biotechnology Companies
- 4.4. Other End-Users
Flow Cytometry Market Segmentation By Geography
-
1. North America
- 1.1. United States
- 1.2. Canada
- 1.3. Mexico
-
2. Europe
- 2.1. Germany
- 2.2. United Kingdom
- 2.3. France
- 2.4. Italy
- 2.5. Spain
- 2.6. Rest of Europe
-
3. Asia Pacific
- 3.1. China
- 3.2. Japan
- 3.3. India
- 3.4. Australia
- 3.5. South Korea
- 3.6. Rest of Asia Pacific
-
4. Middle East and Africa
- 4.1. GCC
- 4.2. South Africa
- 4.3. Rest of Middle East and Africa
-
5. South America
- 5.1. Brazil
- 5.2. Argentina
- 5.3. Rest of South America
Flow Cytometry Market REPORT HIGHLIGHTS
| Aspects | Details |
|---|---|
| Study Period | 2019-2033 |
| Base Year | 2024 |
| Estimated Year | 2025 |
| Forecast Period | 2025-2033 |
| Historical Period | 2019-2024 |
| Growth Rate | CAGR of 7.69% from 2019-2033 |
| Segmentation |
|
Table of Contents
- 1. Introduction
- 1.1. Research Scope
- 1.2. Market Segmentation
- 1.3. Research Methodology
- 1.4. Definitions and Assumptions
- 2. Executive Summary
- 2.1. Introduction
- 3. Market Dynamics
- 3.1. Introduction
- 3.2. Market Drivers
- 3.2.1. Growing Adoption of Flow Cytometry in Stem Cell Research; Increasing Applications of Flow Cytometry in Clinical Research
- 3.3. Market Restrains
- 3.3.1. Lack of Awareness about the Potential Benefits of Flow Cytometry Techniques; High Cost of the Equipment
- 3.4. Market Trends
- 3.4.1. Stem Cell Therapy Segment is Expected to Witness a Significant Growth Over the Forecast Period.
- 4. Market Factor Analysis
- 4.1. Porters Five Forces
- 4.2. Supply/Value Chain
- 4.3. PESTEL analysis
- 4.4. Market Entropy
- 4.5. Patent/Trademark Analysis
- 5. Global Flow Cytometry Market Analysis, Insights and Forecast, 2019-2031
- 5.1. Market Analysis, Insights and Forecast - by Product Type
- 5.1.1. Instrument
- 5.1.2. Kit and Reagent
- 5.1.3. Software and Services
- 5.2. Market Analysis, Insights and Forecast - by Technology
- 5.2.1. Cell-based Flow Cytometry
- 5.2.2. Bead-based Flow Cytometry
- 5.3. Market Analysis, Insights and Forecast - by Application
- 5.3.1. Oncology
- 5.3.2. Drug Discovery
- 5.3.3. Stem Cell Therapy
- 5.3.4. Organ Transplantation
- 5.3.5. Hematology
- 5.3.6. Other Applications
- 5.4. Market Analysis, Insights and Forecast - by End-User
- 5.4.1. Hospitals and Clinics
- 5.4.2. Academia and Research Institutes
- 5.4.3. Pharmaceutical and Biotechnology Companies
- 5.4.4. Other End-Users
- 5.5. Market Analysis, Insights and Forecast - by Region
- 5.5.1. North America
- 5.5.2. Europe
- 5.5.3. Asia Pacific
- 5.5.4. Middle East and Africa
- 5.5.5. South America
- 5.1. Market Analysis, Insights and Forecast - by Product Type
- 6. North America Flow Cytometry Market Analysis, Insights and Forecast, 2019-2031
- 6.1. Market Analysis, Insights and Forecast - by Product Type
- 6.1.1. Instrument
- 6.1.2. Kit and Reagent
- 6.1.3. Software and Services
- 6.2. Market Analysis, Insights and Forecast - by Technology
- 6.2.1. Cell-based Flow Cytometry
- 6.2.2. Bead-based Flow Cytometry
- 6.3. Market Analysis, Insights and Forecast - by Application
- 6.3.1. Oncology
- 6.3.2. Drug Discovery
- 6.3.3. Stem Cell Therapy
- 6.3.4. Organ Transplantation
- 6.3.5. Hematology
- 6.3.6. Other Applications
- 6.4. Market Analysis, Insights and Forecast - by End-User
- 6.4.1. Hospitals and Clinics
- 6.4.2. Academia and Research Institutes
- 6.4.3. Pharmaceutical and Biotechnology Companies
- 6.4.4. Other End-Users
- 6.1. Market Analysis, Insights and Forecast - by Product Type
- 7. Europe Flow Cytometry Market Analysis, Insights and Forecast, 2019-2031
- 7.1. Market Analysis, Insights and Forecast - by Product Type
- 7.1.1. Instrument
- 7.1.2. Kit and Reagent
- 7.1.3. Software and Services
- 7.2. Market Analysis, Insights and Forecast - by Technology
- 7.2.1. Cell-based Flow Cytometry
- 7.2.2. Bead-based Flow Cytometry
- 7.3. Market Analysis, Insights and Forecast - by Application
- 7.3.1. Oncology
- 7.3.2. Drug Discovery
- 7.3.3. Stem Cell Therapy
- 7.3.4. Organ Transplantation
- 7.3.5. Hematology
- 7.3.6. Other Applications
- 7.4. Market Analysis, Insights and Forecast - by End-User
- 7.4.1. Hospitals and Clinics
- 7.4.2. Academia and Research Institutes
- 7.4.3. Pharmaceutical and Biotechnology Companies
- 7.4.4. Other End-Users
- 7.1. Market Analysis, Insights and Forecast - by Product Type
- 8. Asia Pacific Flow Cytometry Market Analysis, Insights and Forecast, 2019-2031
- 8.1. Market Analysis, Insights and Forecast - by Product Type
- 8.1.1. Instrument
- 8.1.2. Kit and Reagent
- 8.1.3. Software and Services
- 8.2. Market Analysis, Insights and Forecast - by Technology
- 8.2.1. Cell-based Flow Cytometry
- 8.2.2. Bead-based Flow Cytometry
- 8.3. Market Analysis, Insights and Forecast - by Application
- 8.3.1. Oncology
- 8.3.2. Drug Discovery
- 8.3.3. Stem Cell Therapy
- 8.3.4. Organ Transplantation
- 8.3.5. Hematology
- 8.3.6. Other Applications
- 8.4. Market Analysis, Insights and Forecast - by End-User
- 8.4.1. Hospitals and Clinics
- 8.4.2. Academia and Research Institutes
- 8.4.3. Pharmaceutical and Biotechnology Companies
- 8.4.4. Other End-Users
- 8.1. Market Analysis, Insights and Forecast - by Product Type
- 9. Middle East and Africa Flow Cytometry Market Analysis, Insights and Forecast, 2019-2031
- 9.1. Market Analysis, Insights and Forecast - by Product Type
- 9.1.1. Instrument
- 9.1.2. Kit and Reagent
- 9.1.3. Software and Services
- 9.2. Market Analysis, Insights and Forecast - by Technology
- 9.2.1. Cell-based Flow Cytometry
- 9.2.2. Bead-based Flow Cytometry
- 9.3. Market Analysis, Insights and Forecast - by Application
- 9.3.1. Oncology
- 9.3.2. Drug Discovery
- 9.3.3. Stem Cell Therapy
- 9.3.4. Organ Transplantation
- 9.3.5. Hematology
- 9.3.6. Other Applications
- 9.4. Market Analysis, Insights and Forecast - by End-User
- 9.4.1. Hospitals and Clinics
- 9.4.2. Academia and Research Institutes
- 9.4.3. Pharmaceutical and Biotechnology Companies
- 9.4.4. Other End-Users
- 9.1. Market Analysis, Insights and Forecast - by Product Type
- 10. South America Flow Cytometry Market Analysis, Insights and Forecast, 2019-2031
- 10.1. Market Analysis, Insights and Forecast - by Product Type
- 10.1.1. Instrument
- 10.1.2. Kit and Reagent
- 10.1.3. Software and Services
- 10.2. Market Analysis, Insights and Forecast - by Technology
- 10.2.1. Cell-based Flow Cytometry
- 10.2.2. Bead-based Flow Cytometry
- 10.3. Market Analysis, Insights and Forecast - by Application
- 10.3.1. Oncology
- 10.3.2. Drug Discovery
- 10.3.3. Stem Cell Therapy
- 10.3.4. Organ Transplantation
- 10.3.5. Hematology
- 10.3.6. Other Applications
- 10.4. Market Analysis, Insights and Forecast - by End-User
- 10.4.1. Hospitals and Clinics
- 10.4.2. Academia and Research Institutes
- 10.4.3. Pharmaceutical and Biotechnology Companies
- 10.4.4. Other End-Users
- 10.1. Market Analysis, Insights and Forecast - by Product Type
- 11. North America Flow Cytometry Market Analysis, Insights and Forecast, 2019-2031
- 11.1. Market Analysis, Insights and Forecast - By Country/Sub-region
- 11.1.1 United States
- 11.1.2 Canada
- 11.1.3 Mexico
- 12. Europe Flow Cytometry Market Analysis, Insights and Forecast, 2019-2031
- 12.1. Market Analysis, Insights and Forecast - By Country/Sub-region
- 12.1.1 Germany
- 12.1.2 United Kingdom
- 12.1.3 France
- 12.1.4 Italy
- 12.1.5 Spain
- 12.1.6 Rest of Europe
- 13. Asia Pacific Flow Cytometry Market Analysis, Insights and Forecast, 2019-2031
- 13.1. Market Analysis, Insights and Forecast - By Country/Sub-region
- 13.1.1 China
- 13.1.2 Japan
- 13.1.3 India
- 13.1.4 Australia
- 13.1.5 South Korea
- 13.1.6 Rest of Asia Pacific
- 14. Middle East and Africa Flow Cytometry Market Analysis, Insights and Forecast, 2019-2031
- 14.1. Market Analysis, Insights and Forecast - By Country/Sub-region
- 14.1.1 GCC
- 14.1.2 South Africa
- 14.1.3 Rest of Middle East and Africa
- 15. South America Flow Cytometry Market Analysis, Insights and Forecast, 2019-2031
- 15.1. Market Analysis, Insights and Forecast - By Country/Sub-region
- 15.1.1 Brazil
- 15.1.2 Argentina
- 15.1.3 Rest of South America
- 16. Competitive Analysis
- 16.1. Global Market Share Analysis 2024
- 16.2. Company Profiles
- 16.2.1 Becton Dickinson and Company
- 16.2.1.1. Overview
- 16.2.1.2. Products
- 16.2.1.3. SWOT Analysis
- 16.2.1.4. Recent Developments
- 16.2.1.5. Financials (Based on Availability)
- 16.2.2 Enzo Biochem Inc (Enzo Life Sciences Inc )*List Not Exhaustive
- 16.2.2.1. Overview
- 16.2.2.2. Products
- 16.2.2.3. SWOT Analysis
- 16.2.2.4. Recent Developments
- 16.2.2.5. Financials (Based on Availability)
- 16.2.3 Miltenyi Biotech
- 16.2.3.1. Overview
- 16.2.3.2. Products
- 16.2.3.3. SWOT Analysis
- 16.2.3.4. Recent Developments
- 16.2.3.5. Financials (Based on Availability)
- 16.2.4 BioMerieux SA
- 16.2.4.1. Overview
- 16.2.4.2. Products
- 16.2.4.3. SWOT Analysis
- 16.2.4.4. Recent Developments
- 16.2.4.5. Financials (Based on Availability)
- 16.2.5 Bio-Rad Laboratories Inc
- 16.2.5.1. Overview
- 16.2.5.2. Products
- 16.2.5.3. SWOT Analysis
- 16.2.5.4. Recent Developments
- 16.2.5.5. Financials (Based on Availability)
- 16.2.6 Stratedigm Inc
- 16.2.6.1. Overview
- 16.2.6.2. Products
- 16.2.6.3. SWOT Analysis
- 16.2.6.4. Recent Developments
- 16.2.6.5. Financials (Based on Availability)
- 16.2.7 Sony Biotechnology Inc (Sony Corporation of America)
- 16.2.7.1. Overview
- 16.2.7.2. Products
- 16.2.7.3. SWOT Analysis
- 16.2.7.4. Recent Developments
- 16.2.7.5. Financials (Based on Availability)
- 16.2.8 Agilent Technologies Inc
- 16.2.8.1. Overview
- 16.2.8.2. Products
- 16.2.8.3. SWOT Analysis
- 16.2.8.4. Recent Developments
- 16.2.8.5. Financials (Based on Availability)
- 16.2.9 Sysmex Corporation
- 16.2.9.1. Overview
- 16.2.9.2. Products
- 16.2.9.3. SWOT Analysis
- 16.2.9.4. Recent Developments
- 16.2.9.5. Financials (Based on Availability)
- 16.2.10 Danaher corporation (Beckman Coulter Inc )
- 16.2.10.1. Overview
- 16.2.10.2. Products
- 16.2.10.3. SWOT Analysis
- 16.2.10.4. Recent Developments
- 16.2.10.5. Financials (Based on Availability)
- 16.2.11 Luminex Corporation
- 16.2.11.1. Overview
- 16.2.11.2. Products
- 16.2.11.3. SWOT Analysis
- 16.2.11.4. Recent Developments
- 16.2.11.5. Financials (Based on Availability)
- 16.2.12 ThermoFisher Scientific Inc
- 16.2.12.1. Overview
- 16.2.12.2. Products
- 16.2.12.3. SWOT Analysis
- 16.2.12.4. Recent Developments
- 16.2.12.5. Financials (Based on Availability)
- 16.2.1 Becton Dickinson and Company
List of Figures
- Figure 1: Global Flow Cytometry Market Revenue Breakdown (Million, %) by Region 2024 & 2032
- Figure 2: North America Flow Cytometry Market Revenue (Million), by Country 2024 & 2032
- Figure 3: North America Flow Cytometry Market Revenue Share (%), by Country 2024 & 2032
- Figure 4: Europe Flow Cytometry Market Revenue (Million), by Country 2024 & 2032
- Figure 5: Europe Flow Cytometry Market Revenue Share (%), by Country 2024 & 2032
- Figure 6: Asia Pacific Flow Cytometry Market Revenue (Million), by Country 2024 & 2032
- Figure 7: Asia Pacific Flow Cytometry Market Revenue Share (%), by Country 2024 & 2032
- Figure 8: Middle East and Africa Flow Cytometry Market Revenue (Million), by Country 2024 & 2032
- Figure 9: Middle East and Africa Flow Cytometry Market Revenue Share (%), by Country 2024 & 2032
- Figure 10: South America Flow Cytometry Market Revenue (Million), by Country 2024 & 2032
- Figure 11: South America Flow Cytometry Market Revenue Share (%), by Country 2024 & 2032
- Figure 12: North America Flow Cytometry Market Revenue (Million), by Product Type 2024 & 2032
- Figure 13: North America Flow Cytometry Market Revenue Share (%), by Product Type 2024 & 2032
- Figure 14: North America Flow Cytometry Market Revenue (Million), by Technology 2024 & 2032
- Figure 15: North America Flow Cytometry Market Revenue Share (%), by Technology 2024 & 2032
- Figure 16: North America Flow Cytometry Market Revenue (Million), by Application 2024 & 2032
- Figure 17: North America Flow Cytometry Market Revenue Share (%), by Application 2024 & 2032
- Figure 18: North America Flow Cytometry Market Revenue (Million), by End-User 2024 & 2032
- Figure 19: North America Flow Cytometry Market Revenue Share (%), by End-User 2024 & 2032
- Figure 20: North America Flow Cytometry Market Revenue (Million), by Country 2024 & 2032
- Figure 21: North America Flow Cytometry Market Revenue Share (%), by Country 2024 & 2032
- Figure 22: Europe Flow Cytometry Market Revenue (Million), by Product Type 2024 & 2032
- Figure 23: Europe Flow Cytometry Market Revenue Share (%), by Product Type 2024 & 2032
- Figure 24: Europe Flow Cytometry Market Revenue (Million), by Technology 2024 & 2032
- Figure 25: Europe Flow Cytometry Market Revenue Share (%), by Technology 2024 & 2032
- Figure 26: Europe Flow Cytometry Market Revenue (Million), by Application 2024 & 2032
- Figure 27: Europe Flow Cytometry Market Revenue Share (%), by Application 2024 & 2032
- Figure 28: Europe Flow Cytometry Market Revenue (Million), by End-User 2024 & 2032
- Figure 29: Europe Flow Cytometry Market Revenue Share (%), by End-User 2024 & 2032
- Figure 30: Europe Flow Cytometry Market Revenue (Million), by Country 2024 & 2032
- Figure 31: Europe Flow Cytometry Market Revenue Share (%), by Country 2024 & 2032
- Figure 32: Asia Pacific Flow Cytometry Market Revenue (Million), by Product Type 2024 & 2032
- Figure 33: Asia Pacific Flow Cytometry Market Revenue Share (%), by Product Type 2024 & 2032
- Figure 34: Asia Pacific Flow Cytometry Market Revenue (Million), by Technology 2024 & 2032
- Figure 35: Asia Pacific Flow Cytometry Market Revenue Share (%), by Technology 2024 & 2032
- Figure 36: Asia Pacific Flow Cytometry Market Revenue (Million), by Application 2024 & 2032
- Figure 37: Asia Pacific Flow Cytometry Market Revenue Share (%), by Application 2024 & 2032
- Figure 38: Asia Pacific Flow Cytometry Market Revenue (Million), by End-User 2024 & 2032
- Figure 39: Asia Pacific Flow Cytometry Market Revenue Share (%), by End-User 2024 & 2032
- Figure 40: Asia Pacific Flow Cytometry Market Revenue (Million), by Country 2024 & 2032
- Figure 41: Asia Pacific Flow Cytometry Market Revenue Share (%), by Country 2024 & 2032
- Figure 42: Middle East and Africa Flow Cytometry Market Revenue (Million), by Product Type 2024 & 2032
- Figure 43: Middle East and Africa Flow Cytometry Market Revenue Share (%), by Product Type 2024 & 2032
- Figure 44: Middle East and Africa Flow Cytometry Market Revenue (Million), by Technology 2024 & 2032
- Figure 45: Middle East and Africa Flow Cytometry Market Revenue Share (%), by Technology 2024 & 2032
- Figure 46: Middle East and Africa Flow Cytometry Market Revenue (Million), by Application 2024 & 2032
- Figure 47: Middle East and Africa Flow Cytometry Market Revenue Share (%), by Application 2024 & 2032
- Figure 48: Middle East and Africa Flow Cytometry Market Revenue (Million), by End-User 2024 & 2032
- Figure 49: Middle East and Africa Flow Cytometry Market Revenue Share (%), by End-User 2024 & 2032
- Figure 50: Middle East and Africa Flow Cytometry Market Revenue (Million), by Country 2024 & 2032
- Figure 51: Middle East and Africa Flow Cytometry Market Revenue Share (%), by Country 2024 & 2032
- Figure 52: South America Flow Cytometry Market Revenue (Million), by Product Type 2024 & 2032
- Figure 53: South America Flow Cytometry Market Revenue Share (%), by Product Type 2024 & 2032
- Figure 54: South America Flow Cytometry Market Revenue (Million), by Technology 2024 & 2032
- Figure 55: South America Flow Cytometry Market Revenue Share (%), by Technology 2024 & 2032
- Figure 56: South America Flow Cytometry Market Revenue (Million), by Application 2024 & 2032
- Figure 57: South America Flow Cytometry Market Revenue Share (%), by Application 2024 & 2032
- Figure 58: South America Flow Cytometry Market Revenue (Million), by End-User 2024 & 2032
- Figure 59: South America Flow Cytometry Market Revenue Share (%), by End-User 2024 & 2032
- Figure 60: South America Flow Cytometry Market Revenue (Million), by Country 2024 & 2032
- Figure 61: South America Flow Cytometry Market Revenue Share (%), by Country 2024 & 2032
List of Tables
- Table 1: Global Flow Cytometry Market Revenue Million Forecast, by Region 2019 & 2032
- Table 2: Global Flow Cytometry Market Revenue Million Forecast, by Product Type 2019 & 2032
- Table 3: Global Flow Cytometry Market Revenue Million Forecast, by Technology 2019 & 2032
- Table 4: Global Flow Cytometry Market Revenue Million Forecast, by Application 2019 & 2032
- Table 5: Global Flow Cytometry Market Revenue Million Forecast, by End-User 2019 & 2032
- Table 6: Global Flow Cytometry Market Revenue Million Forecast, by Region 2019 & 2032
- Table 7: Global Flow Cytometry Market Revenue Million Forecast, by Country 2019 & 2032
- Table 8: United States Flow Cytometry Market Revenue (Million) Forecast, by Application 2019 & 2032
- Table 9: Canada Flow Cytometry Market Revenue (Million) Forecast, by Application 2019 & 2032
- Table 10: Mexico Flow Cytometry Market Revenue (Million) Forecast, by Application 2019 & 2032
- Table 11: Global Flow Cytometry Market Revenue Million Forecast, by Country 2019 & 2032
- Table 12: Germany Flow Cytometry Market Revenue (Million) Forecast, by Application 2019 & 2032
- Table 13: United Kingdom Flow Cytometry Market Revenue (Million) Forecast, by Application 2019 & 2032
- Table 14: France Flow Cytometry Market Revenue (Million) Forecast, by Application 2019 & 2032
- Table 15: Italy Flow Cytometry Market Revenue (Million) Forecast, by Application 2019 & 2032
- Table 16: Spain Flow Cytometry Market Revenue (Million) Forecast, by Application 2019 & 2032
- Table 17: Rest of Europe Flow Cytometry Market Revenue (Million) Forecast, by Application 2019 & 2032
- Table 18: Global Flow Cytometry Market Revenue Million Forecast, by Country 2019 & 2032
- Table 19: China Flow Cytometry Market Revenue (Million) Forecast, by Application 2019 & 2032
- Table 20: Japan Flow Cytometry Market Revenue (Million) Forecast, by Application 2019 & 2032
- Table 21: India Flow Cytometry Market Revenue (Million) Forecast, by Application 2019 & 2032
- Table 22: Australia Flow Cytometry Market Revenue (Million) Forecast, by Application 2019 & 2032
- Table 23: South Korea Flow Cytometry Market Revenue (Million) Forecast, by Application 2019 & 2032
- Table 24: Rest of Asia Pacific Flow Cytometry Market Revenue (Million) Forecast, by Application 2019 & 2032
- Table 25: Global Flow Cytometry Market Revenue Million Forecast, by Country 2019 & 2032
- Table 26: GCC Flow Cytometry Market Revenue (Million) Forecast, by Application 2019 & 2032
- Table 27: South Africa Flow Cytometry Market Revenue (Million) Forecast, by Application 2019 & 2032
- Table 28: Rest of Middle East and Africa Flow Cytometry Market Revenue (Million) Forecast, by Application 2019 & 2032
- Table 29: Global Flow Cytometry Market Revenue Million Forecast, by Country 2019 & 2032
- Table 30: Brazil Flow Cytometry Market Revenue (Million) Forecast, by Application 2019 & 2032
- Table 31: Argentina Flow Cytometry Market Revenue (Million) Forecast, by Application 2019 & 2032
- Table 32: Rest of South America Flow Cytometry Market Revenue (Million) Forecast, by Application 2019 & 2032
- Table 33: Global Flow Cytometry Market Revenue Million Forecast, by Product Type 2019 & 2032
- Table 34: Global Flow Cytometry Market Revenue Million Forecast, by Technology 2019 & 2032
- Table 35: Global Flow Cytometry Market Revenue Million Forecast, by Application 2019 & 2032
- Table 36: Global Flow Cytometry Market Revenue Million Forecast, by End-User 2019 & 2032
- Table 37: Global Flow Cytometry Market Revenue Million Forecast, by Country 2019 & 2032
- Table 38: United States Flow Cytometry Market Revenue (Million) Forecast, by Application 2019 & 2032
- Table 39: Canada Flow Cytometry Market Revenue (Million) Forecast, by Application 2019 & 2032
- Table 40: Mexico Flow Cytometry Market Revenue (Million) Forecast, by Application 2019 & 2032
- Table 41: Global Flow Cytometry Market Revenue Million Forecast, by Product Type 2019 & 2032
- Table 42: Global Flow Cytometry Market Revenue Million Forecast, by Technology 2019 & 2032
- Table 43: Global Flow Cytometry Market Revenue Million Forecast, by Application 2019 & 2032
- Table 44: Global Flow Cytometry Market Revenue Million Forecast, by End-User 2019 & 2032
- Table 45: Global Flow Cytometry Market Revenue Million Forecast, by Country 2019 & 2032
- Table 46: Germany Flow Cytometry Market Revenue (Million) Forecast, by Application 2019 & 2032
- Table 47: United Kingdom Flow Cytometry Market Revenue (Million) Forecast, by Application 2019 & 2032
- Table 48: France Flow Cytometry Market Revenue (Million) Forecast, by Application 2019 & 2032
- Table 49: Italy Flow Cytometry Market Revenue (Million) Forecast, by Application 2019 & 2032
- Table 50: Spain Flow Cytometry Market Revenue (Million) Forecast, by Application 2019 & 2032
- Table 51: Rest of Europe Flow Cytometry Market Revenue (Million) Forecast, by Application 2019 & 2032
- Table 52: Global Flow Cytometry Market Revenue Million Forecast, by Product Type 2019 & 2032
- Table 53: Global Flow Cytometry Market Revenue Million Forecast, by Technology 2019 & 2032
- Table 54: Global Flow Cytometry Market Revenue Million Forecast, by Application 2019 & 2032
- Table 55: Global Flow Cytometry Market Revenue Million Forecast, by End-User 2019 & 2032
- Table 56: Global Flow Cytometry Market Revenue Million Forecast, by Country 2019 & 2032
- Table 57: China Flow Cytometry Market Revenue (Million) Forecast, by Application 2019 & 2032
- Table 58: Japan Flow Cytometry Market Revenue (Million) Forecast, by Application 2019 & 2032
- Table 59: India Flow Cytometry Market Revenue (Million) Forecast, by Application 2019 & 2032
- Table 60: Australia Flow Cytometry Market Revenue (Million) Forecast, by Application 2019 & 2032
- Table 61: South Korea Flow Cytometry Market Revenue (Million) Forecast, by Application 2019 & 2032
- Table 62: Rest of Asia Pacific Flow Cytometry Market Revenue (Million) Forecast, by Application 2019 & 2032
- Table 63: Global Flow Cytometry Market Revenue Million Forecast, by Product Type 2019 & 2032
- Table 64: Global Flow Cytometry Market Revenue Million Forecast, by Technology 2019 & 2032
- Table 65: Global Flow Cytometry Market Revenue Million Forecast, by Application 2019 & 2032
- Table 66: Global Flow Cytometry Market Revenue Million Forecast, by End-User 2019 & 2032
- Table 67: Global Flow Cytometry Market Revenue Million Forecast, by Country 2019 & 2032
- Table 68: GCC Flow Cytometry Market Revenue (Million) Forecast, by Application 2019 & 2032
- Table 69: South Africa Flow Cytometry Market Revenue (Million) Forecast, by Application 2019 & 2032
- Table 70: Rest of Middle East and Africa Flow Cytometry Market Revenue (Million) Forecast, by Application 2019 & 2032
- Table 71: Global Flow Cytometry Market Revenue Million Forecast, by Product Type 2019 & 2032
- Table 72: Global Flow Cytometry Market Revenue Million Forecast, by Technology 2019 & 2032
- Table 73: Global Flow Cytometry Market Revenue Million Forecast, by Application 2019 & 2032
- Table 74: Global Flow Cytometry Market Revenue Million Forecast, by End-User 2019 & 2032
- Table 75: Global Flow Cytometry Market Revenue Million Forecast, by Country 2019 & 2032
- Table 76: Brazil Flow Cytometry Market Revenue (Million) Forecast, by Application 2019 & 2032
- Table 77: Argentina Flow Cytometry Market Revenue (Million) Forecast, by Application 2019 & 2032
- Table 78: Rest of South America Flow Cytometry Market Revenue (Million) Forecast, by Application 2019 & 2032
Frequently Asked Questions
1. What is the projected Compound Annual Growth Rate (CAGR) of the Flow Cytometry Market?
The projected CAGR is approximately 7.69%.
2. Which companies are prominent players in the Flow Cytometry Market?
Key companies in the market include Becton Dickinson and Company, Enzo Biochem Inc (Enzo Life Sciences Inc )*List Not Exhaustive, Miltenyi Biotech, BioMerieux SA, Bio-Rad Laboratories Inc, Stratedigm Inc, Sony Biotechnology Inc (Sony Corporation of America), Agilent Technologies Inc, Sysmex Corporation, Danaher corporation (Beckman Coulter Inc ), Luminex Corporation, ThermoFisher Scientific Inc.
3. What are the main segments of the Flow Cytometry Market?
The market segments include Product Type, Technology, Application, End-User.
4. Can you provide details about the market size?
The market size is estimated to be USD 6.27 Million as of 2022.
5. What are some drivers contributing to market growth?
Growing Adoption of Flow Cytometry in Stem Cell Research; Increasing Applications of Flow Cytometry in Clinical Research.
6. What are the notable trends driving market growth?
Stem Cell Therapy Segment is Expected to Witness a Significant Growth Over the Forecast Period..
7. Are there any restraints impacting market growth?
Lack of Awareness about the Potential Benefits of Flow Cytometry Techniques; High Cost of the Equipment.
8. Can you provide examples of recent developments in the market?
November 2022: Sony Corporation released SFA-Life Sciences Cloud Platform, a cloud-based solution for analyzing flow cytometry data that makes it easy to find rare cells like cancer cells and stem cells in a large number of cell populations. The solution uses data from flow cytometers to do this.
9. What pricing options are available for accessing the report?
Pricing options include single-user, multi-user, and enterprise licenses priced at USD 4750, USD 5250, and USD 8750 respectively.
10. Is the market size provided in terms of value or volume?
The market size is provided in terms of value, measured in Million.
11. Are there any specific market keywords associated with the report?
Yes, the market keyword associated with the report is "Flow Cytometry Market," which aids in identifying and referencing the specific market segment covered.
12. How do I determine which pricing option suits my needs best?
The pricing options vary based on user requirements and access needs. Individual users may opt for single-user licenses, while businesses requiring broader access may choose multi-user or enterprise licenses for cost-effective access to the report.
13. Are there any additional resources or data provided in the Flow Cytometry Market report?
While the report offers comprehensive insights, it's advisable to review the specific contents or supplementary materials provided to ascertain if additional resources or data are available.
14. How can I stay updated on further developments or reports in the Flow Cytometry Market?
To stay informed about further developments, trends, and reports in the Flow Cytometry Market, consider subscribing to industry newsletters, following relevant companies and organizations, or regularly checking reputable industry news sources and publications.
Methodology
Step 1 - Identification of Relevant Samples Size from Population Database


Step 2 - Approaches for Defining Global Market Size (Value, Volume* & Price*)

Note*: In applicable scenarios
Step 3 - Data Sources
Primary Research
- Web Analytics
- Survey Reports
- Research Institute
- Latest Research Reports
- Opinion Leaders
Secondary Research
- Annual Reports
- White Paper
- Latest Press Release
- Industry Association
- Paid Database
- Investor Presentations

Step 4 - Data Triangulation
Involves using different sources of information in order to increase the validity of a study
These sources are likely to be stakeholders in a program - participants, other researchers, program staff, other community members, and so on.
Then we put all data in single framework & apply various statistical tools to find out the dynamic on the market.
During the analysis stage, feedback from the stakeholder groups would be compared to determine areas of agreement as well as areas of divergence


