
Key Insights
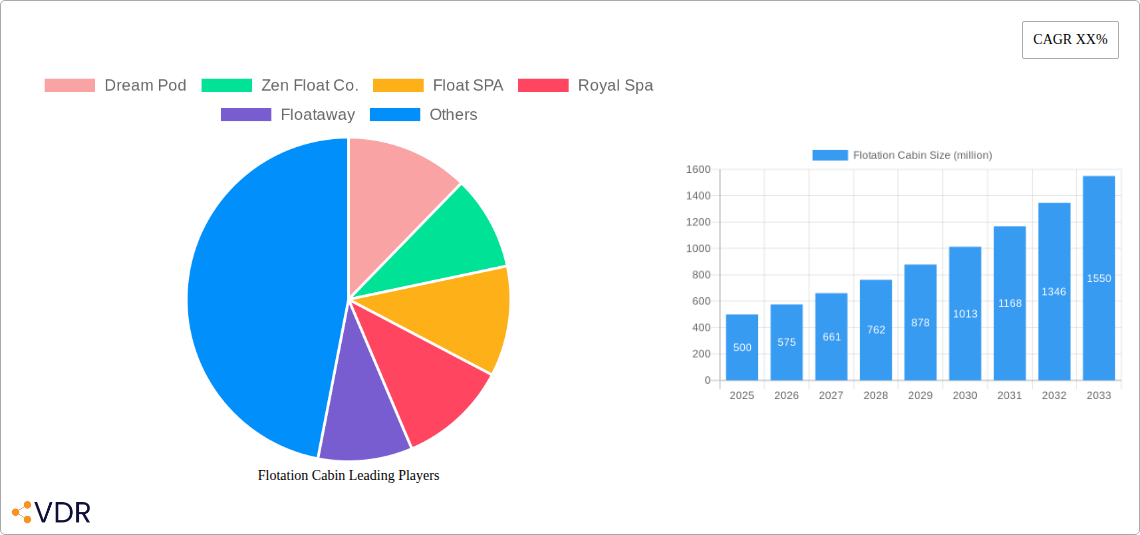
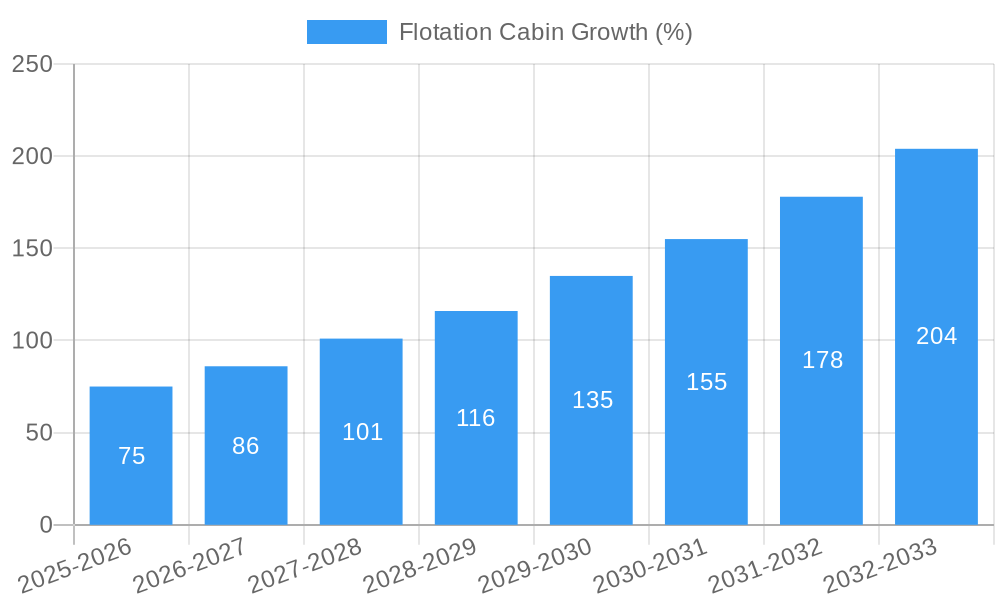
The global flotation cabin market is experiencing significant growth, driven by increasing awareness of the therapeutic benefits of floatation therapy and rising demand for stress reduction and wellness solutions. The market, estimated at $500 million in 2025, is projected to exhibit a Compound Annual Growth Rate (CAGR) of 15% from 2025 to 2033, reaching approximately $1.8 billion by 2033. This expansion is fueled by several key factors, including the rising prevalence of stress and anxiety disorders, increased consumer spending on wellness and self-care, and the growing popularity of alternative therapies. Technological advancements, such as improved cabin designs and enhanced sensory deprivation features, are further contributing to market growth. The market is segmented by type (home-use vs. commercial), size, and features (e.g., music, lighting, temperature control). Key players such as Dream Pod, Zen Float Co., and TrueREST are driving innovation and expanding market reach through strategic partnerships and product diversification. Geographical expansion, particularly in developing economies with a growing middle class, also presents substantial opportunities for market expansion.
While the market enjoys considerable growth potential, certain restraints exist. High initial investment costs associated with purchasing flotation cabins, particularly for home use, can limit accessibility for a portion of the consumer base. Furthermore, a lack of awareness about the benefits of floatation therapy in certain regions and the potential for misconceptions regarding its effectiveness pose challenges. However, increasing awareness campaigns and strategic marketing initiatives by market players are effectively addressing these hurdles, paving the way for sustained market growth. The continued focus on improving the user experience, enhancing the efficacy of floatation therapy, and expanding distribution channels will prove crucial in unlocking the full potential of this burgeoning market.
Flotation Cabin Market Report: A Comprehensive Analysis (2019-2033)
This comprehensive report provides an in-depth analysis of the global flotation cabin market, encompassing market dynamics, growth trends, competitive landscape, and future outlook. The report covers the period from 2019 to 2033, with a focus on the forecast period 2025-2033, using 2025 as the base year. The report segments the market by various factors and offers valuable insights for industry professionals, investors, and businesses seeking to understand and capitalize on this growing market. The total market size in 2025 is estimated at $XX million.
Flotation Cabin Market Dynamics & Structure
This section analyzes the market structure, focusing on concentration, innovation, regulations, and competitive dynamics within the wellness and relaxation product markets (parent market). The child market is premium relaxation and therapeutic devices.
The market exhibits moderate concentration, with several key players vying for market share. Technological innovation, driven by advancements in floatation tank design and water purification systems, is a key driver. Regulatory frameworks concerning hygiene and safety standards vary across regions, impacting market penetration. Competitive substitutes include massage therapy and other relaxation techniques. End-user demographics skew towards affluent consumers seeking stress reduction and wellness solutions. M&A activity has been relatively modest in the past 5 years, with approximately XX deals completed.
- Market Concentration: Moderately concentrated, with the top 5 players holding approximately 40% market share in 2025.
- Technological Innovation: Continuous improvement in tank design, water filtration, and sensory experience drives growth.
- Regulatory Landscape: Varies by region, posing challenges in certain markets. Compliance costs are estimated at $XX million annually.
- Competitive Substitutes: Massage therapy, meditation, and other relaxation techniques pose competition.
- End-User Demographics: Primarily affluent individuals aged 25-55, with a growing interest in wellness.
- M&A Activity: XX deals completed between 2020 and 2024, signaling consolidation potential.
Flotation Cabin Growth Trends & Insights
The global flotation cabin market has experienced significant growth over the past five years, driven by increasing consumer awareness of mental health benefits and rising disposable incomes, particularly in developed nations. The market is expected to grow at a Compound Annual Growth Rate (CAGR) of XX% from 2025 to 2033, reaching an estimated $XX million by 2033. Adoption rates are highest in North America and Europe, while growth potential is significant in emerging markets in Asia and Latin America. Technological disruptions, such as the integration of virtual reality and aromatherapy, are expanding the market's appeal. Consumer behavior is shifting towards personalized wellness experiences, further fueling demand for premium flotation cabins.
Dominant Regions, Countries, or Segments in Flotation Cabin
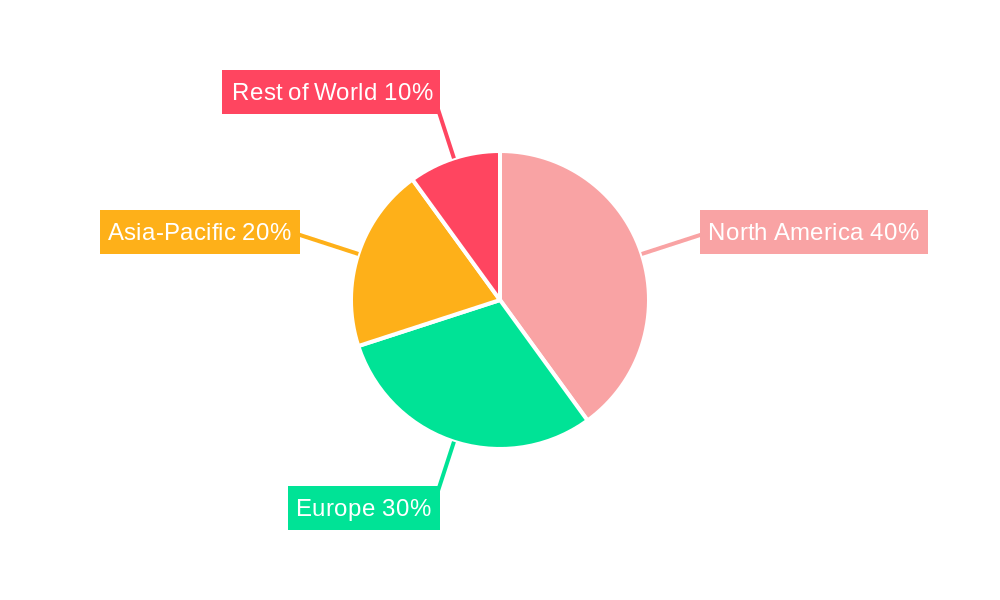
North America currently dominates the global flotation cabin market, accounting for approximately XX% of the total market share in 2025. This dominance is attributed to high consumer spending on wellness products, a strong focus on mental health, and the presence of established players like Dream Pod and TrueREST. Europe follows closely, driven by similar trends and a growing preference for alternative therapies. However, Asia-Pacific exhibits high growth potential due to rising disposable incomes and increasing awareness of the benefits of flotation therapy.
- Key Drivers in North America: High disposable incomes, established wellness culture, and strong presence of key players.
- Key Drivers in Europe: Growing interest in alternative therapies and increasing awareness of mental health.
- Key Drivers in Asia-Pacific: Rising disposable incomes, expanding wellness tourism, and increasing health consciousness.
Flotation Cabin Product Landscape
Flotation cabins are evolving from basic sensory deprivation tanks to sophisticated wellness pods integrating features like chromotherapy, aromatherapy, and music therapy. Advanced water purification systems ensure hygiene and comfort. Key innovations focus on enhancing user experience and addressing individual needs through personalized settings and customizable options. This technological advancement in features leads to higher price points and increases the market size to $XX million in 2025.
Key Drivers, Barriers & Challenges in Flotation Cabin
Key Drivers:
- Rising consumer awareness of mental health benefits.
- Increasing disposable incomes in developed and emerging markets.
- Technological advancements leading to enhanced user experience.
- Growing popularity of alternative therapies and wellness tourism.
Key Challenges and Restraints:
- High initial investment cost, limiting accessibility for a broader consumer base.
- Regulatory hurdles concerning hygiene and safety standards in certain regions.
- Competition from other relaxation and wellness modalities.
- Potential supply chain disruptions impacting production and availability. The estimated annual impact of supply chain issues on the market is $XX million.
Emerging Opportunities in Flotation Cabin
- Expansion into untapped markets in developing countries.
- Integration of advanced technologies like VR and AI for personalized experiences.
- Development of smaller, more affordable home-use models.
- Strategic partnerships with wellness centers and spas to increase accessibility.
Growth Accelerators in the Flotation Cabin Industry
Technological advancements continue to drive market expansion, leading to improved user experience and broader appeal. Strategic partnerships between flotation cabin manufacturers and wellness providers expand market reach and create new revenue streams. Expansion into new geographical markets and development of innovative product variations will significantly contribute to sustained growth.
Key Players Shaping the Flotation Cabin Market
- Dream Pod
- Zen Float Co.
- Float SPA
- Royal Spa
- Floataway
- FloatStar
- FloatOne
- Just Float
- I-sopod
- TrueREST
- Oasis
- Samadhi
Notable Milestones in Flotation Cabin Sector
- 2020: Introduction of the first commercially available VR-integrated flotation cabin by Dream Pod.
- 2021: Float SPA launches a franchise model, accelerating market expansion.
- 2022: TrueREST secures a significant funding round, fueling further innovation.
- 2023: Merger between two smaller floatation cabin companies increases market consolidation.
- 2024: Several new models of smaller and affordable home flotation pods are launched.
In-Depth Flotation Cabin Market Outlook
The future of the flotation cabin market appears bright, driven by continuous innovation, increased consumer awareness, and expanding market access. The market is poised for significant growth over the next decade, driven by both organic expansion and strategic acquisitions. Opportunities abound for companies focusing on technological advancements, customized experiences, and expansion into untapped markets. Strategic partnerships and collaborations will play a key role in shaping the market's future.
Flotation Cabin Segmentation
-
1. Application
- 1.1. Household
- 1.2. Commercial
-
2. Types
- 2.1. Tent Type
- 2.2. Tank Type
Flotation Cabin Segmentation By Geography
-
1. North America
- 1.1. United States
- 1.2. Canada
- 1.3. Mexico
-
2. South America
- 2.1. Brazil
- 2.2. Argentina
- 2.3. Rest of South America
-
3. Europe
- 3.1. United Kingdom
- 3.2. Germany
- 3.3. France
- 3.4. Italy
- 3.5. Spain
- 3.6. Russia
- 3.7. Benelux
- 3.8. Nordics
- 3.9. Rest of Europe
-
4. Middle East & Africa
- 4.1. Turkey
- 4.2. Israel
- 4.3. GCC
- 4.4. North Africa
- 4.5. South Africa
- 4.6. Rest of Middle East & Africa
-
5. Asia Pacific
- 5.1. China
- 5.2. India
- 5.3. Japan
- 5.4. South Korea
- 5.5. ASEAN
- 5.6. Oceania
- 5.7. Rest of Asia Pacific
Flotation Cabin REPORT HIGHLIGHTS
| Aspects | Details |
|---|---|
| Study Period | 2019-2033 |
| Base Year | 2024 |
| Estimated Year | 2025 |
| Forecast Period | 2025-2033 |
| Historical Period | 2019-2024 |
| Growth Rate | CAGR of XX% from 2019-2033 |
| Segmentation |
|
Table of Contents
- 1. Introduction
- 1.1. Research Scope
- 1.2. Market Segmentation
- 1.3. Research Methodology
- 1.4. Definitions and Assumptions
- 2. Executive Summary
- 2.1. Introduction
- 3. Market Dynamics
- 3.1. Introduction
- 3.2. Market Drivers
- 3.3. Market Restrains
- 3.4. Market Trends
- 4. Market Factor Analysis
- 4.1. Porters Five Forces
- 4.2. Supply/Value Chain
- 4.3. PESTEL analysis
- 4.4. Market Entropy
- 4.5. Patent/Trademark Analysis
- 5. Global Flotation Cabin Analysis, Insights and Forecast, 2019-2031
- 5.1. Market Analysis, Insights and Forecast - by Application
- 5.1.1. Household
- 5.1.2. Commercial
- 5.2. Market Analysis, Insights and Forecast - by Types
- 5.2.1. Tent Type
- 5.2.2. Tank Type
- 5.3. Market Analysis, Insights and Forecast - by Region
- 5.3.1. North America
- 5.3.2. South America
- 5.3.3. Europe
- 5.3.4. Middle East & Africa
- 5.3.5. Asia Pacific
- 5.1. Market Analysis, Insights and Forecast - by Application
- 6. North America Flotation Cabin Analysis, Insights and Forecast, 2019-2031
- 6.1. Market Analysis, Insights and Forecast - by Application
- 6.1.1. Household
- 6.1.2. Commercial
- 6.2. Market Analysis, Insights and Forecast - by Types
- 6.2.1. Tent Type
- 6.2.2. Tank Type
- 6.1. Market Analysis, Insights and Forecast - by Application
- 7. South America Flotation Cabin Analysis, Insights and Forecast, 2019-2031
- 7.1. Market Analysis, Insights and Forecast - by Application
- 7.1.1. Household
- 7.1.2. Commercial
- 7.2. Market Analysis, Insights and Forecast - by Types
- 7.2.1. Tent Type
- 7.2.2. Tank Type
- 7.1. Market Analysis, Insights and Forecast - by Application
- 8. Europe Flotation Cabin Analysis, Insights and Forecast, 2019-2031
- 8.1. Market Analysis, Insights and Forecast - by Application
- 8.1.1. Household
- 8.1.2. Commercial
- 8.2. Market Analysis, Insights and Forecast - by Types
- 8.2.1. Tent Type
- 8.2.2. Tank Type
- 8.1. Market Analysis, Insights and Forecast - by Application
- 9. Middle East & Africa Flotation Cabin Analysis, Insights and Forecast, 2019-2031
- 9.1. Market Analysis, Insights and Forecast - by Application
- 9.1.1. Household
- 9.1.2. Commercial
- 9.2. Market Analysis, Insights and Forecast - by Types
- 9.2.1. Tent Type
- 9.2.2. Tank Type
- 9.1. Market Analysis, Insights and Forecast - by Application
- 10. Asia Pacific Flotation Cabin Analysis, Insights and Forecast, 2019-2031
- 10.1. Market Analysis, Insights and Forecast - by Application
- 10.1.1. Household
- 10.1.2. Commercial
- 10.2. Market Analysis, Insights and Forecast - by Types
- 10.2.1. Tent Type
- 10.2.2. Tank Type
- 10.1. Market Analysis, Insights and Forecast - by Application
- 11. Competitive Analysis
- 11.1. Global Market Share Analysis 2024
- 11.2. Company Profiles
- 11.2.1 Dream Pod
- 11.2.1.1. Overview
- 11.2.1.2. Products
- 11.2.1.3. SWOT Analysis
- 11.2.1.4. Recent Developments
- 11.2.1.5. Financials (Based on Availability)
- 11.2.2 Zen Float Co.
- 11.2.2.1. Overview
- 11.2.2.2. Products
- 11.2.2.3. SWOT Analysis
- 11.2.2.4. Recent Developments
- 11.2.2.5. Financials (Based on Availability)
- 11.2.3 Float SPA
- 11.2.3.1. Overview
- 11.2.3.2. Products
- 11.2.3.3. SWOT Analysis
- 11.2.3.4. Recent Developments
- 11.2.3.5. Financials (Based on Availability)
- 11.2.4 Royal Spa
- 11.2.4.1. Overview
- 11.2.4.2. Products
- 11.2.4.3. SWOT Analysis
- 11.2.4.4. Recent Developments
- 11.2.4.5. Financials (Based on Availability)
- 11.2.5 Floataway
- 11.2.5.1. Overview
- 11.2.5.2. Products
- 11.2.5.3. SWOT Analysis
- 11.2.5.4. Recent Developments
- 11.2.5.5. Financials (Based on Availability)
- 11.2.6 FloatStar
- 11.2.6.1. Overview
- 11.2.6.2. Products
- 11.2.6.3. SWOT Analysis
- 11.2.6.4. Recent Developments
- 11.2.6.5. Financials (Based on Availability)
- 11.2.7 FloatOne
- 11.2.7.1. Overview
- 11.2.7.2. Products
- 11.2.7.3. SWOT Analysis
- 11.2.7.4. Recent Developments
- 11.2.7.5. Financials (Based on Availability)
- 11.2.8 Just Float
- 11.2.8.1. Overview
- 11.2.8.2. Products
- 11.2.8.3. SWOT Analysis
- 11.2.8.4. Recent Developments
- 11.2.8.5. Financials (Based on Availability)
- 11.2.9 I-sopod
- 11.2.9.1. Overview
- 11.2.9.2. Products
- 11.2.9.3. SWOT Analysis
- 11.2.9.4. Recent Developments
- 11.2.9.5. Financials (Based on Availability)
- 11.2.10 TrueREST
- 11.2.10.1. Overview
- 11.2.10.2. Products
- 11.2.10.3. SWOT Analysis
- 11.2.10.4. Recent Developments
- 11.2.10.5. Financials (Based on Availability)
- 11.2.11 Oasis
- 11.2.11.1. Overview
- 11.2.11.2. Products
- 11.2.11.3. SWOT Analysis
- 11.2.11.4. Recent Developments
- 11.2.11.5. Financials (Based on Availability)
- 11.2.12 Samadhi
- 11.2.12.1. Overview
- 11.2.12.2. Products
- 11.2.12.3. SWOT Analysis
- 11.2.12.4. Recent Developments
- 11.2.12.5. Financials (Based on Availability)
- 11.2.1 Dream Pod
List of Figures
- Figure 1: Global Flotation Cabin Revenue Breakdown (million, %) by Region 2024 & 2032
- Figure 2: Global Flotation Cabin Volume Breakdown (K, %) by Region 2024 & 2032
- Figure 3: North America Flotation Cabin Revenue (million), by Application 2024 & 2032
- Figure 4: North America Flotation Cabin Volume (K), by Application 2024 & 2032
- Figure 5: North America Flotation Cabin Revenue Share (%), by Application 2024 & 2032
- Figure 6: North America Flotation Cabin Volume Share (%), by Application 2024 & 2032
- Figure 7: North America Flotation Cabin Revenue (million), by Types 2024 & 2032
- Figure 8: North America Flotation Cabin Volume (K), by Types 2024 & 2032
- Figure 9: North America Flotation Cabin Revenue Share (%), by Types 2024 & 2032
- Figure 10: North America Flotation Cabin Volume Share (%), by Types 2024 & 2032
- Figure 11: North America Flotation Cabin Revenue (million), by Country 2024 & 2032
- Figure 12: North America Flotation Cabin Volume (K), by Country 2024 & 2032
- Figure 13: North America Flotation Cabin Revenue Share (%), by Country 2024 & 2032
- Figure 14: North America Flotation Cabin Volume Share (%), by Country 2024 & 2032
- Figure 15: South America Flotation Cabin Revenue (million), by Application 2024 & 2032
- Figure 16: South America Flotation Cabin Volume (K), by Application 2024 & 2032
- Figure 17: South America Flotation Cabin Revenue Share (%), by Application 2024 & 2032
- Figure 18: South America Flotation Cabin Volume Share (%), by Application 2024 & 2032
- Figure 19: South America Flotation Cabin Revenue (million), by Types 2024 & 2032
- Figure 20: South America Flotation Cabin Volume (K), by Types 2024 & 2032
- Figure 21: South America Flotation Cabin Revenue Share (%), by Types 2024 & 2032
- Figure 22: South America Flotation Cabin Volume Share (%), by Types 2024 & 2032
- Figure 23: South America Flotation Cabin Revenue (million), by Country 2024 & 2032
- Figure 24: South America Flotation Cabin Volume (K), by Country 2024 & 2032
- Figure 25: South America Flotation Cabin Revenue Share (%), by Country 2024 & 2032
- Figure 26: South America Flotation Cabin Volume Share (%), by Country 2024 & 2032
- Figure 27: Europe Flotation Cabin Revenue (million), by Application 2024 & 2032
- Figure 28: Europe Flotation Cabin Volume (K), by Application 2024 & 2032
- Figure 29: Europe Flotation Cabin Revenue Share (%), by Application 2024 & 2032
- Figure 30: Europe Flotation Cabin Volume Share (%), by Application 2024 & 2032
- Figure 31: Europe Flotation Cabin Revenue (million), by Types 2024 & 2032
- Figure 32: Europe Flotation Cabin Volume (K), by Types 2024 & 2032
- Figure 33: Europe Flotation Cabin Revenue Share (%), by Types 2024 & 2032
- Figure 34: Europe Flotation Cabin Volume Share (%), by Types 2024 & 2032
- Figure 35: Europe Flotation Cabin Revenue (million), by Country 2024 & 2032
- Figure 36: Europe Flotation Cabin Volume (K), by Country 2024 & 2032
- Figure 37: Europe Flotation Cabin Revenue Share (%), by Country 2024 & 2032
- Figure 38: Europe Flotation Cabin Volume Share (%), by Country 2024 & 2032
- Figure 39: Middle East & Africa Flotation Cabin Revenue (million), by Application 2024 & 2032
- Figure 40: Middle East & Africa Flotation Cabin Volume (K), by Application 2024 & 2032
- Figure 41: Middle East & Africa Flotation Cabin Revenue Share (%), by Application 2024 & 2032
- Figure 42: Middle East & Africa Flotation Cabin Volume Share (%), by Application 2024 & 2032
- Figure 43: Middle East & Africa Flotation Cabin Revenue (million), by Types 2024 & 2032
- Figure 44: Middle East & Africa Flotation Cabin Volume (K), by Types 2024 & 2032
- Figure 45: Middle East & Africa Flotation Cabin Revenue Share (%), by Types 2024 & 2032
- Figure 46: Middle East & Africa Flotation Cabin Volume Share (%), by Types 2024 & 2032
- Figure 47: Middle East & Africa Flotation Cabin Revenue (million), by Country 2024 & 2032
- Figure 48: Middle East & Africa Flotation Cabin Volume (K), by Country 2024 & 2032
- Figure 49: Middle East & Africa Flotation Cabin Revenue Share (%), by Country 2024 & 2032
- Figure 50: Middle East & Africa Flotation Cabin Volume Share (%), by Country 2024 & 2032
- Figure 51: Asia Pacific Flotation Cabin Revenue (million), by Application 2024 & 2032
- Figure 52: Asia Pacific Flotation Cabin Volume (K), by Application 2024 & 2032
- Figure 53: Asia Pacific Flotation Cabin Revenue Share (%), by Application 2024 & 2032
- Figure 54: Asia Pacific Flotation Cabin Volume Share (%), by Application 2024 & 2032
- Figure 55: Asia Pacific Flotation Cabin Revenue (million), by Types 2024 & 2032
- Figure 56: Asia Pacific Flotation Cabin Volume (K), by Types 2024 & 2032
- Figure 57: Asia Pacific Flotation Cabin Revenue Share (%), by Types 2024 & 2032
- Figure 58: Asia Pacific Flotation Cabin Volume Share (%), by Types 2024 & 2032
- Figure 59: Asia Pacific Flotation Cabin Revenue (million), by Country 2024 & 2032
- Figure 60: Asia Pacific Flotation Cabin Volume (K), by Country 2024 & 2032
- Figure 61: Asia Pacific Flotation Cabin Revenue Share (%), by Country 2024 & 2032
- Figure 62: Asia Pacific Flotation Cabin Volume Share (%), by Country 2024 & 2032
List of Tables
- Table 1: Global Flotation Cabin Revenue million Forecast, by Region 2019 & 2032
- Table 2: Global Flotation Cabin Volume K Forecast, by Region 2019 & 2032
- Table 3: Global Flotation Cabin Revenue million Forecast, by Application 2019 & 2032
- Table 4: Global Flotation Cabin Volume K Forecast, by Application 2019 & 2032
- Table 5: Global Flotation Cabin Revenue million Forecast, by Types 2019 & 2032
- Table 6: Global Flotation Cabin Volume K Forecast, by Types 2019 & 2032
- Table 7: Global Flotation Cabin Revenue million Forecast, by Region 2019 & 2032
- Table 8: Global Flotation Cabin Volume K Forecast, by Region 2019 & 2032
- Table 9: Global Flotation Cabin Revenue million Forecast, by Application 2019 & 2032
- Table 10: Global Flotation Cabin Volume K Forecast, by Application 2019 & 2032
- Table 11: Global Flotation Cabin Revenue million Forecast, by Types 2019 & 2032
- Table 12: Global Flotation Cabin Volume K Forecast, by Types 2019 & 2032
- Table 13: Global Flotation Cabin Revenue million Forecast, by Country 2019 & 2032
- Table 14: Global Flotation Cabin Volume K Forecast, by Country 2019 & 2032
- Table 15: United States Flotation Cabin Revenue (million) Forecast, by Application 2019 & 2032
- Table 16: United States Flotation Cabin Volume (K) Forecast, by Application 2019 & 2032
- Table 17: Canada Flotation Cabin Revenue (million) Forecast, by Application 2019 & 2032
- Table 18: Canada Flotation Cabin Volume (K) Forecast, by Application 2019 & 2032
- Table 19: Mexico Flotation Cabin Revenue (million) Forecast, by Application 2019 & 2032
- Table 20: Mexico Flotation Cabin Volume (K) Forecast, by Application 2019 & 2032
- Table 21: Global Flotation Cabin Revenue million Forecast, by Application 2019 & 2032
- Table 22: Global Flotation Cabin Volume K Forecast, by Application 2019 & 2032
- Table 23: Global Flotation Cabin Revenue million Forecast, by Types 2019 & 2032
- Table 24: Global Flotation Cabin Volume K Forecast, by Types 2019 & 2032
- Table 25: Global Flotation Cabin Revenue million Forecast, by Country 2019 & 2032
- Table 26: Global Flotation Cabin Volume K Forecast, by Country 2019 & 2032
- Table 27: Brazil Flotation Cabin Revenue (million) Forecast, by Application 2019 & 2032
- Table 28: Brazil Flotation Cabin Volume (K) Forecast, by Application 2019 & 2032
- Table 29: Argentina Flotation Cabin Revenue (million) Forecast, by Application 2019 & 2032
- Table 30: Argentina Flotation Cabin Volume (K) Forecast, by Application 2019 & 2032
- Table 31: Rest of South America Flotation Cabin Revenue (million) Forecast, by Application 2019 & 2032
- Table 32: Rest of South America Flotation Cabin Volume (K) Forecast, by Application 2019 & 2032
- Table 33: Global Flotation Cabin Revenue million Forecast, by Application 2019 & 2032
- Table 34: Global Flotation Cabin Volume K Forecast, by Application 2019 & 2032
- Table 35: Global Flotation Cabin Revenue million Forecast, by Types 2019 & 2032
- Table 36: Global Flotation Cabin Volume K Forecast, by Types 2019 & 2032
- Table 37: Global Flotation Cabin Revenue million Forecast, by Country 2019 & 2032
- Table 38: Global Flotation Cabin Volume K Forecast, by Country 2019 & 2032
- Table 39: United Kingdom Flotation Cabin Revenue (million) Forecast, by Application 2019 & 2032
- Table 40: United Kingdom Flotation Cabin Volume (K) Forecast, by Application 2019 & 2032
- Table 41: Germany Flotation Cabin Revenue (million) Forecast, by Application 2019 & 2032
- Table 42: Germany Flotation Cabin Volume (K) Forecast, by Application 2019 & 2032
- Table 43: France Flotation Cabin Revenue (million) Forecast, by Application 2019 & 2032
- Table 44: France Flotation Cabin Volume (K) Forecast, by Application 2019 & 2032
- Table 45: Italy Flotation Cabin Revenue (million) Forecast, by Application 2019 & 2032
- Table 46: Italy Flotation Cabin Volume (K) Forecast, by Application 2019 & 2032
- Table 47: Spain Flotation Cabin Revenue (million) Forecast, by Application 2019 & 2032
- Table 48: Spain Flotation Cabin Volume (K) Forecast, by Application 2019 & 2032
- Table 49: Russia Flotation Cabin Revenue (million) Forecast, by Application 2019 & 2032
- Table 50: Russia Flotation Cabin Volume (K) Forecast, by Application 2019 & 2032
- Table 51: Benelux Flotation Cabin Revenue (million) Forecast, by Application 2019 & 2032
- Table 52: Benelux Flotation Cabin Volume (K) Forecast, by Application 2019 & 2032
- Table 53: Nordics Flotation Cabin Revenue (million) Forecast, by Application 2019 & 2032
- Table 54: Nordics Flotation Cabin Volume (K) Forecast, by Application 2019 & 2032
- Table 55: Rest of Europe Flotation Cabin Revenue (million) Forecast, by Application 2019 & 2032
- Table 56: Rest of Europe Flotation Cabin Volume (K) Forecast, by Application 2019 & 2032
- Table 57: Global Flotation Cabin Revenue million Forecast, by Application 2019 & 2032
- Table 58: Global Flotation Cabin Volume K Forecast, by Application 2019 & 2032
- Table 59: Global Flotation Cabin Revenue million Forecast, by Types 2019 & 2032
- Table 60: Global Flotation Cabin Volume K Forecast, by Types 2019 & 2032
- Table 61: Global Flotation Cabin Revenue million Forecast, by Country 2019 & 2032
- Table 62: Global Flotation Cabin Volume K Forecast, by Country 2019 & 2032
- Table 63: Turkey Flotation Cabin Revenue (million) Forecast, by Application 2019 & 2032
- Table 64: Turkey Flotation Cabin Volume (K) Forecast, by Application 2019 & 2032
- Table 65: Israel Flotation Cabin Revenue (million) Forecast, by Application 2019 & 2032
- Table 66: Israel Flotation Cabin Volume (K) Forecast, by Application 2019 & 2032
- Table 67: GCC Flotation Cabin Revenue (million) Forecast, by Application 2019 & 2032
- Table 68: GCC Flotation Cabin Volume (K) Forecast, by Application 2019 & 2032
- Table 69: North Africa Flotation Cabin Revenue (million) Forecast, by Application 2019 & 2032
- Table 70: North Africa Flotation Cabin Volume (K) Forecast, by Application 2019 & 2032
- Table 71: South Africa Flotation Cabin Revenue (million) Forecast, by Application 2019 & 2032
- Table 72: South Africa Flotation Cabin Volume (K) Forecast, by Application 2019 & 2032
- Table 73: Rest of Middle East & Africa Flotation Cabin Revenue (million) Forecast, by Application 2019 & 2032
- Table 74: Rest of Middle East & Africa Flotation Cabin Volume (K) Forecast, by Application 2019 & 2032
- Table 75: Global Flotation Cabin Revenue million Forecast, by Application 2019 & 2032
- Table 76: Global Flotation Cabin Volume K Forecast, by Application 2019 & 2032
- Table 77: Global Flotation Cabin Revenue million Forecast, by Types 2019 & 2032
- Table 78: Global Flotation Cabin Volume K Forecast, by Types 2019 & 2032
- Table 79: Global Flotation Cabin Revenue million Forecast, by Country 2019 & 2032
- Table 80: Global Flotation Cabin Volume K Forecast, by Country 2019 & 2032
- Table 81: China Flotation Cabin Revenue (million) Forecast, by Application 2019 & 2032
- Table 82: China Flotation Cabin Volume (K) Forecast, by Application 2019 & 2032
- Table 83: India Flotation Cabin Revenue (million) Forecast, by Application 2019 & 2032
- Table 84: India Flotation Cabin Volume (K) Forecast, by Application 2019 & 2032
- Table 85: Japan Flotation Cabin Revenue (million) Forecast, by Application 2019 & 2032
- Table 86: Japan Flotation Cabin Volume (K) Forecast, by Application 2019 & 2032
- Table 87: South Korea Flotation Cabin Revenue (million) Forecast, by Application 2019 & 2032
- Table 88: South Korea Flotation Cabin Volume (K) Forecast, by Application 2019 & 2032
- Table 89: ASEAN Flotation Cabin Revenue (million) Forecast, by Application 2019 & 2032
- Table 90: ASEAN Flotation Cabin Volume (K) Forecast, by Application 2019 & 2032
- Table 91: Oceania Flotation Cabin Revenue (million) Forecast, by Application 2019 & 2032
- Table 92: Oceania Flotation Cabin Volume (K) Forecast, by Application 2019 & 2032
- Table 93: Rest of Asia Pacific Flotation Cabin Revenue (million) Forecast, by Application 2019 & 2032
- Table 94: Rest of Asia Pacific Flotation Cabin Volume (K) Forecast, by Application 2019 & 2032
Frequently Asked Questions
1. What is the projected Compound Annual Growth Rate (CAGR) of the Flotation Cabin?
The projected CAGR is approximately XX%.
2. Which companies are prominent players in the Flotation Cabin?
Key companies in the market include Dream Pod, Zen Float Co., Float SPA, Royal Spa, Floataway, FloatStar, FloatOne, Just Float, I-sopod, TrueREST, Oasis, Samadhi.
3. What are the main segments of the Flotation Cabin?
The market segments include Application, Types.
4. Can you provide details about the market size?
The market size is estimated to be USD XXX million as of 2022.
5. What are some drivers contributing to market growth?
N/A
6. What are the notable trends driving market growth?
N/A
7. Are there any restraints impacting market growth?
N/A
8. Can you provide examples of recent developments in the market?
N/A
9. What pricing options are available for accessing the report?
Pricing options include single-user, multi-user, and enterprise licenses priced at USD 3950.00, USD 5925.00, and USD 7900.00 respectively.
10. Is the market size provided in terms of value or volume?
The market size is provided in terms of value, measured in million and volume, measured in K.
11. Are there any specific market keywords associated with the report?
Yes, the market keyword associated with the report is "Flotation Cabin," which aids in identifying and referencing the specific market segment covered.
12. How do I determine which pricing option suits my needs best?
The pricing options vary based on user requirements and access needs. Individual users may opt for single-user licenses, while businesses requiring broader access may choose multi-user or enterprise licenses for cost-effective access to the report.
13. Are there any additional resources or data provided in the Flotation Cabin report?
While the report offers comprehensive insights, it's advisable to review the specific contents or supplementary materials provided to ascertain if additional resources or data are available.
14. How can I stay updated on further developments or reports in the Flotation Cabin?
To stay informed about further developments, trends, and reports in the Flotation Cabin, consider subscribing to industry newsletters, following relevant companies and organizations, or regularly checking reputable industry news sources and publications.
Methodology
Step 1 - Identification of Relevant Samples Size from Population Database


Step 2 - Approaches for Defining Global Market Size (Value, Volume* & Price*)

Note*: In applicable scenarios
Step 3 - Data Sources
Primary Research
- Web Analytics
- Survey Reports
- Research Institute
- Latest Research Reports
- Opinion Leaders
Secondary Research
- Annual Reports
- White Paper
- Latest Press Release
- Industry Association
- Paid Database
- Investor Presentations

Step 4 - Data Triangulation
Involves using different sources of information in order to increase the validity of a study
These sources are likely to be stakeholders in a program - participants, other researchers, program staff, other community members, and so on.
Then we put all data in single framework & apply various statistical tools to find out the dynamic on the market.
During the analysis stage, feedback from the stakeholder groups would be compared to determine areas of agreement as well as areas of divergence


