


Key Insights
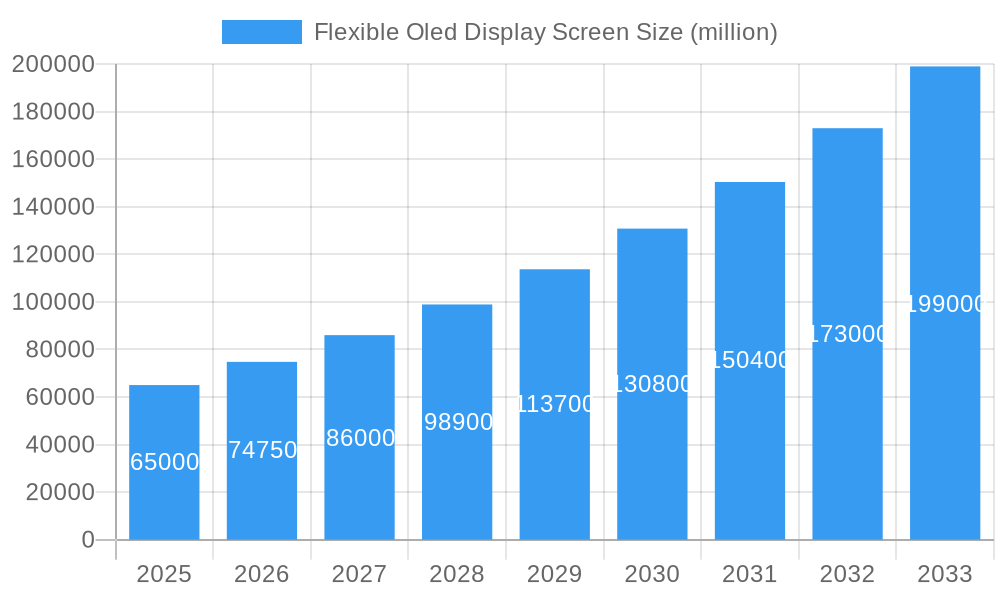
The global Flexible OLED Display Screen market is poised for significant expansion, projected to reach an estimated market size of approximately USD 65,000 million by 2025, with a robust Compound Annual Growth Rate (CAGR) of around 15% expected throughout the forecast period of 2025-2033. This impressive growth is fueled by the escalating demand for advanced display technologies across a multitude of consumer and industrial applications. The inherent advantages of flexible OLEDs, including their superior contrast ratios, vibrant color reproduction, thinner form factors, and energy efficiency, are driving their adoption in premium smartphones, smartwatches, and other wearable devices. Furthermore, the burgeoning automotive sector's embrace of integrated and immersive display solutions within vehicles, alongside the critical need for high-resolution and adaptable screens in medical equipment for improved diagnostics and patient monitoring, are substantial market drivers. The ability of these screens to be bent, folded, or curved opens up entirely new design possibilities and user experiences, making them a cornerstone of next-generation electronic products.
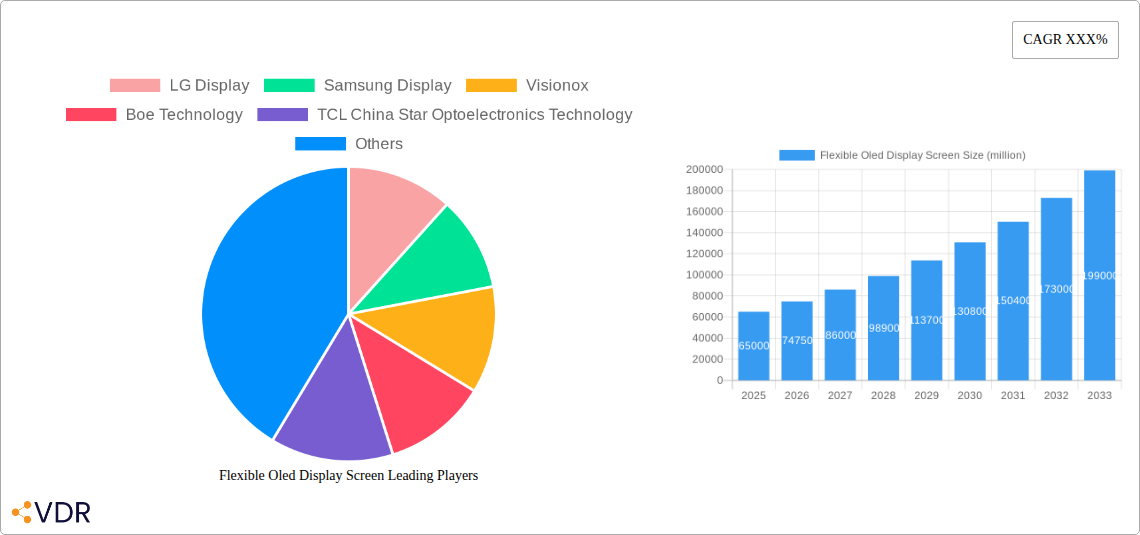
Flexible Oled Display Screen Market Size (In Billion)

The market segmentation reveals a dynamic landscape. By application, Mobile Devices are expected to command the largest share, reflecting the continued dominance of smartphones as the primary platform for flexible OLED integration. However, Automotive Display Systems and Medical Equipment are anticipated to exhibit the fastest growth rates, driven by innovation and increasing integration of these advanced displays. On the type front, Flexible Foldable Screens are generating considerable excitement and are projected to witness substantial uptake, especially as manufacturers bring more foldable devices to market. Flexible Curved Screens also remain a significant segment, enhancing the aesthetic and user experience in various devices. Key players like LG Display, Samsung Display, and Visionox are at the forefront of this innovation, investing heavily in research and development to push the boundaries of flexible OLED technology and secure their market positions. While the market is vibrant, potential restraints such as the higher manufacturing costs compared to traditional displays and the ongoing challenges in achieving mass production yields for some advanced flexible form factors will need to be addressed for sustained and accelerated growth. Nevertheless, the overwhelming consumer and industry appetite for cutting-edge display solutions underpins a very optimistic outlook for the Flexible OLED Display Screen market.
Flexible Oled Display Screen Company Market Share
Absolutely! Here's a comprehensive, SEO-optimized report description for the Flexible OLED Display Screen market, designed to maximize visibility and engagement for industry professionals.
Report Description:
Dive deep into the dynamic and rapidly evolving Flexible OLED Display Screen market with this in-depth industry report. Covering the period from 2019 to 2033, with a base year of 2025 and a forecast period extending to 2033, this report provides an indispensable resource for stakeholders seeking to understand market dynamics, growth drivers, regional dominance, technological innovations, and future opportunities. We analyze key segments such as Mobile Devices, Automotive Display Systems, Medical Equipment, and Others, alongside types like Flexible Curved Screens, Flexible Foldable Screens, and Flexible Bendable Screens. Leverage detailed market insights, quantitative data presented in million units, and expert analysis to inform strategic decision-making.
Flexible Oled Display Screen Market Dynamics & Structure
The Flexible OLED Display Screen market is characterized by a moderately concentrated landscape, with dominant players like LG Display, Samsung Display, Visionox, Boe Technology, TCL China Star Optoelectronics Technology, and Tianma Microelectronics leading the charge. Technological innovation serves as a primary driver, fueled by relentless R&D in advanced materials, improved pixel density, and enhanced flexibility. The regulatory framework, while still maturing, is increasingly focused on energy efficiency and material safety. Competitive product substitutes, primarily rigid OLED and advanced LCD technologies, are continuously being challenged by the superior visual experience and design freedom offered by flexible OLEDs. End-user demographics are increasingly skewed towards tech-savvy consumers and industries demanding premium, innovative display solutions. Mergers and acquisitions (M&A) remain a significant trend, as larger players consolidate their market positions and acquire specialized technological capabilities.
- Market Concentration: Dominated by a few key players, but with increasing fragmentation in niche applications.
- Technological Innovation Drivers: Advancements in substrate materials, encapsulation technologies, and manufacturing processes.
- Regulatory Frameworks: Emerging standards for device safety, environmental impact, and display performance.
- Competitive Product Substitutes: Advanced LCD, microLED, and emerging Quantum Dot technologies.
- End-User Demographics: Young, affluent consumers; automotive manufacturers; healthcare providers; and consumer electronics giants.
- M&A Trends: Strategic acquisitions to secure intellectual property and market share, with an estimated X deal volumes in the last five years.
Flexible Oled Display Screen Growth Trends & Insights
The Flexible OLED Display Screen market is poised for robust growth, driven by an expanding market size and accelerating adoption rates across a multitude of applications. Market size is projected to grow from US$XX billion in 2025 to US$XX billion by 2033, exhibiting a Compound Annual Growth Rate (CAGR) of XX%. This expansion is underpinned by significant technological disruptions, including the advent of foldable smartphones and rollable displays, which are reshaping consumer expectations and device form factors. Consumer behavior is shifting towards a demand for more immersive, portable, and versatile electronic devices, directly benefiting the flexible OLED market. The increasing integration of flexible OLEDs into automotive infotainment systems, wearable technology, and medical devices further amplifies adoption rates. Market penetration in the smartphone segment is expected to reach XX% by 2028, while automotive applications are projected to see a XX% increase in adoption over the next five years. The development of advanced materials like polyimide and ultra-thin glass (UTG) are crucial enablers of these trends, contributing to enhanced durability and flexibility. The pursuit of higher refresh rates, improved color accuracy, and lower power consumption continues to be a focal point for manufacturers, driving innovation and consumer interest. The growth trajectory is also influenced by the increasing demand for augmented reality (AR) and virtual reality (VR) devices, where flexible displays offer unique advantages in terms of form factor and immersion.
Dominant Regions, Countries, or Segments in Flexible Oled Display Screen
The Mobile Devices segment, particularly Smartphones, is the dominant driver of growth in the Flexible OLED Display Screen market. This segment consistently accounts for the largest market share, estimated at XX% in 2025, and is projected to reach US$XX billion by 2033. Key drivers for its dominance include the insatiable consumer demand for premium smartphones with innovative designs, such as foldable and edge-to-edge displays. Leading countries in this segment include South Korea and China, owing to the presence of major smartphone manufacturers and advanced display technology ecosystems. For instance, South Korea, home to giants like Samsung Display, holds a significant share in the production and innovation of flexible OLED panels. China, with companies like BOE Technology and Visionox, is rapidly increasing its production capacity and technological prowess, capturing a substantial portion of the global market.
Within the Type categorization, Flexible Foldable Screens are currently experiencing the most significant growth. This type of display enables revolutionary device form factors, like foldable smartphones and laptops, which have seen a surge in popularity. The market share for foldable screens is expected to grow from XX% in 2025 to XX% by 2033. This growth is propelled by substantial investments from smartphone manufacturers in research and development of foldable devices. Furthermore, advancements in hinge mechanisms and display durability are making foldable phones more practical and appealing to a wider consumer base.
The Automotive Display System segment is emerging as a powerful secondary growth engine. As cars become more technologically advanced, there's an increasing demand for sophisticated, curved, and integrated displays that enhance the driver and passenger experience. This segment is projected to grow at a CAGR of XX% from 2025 to 2033, reaching an estimated market value of US$XX billion. Countries like Germany, the US, and China, with their robust automotive industries and focus on in-car technology, are leading this adoption. Economic policies promoting smart mobility and the development of autonomous driving technologies further bolster this segment's potential.
Flexible Oled Display Screen Product Landscape
The flexible OLED display screen product landscape is defined by its unparalleled design freedom and visual superiority. Innovations are centered around creating thinner, lighter, and more durable displays capable of being bent, folded, or curved. Products like the Samsung Galaxy Z Fold and Flip series showcase the pinnacle of Flexible Foldable Screen technology, offering users unprecedented portability and multi-tasking capabilities. Flexible Curved Screens are revolutionizing the automotive sector, providing immersive dashboards and infotainment systems that seamlessly integrate into vehicle interiors. Medical equipment manufacturers are leveraging Flexible Bendable Screens for advanced diagnostic tools and wearable health monitors, offering ergonomic advantages and enhanced patient comfort. Key performance metrics include improved contrast ratios, wider color gamuts, faster response times, and lower power consumption compared to traditional display technologies. Unique selling propositions revolve around aesthetic appeal, enhanced user experience, and the ability to create entirely new product categories.
Key Drivers, Barriers & Challenges in Flexible Oled Display Screen
Key Drivers:
- Technological Advancements: Continuous innovation in OLED materials, encapsulation, and manufacturing processes enabling greater flexibility and durability.
- Growing Demand for Innovative Consumer Electronics: The popularity of foldable smartphones, smartwatches, and other wearable devices fuels demand.
- Increasing Integration in Automotive Sector: Flexible displays are becoming integral to advanced in-car infotainment and dashboard systems.
- Superior Visual Quality: OLED technology offers better contrast ratios, deeper blacks, and wider color gamuts.
- Government Initiatives and R&D Support: Investments in advanced display technologies in key regions.
Barriers & Challenges:
- High Manufacturing Costs: Production of flexible OLEDs remains more expensive than rigid counterparts, impacting affordability.
- Durability Concerns: While improving, long-term durability and resistance to repeated flexing are still areas of focus.
- Supply Chain Complexity: Reliance on specialized materials and manufacturing equipment can lead to supply chain vulnerabilities.
- Intense Competition: The market faces competition from emerging display technologies like microLED.
- Yield Rates and Quality Control: Maintaining high yield rates and consistent quality during mass production can be challenging. Quantifiable impacts of these challenges include an estimated XX% increase in production costs compared to rigid OLEDs and a potential delay in market penetration for certain applications due to durability concerns.
Emerging Opportunities in Flexible Oled Display Screen
Emerging opportunities in the flexible OLED display screen industry are vast and multifaceted. The integration of flexible OLEDs into augmented reality (AR) and virtual reality (VR) devices presents a significant growth avenue, offering the potential for more immersive and lightweight headsets. The healthcare sector is a largely untapped market, with applications ranging from flexible diagnostic displays for remote patient monitoring to advanced surgical visualization tools. Furthermore, the expansion of flexible OLED technology into the wearables market beyond smartwatches, such as smart textiles and flexible e-readers, holds considerable promise. The development of transparent and stretchable OLED displays will unlock entirely new design possibilities for consumer electronics and architectural applications.
Growth Accelerators in the Flexible Oled Display Screen Industry
Several catalysts are accelerating growth in the flexible OLED display screen industry. Continuous technological breakthroughs in materials science, particularly in the development of more durable and cost-effective substrates and encapsulation layers, are critical. Strategic partnerships between display manufacturers, component suppliers, and end-product brands are crucial for co-development and faster market adoption. Market expansion strategies, including targeting emerging economies and diversifying into new application verticals beyond mobile devices, are driving further growth. The ongoing miniaturization of components and improvements in power efficiency will also play a vital role in enabling more sophisticated and widespread flexible OLED applications.
Key Players Shaping the Flexible Oled Display Screen Market
- LG Display
- Samsung Display
- Visionox
- Boe Technology
- TCL China Star Optoelectronics Technology
- Tianma Microelectronics
- Royole Corporation
- EverDisplay Optronics
Notable Milestones in Flexible Oled Display Screen Sector
- 2019: Samsung unveils the first commercially available foldable smartphone with a flexible OLED display, revolutionizing the smartphone form factor.
- 2020: LG Display begins mass production of flexible OLED panels for automotive applications, significantly expanding its market reach.
- 2021: BOE Technology announces advancements in their foldable OLED technology, aiming to compete more aggressively with established players.
- 2022: TCL China Star Optoelectronics Technology showcases innovative rollable and foldable display prototypes, signaling future product diversification.
- 2023 (Q1): Visionox achieves a breakthrough in improving the lifespan and brightness of flexible OLED displays, addressing key durability concerns.
- 2023 (Q3): Tianma Microelectronics announces strategic partnerships to enhance its flexible OLED production capacity for medical and industrial applications.
- 2024 (H1): Royole Corporation introduces a new generation of flexible display technology with enhanced crease resistance.
In-Depth Flexible Oled Display Screen Market Outlook
The future outlook for the Flexible OLED Display Screen market is exceptionally bright, fueled by sustained innovation and expanding application horizons. Growth accelerators such as the relentless pursuit of thinner, lighter, and more energy-efficient displays, coupled with the increasing adoption of flexible OLEDs in the burgeoning automotive and medical sectors, will propel market expansion. Strategic collaborations and the continuous development of advanced manufacturing processes will further solidify the market's growth trajectory. The industry is on the cusp of unlocking novel use cases, driven by evolving consumer preferences for adaptable and immersive technologies. The market is anticipated to witness significant growth in the coming years, presenting substantial opportunities for stakeholders who can adapt to evolving technological landscapes and consumer demands.
Flexible Oled Display Screen Segmentation
-
1. Application
- 1.1. Mobile Devices
- 1.2. Automotive Display System
- 1.3. Medical Equipment
- 1.4. Other
-
2. Type
- 2.1. Flexible Curved Screen
- 2.2. Flexible Foldable Screen
- 2.3. Flexible Bendable Screen
Flexible Oled Display Screen Segmentation By Geography
-
1. North America
- 1.1. United States
- 1.2. Canada
- 1.3. Mexico
-
2. South America
- 2.1. Brazil
- 2.2. Argentina
- 2.3. Rest of South America
-
3. Europe
- 3.1. United Kingdom
- 3.2. Germany
- 3.3. France
- 3.4. Italy
- 3.5. Spain
- 3.6. Russia
- 3.7. Benelux
- 3.8. Nordics
- 3.9. Rest of Europe
-
4. Middle East & Africa
- 4.1. Turkey
- 4.2. Israel
- 4.3. GCC
- 4.4. North Africa
- 4.5. South Africa
- 4.6. Rest of Middle East & Africa
-
5. Asia Pacific
- 5.1. China
- 5.2. India
- 5.3. Japan
- 5.4. South Korea
- 5.5. ASEAN
- 5.6. Oceania
- 5.7. Rest of Asia Pacific
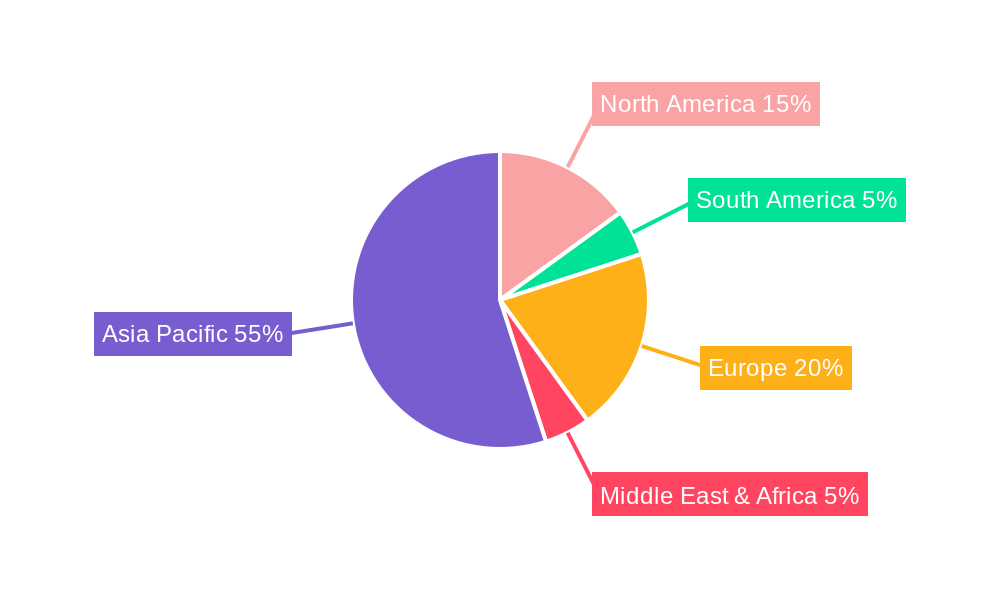
Flexible Oled Display Screen Regional Market Share
Geographic Coverage of Flexible Oled Display Screen
Flexible Oled Display Screen REPORT HIGHLIGHTS
| Aspects | Details |
|---|---|
| Study Period | 2020-2034 |
| Base Year | 2025 |
| Estimated Year | 2026 |
| Forecast Period | 2026-2034 |
| Historical Period | 2020-2025 |
| Growth Rate | CAGR of XXX% from 2020-2034 |
| Segmentation |
|
Table of Contents
- 1. Introduction
- 1.1. Research Scope
- 1.2. Market Segmentation
- 1.3. Research Methodology
- 1.4. Definitions and Assumptions
- 2. Executive Summary
- 2.1. Introduction
- 3. Market Dynamics
- 3.1. Introduction
- 3.2. Market Drivers
- 3.3. Market Restrains
- 3.4. Market Trends
- 4. Market Factor Analysis
- 4.1. Porters Five Forces
- 4.2. Supply/Value Chain
- 4.3. PESTEL analysis
- 4.4. Market Entropy
- 4.5. Patent/Trademark Analysis
- 5. Global Flexible Oled Display Screen Analysis, Insights and Forecast, 2020-2032
- 5.1. Market Analysis, Insights and Forecast - by Application
- 5.1.1. Mobile Devices
- 5.1.2. Automotive Display System
- 5.1.3. Medical Equipment
- 5.1.4. Other
- 5.2. Market Analysis, Insights and Forecast - by Type
- 5.2.1. Flexible Curved Screen
- 5.2.2. Flexible Foldable Screen
- 5.2.3. Flexible Bendable Screen
- 5.3. Market Analysis, Insights and Forecast - by Region
- 5.3.1. North America
- 5.3.2. South America
- 5.3.3. Europe
- 5.3.4. Middle East & Africa
- 5.3.5. Asia Pacific
- 5.1. Market Analysis, Insights and Forecast - by Application
- 6. North America Flexible Oled Display Screen Analysis, Insights and Forecast, 2020-2032
- 6.1. Market Analysis, Insights and Forecast - by Application
- 6.1.1. Mobile Devices
- 6.1.2. Automotive Display System
- 6.1.3. Medical Equipment
- 6.1.4. Other
- 6.2. Market Analysis, Insights and Forecast - by Type
- 6.2.1. Flexible Curved Screen
- 6.2.2. Flexible Foldable Screen
- 6.2.3. Flexible Bendable Screen
- 6.1. Market Analysis, Insights and Forecast - by Application
- 7. South America Flexible Oled Display Screen Analysis, Insights and Forecast, 2020-2032
- 7.1. Market Analysis, Insights and Forecast - by Application
- 7.1.1. Mobile Devices
- 7.1.2. Automotive Display System
- 7.1.3. Medical Equipment
- 7.1.4. Other
- 7.2. Market Analysis, Insights and Forecast - by Type
- 7.2.1. Flexible Curved Screen
- 7.2.2. Flexible Foldable Screen
- 7.2.3. Flexible Bendable Screen
- 7.1. Market Analysis, Insights and Forecast - by Application
- 8. Europe Flexible Oled Display Screen Analysis, Insights and Forecast, 2020-2032
- 8.1. Market Analysis, Insights and Forecast - by Application
- 8.1.1. Mobile Devices
- 8.1.2. Automotive Display System
- 8.1.3. Medical Equipment
- 8.1.4. Other
- 8.2. Market Analysis, Insights and Forecast - by Type
- 8.2.1. Flexible Curved Screen
- 8.2.2. Flexible Foldable Screen
- 8.2.3. Flexible Bendable Screen
- 8.1. Market Analysis, Insights and Forecast - by Application
- 9. Middle East & Africa Flexible Oled Display Screen Analysis, Insights and Forecast, 2020-2032
- 9.1. Market Analysis, Insights and Forecast - by Application
- 9.1.1. Mobile Devices
- 9.1.2. Automotive Display System
- 9.1.3. Medical Equipment
- 9.1.4. Other
- 9.2. Market Analysis, Insights and Forecast - by Type
- 9.2.1. Flexible Curved Screen
- 9.2.2. Flexible Foldable Screen
- 9.2.3. Flexible Bendable Screen
- 9.1. Market Analysis, Insights and Forecast - by Application
- 10. Asia Pacific Flexible Oled Display Screen Analysis, Insights and Forecast, 2020-2032
- 10.1. Market Analysis, Insights and Forecast - by Application
- 10.1.1. Mobile Devices
- 10.1.2. Automotive Display System
- 10.1.3. Medical Equipment
- 10.1.4. Other
- 10.2. Market Analysis, Insights and Forecast - by Type
- 10.2.1. Flexible Curved Screen
- 10.2.2. Flexible Foldable Screen
- 10.2.3. Flexible Bendable Screen
- 10.1. Market Analysis, Insights and Forecast - by Application
- 11. Competitive Analysis
- 11.1. Global Market Share Analysis 2025
- 11.2. Company Profiles
- 11.2.1 LG Display
- 11.2.1.1. Overview
- 11.2.1.2. Products
- 11.2.1.3. SWOT Analysis
- 11.2.1.4. Recent Developments
- 11.2.1.5. Financials (Based on Availability)
- 11.2.2 Samsung Display
- 11.2.2.1. Overview
- 11.2.2.2. Products
- 11.2.2.3. SWOT Analysis
- 11.2.2.4. Recent Developments
- 11.2.2.5. Financials (Based on Availability)
- 11.2.3 Visionox
- 11.2.3.1. Overview
- 11.2.3.2. Products
- 11.2.3.3. SWOT Analysis
- 11.2.3.4. Recent Developments
- 11.2.3.5. Financials (Based on Availability)
- 11.2.4 Boe Technology
- 11.2.4.1. Overview
- 11.2.4.2. Products
- 11.2.4.3. SWOT Analysis
- 11.2.4.4. Recent Developments
- 11.2.4.5. Financials (Based on Availability)
- 11.2.5 TCL China Star Optoelectronics Technology
- 11.2.5.1. Overview
- 11.2.5.2. Products
- 11.2.5.3. SWOT Analysis
- 11.2.5.4. Recent Developments
- 11.2.5.5. Financials (Based on Availability)
- 11.2.6 Tianma Microelectronics
- 11.2.6.1. Overview
- 11.2.6.2. Products
- 11.2.6.3. SWOT Analysis
- 11.2.6.4. Recent Developments
- 11.2.6.5. Financials (Based on Availability)
- 11.2.7 Royole Corporation
- 11.2.7.1. Overview
- 11.2.7.2. Products
- 11.2.7.3. SWOT Analysis
- 11.2.7.4. Recent Developments
- 11.2.7.5. Financials (Based on Availability)
- 11.2.8 EverDisplay Optronics
- 11.2.8.1. Overview
- 11.2.8.2. Products
- 11.2.8.3. SWOT Analysis
- 11.2.8.4. Recent Developments
- 11.2.8.5. Financials (Based on Availability)
- 11.2.1 LG Display
List of Figures
- Figure 1: Global Flexible Oled Display Screen Revenue Breakdown (million, %) by Region 2025 & 2033
- Figure 2: Global Flexible Oled Display Screen Volume Breakdown (K, %) by Region 2025 & 2033
- Figure 3: North America Flexible Oled Display Screen Revenue (million), by Application 2025 & 2033
- Figure 4: North America Flexible Oled Display Screen Volume (K), by Application 2025 & 2033
- Figure 5: North America Flexible Oled Display Screen Revenue Share (%), by Application 2025 & 2033
- Figure 6: North America Flexible Oled Display Screen Volume Share (%), by Application 2025 & 2033
- Figure 7: North America Flexible Oled Display Screen Revenue (million), by Type 2025 & 2033
- Figure 8: North America Flexible Oled Display Screen Volume (K), by Type 2025 & 2033
- Figure 9: North America Flexible Oled Display Screen Revenue Share (%), by Type 2025 & 2033
- Figure 10: North America Flexible Oled Display Screen Volume Share (%), by Type 2025 & 2033
- Figure 11: North America Flexible Oled Display Screen Revenue (million), by Country 2025 & 2033
- Figure 12: North America Flexible Oled Display Screen Volume (K), by Country 2025 & 2033
- Figure 13: North America Flexible Oled Display Screen Revenue Share (%), by Country 2025 & 2033
- Figure 14: North America Flexible Oled Display Screen Volume Share (%), by Country 2025 & 2033
- Figure 15: South America Flexible Oled Display Screen Revenue (million), by Application 2025 & 2033
- Figure 16: South America Flexible Oled Display Screen Volume (K), by Application 2025 & 2033
- Figure 17: South America Flexible Oled Display Screen Revenue Share (%), by Application 2025 & 2033
- Figure 18: South America Flexible Oled Display Screen Volume Share (%), by Application 2025 & 2033
- Figure 19: South America Flexible Oled Display Screen Revenue (million), by Type 2025 & 2033
- Figure 20: South America Flexible Oled Display Screen Volume (K), by Type 2025 & 2033
- Figure 21: South America Flexible Oled Display Screen Revenue Share (%), by Type 2025 & 2033
- Figure 22: South America Flexible Oled Display Screen Volume Share (%), by Type 2025 & 2033
- Figure 23: South America Flexible Oled Display Screen Revenue (million), by Country 2025 & 2033
- Figure 24: South America Flexible Oled Display Screen Volume (K), by Country 2025 & 2033
- Figure 25: South America Flexible Oled Display Screen Revenue Share (%), by Country 2025 & 2033
- Figure 26: South America Flexible Oled Display Screen Volume Share (%), by Country 2025 & 2033
- Figure 27: Europe Flexible Oled Display Screen Revenue (million), by Application 2025 & 2033
- Figure 28: Europe Flexible Oled Display Screen Volume (K), by Application 2025 & 2033
- Figure 29: Europe Flexible Oled Display Screen Revenue Share (%), by Application 2025 & 2033
- Figure 30: Europe Flexible Oled Display Screen Volume Share (%), by Application 2025 & 2033
- Figure 31: Europe Flexible Oled Display Screen Revenue (million), by Type 2025 & 2033
- Figure 32: Europe Flexible Oled Display Screen Volume (K), by Type 2025 & 2033
- Figure 33: Europe Flexible Oled Display Screen Revenue Share (%), by Type 2025 & 2033
- Figure 34: Europe Flexible Oled Display Screen Volume Share (%), by Type 2025 & 2033
- Figure 35: Europe Flexible Oled Display Screen Revenue (million), by Country 2025 & 2033
- Figure 36: Europe Flexible Oled Display Screen Volume (K), by Country 2025 & 2033
- Figure 37: Europe Flexible Oled Display Screen Revenue Share (%), by Country 2025 & 2033
- Figure 38: Europe Flexible Oled Display Screen Volume Share (%), by Country 2025 & 2033
- Figure 39: Middle East & Africa Flexible Oled Display Screen Revenue (million), by Application 2025 & 2033
- Figure 40: Middle East & Africa Flexible Oled Display Screen Volume (K), by Application 2025 & 2033
- Figure 41: Middle East & Africa Flexible Oled Display Screen Revenue Share (%), by Application 2025 & 2033
- Figure 42: Middle East & Africa Flexible Oled Display Screen Volume Share (%), by Application 2025 & 2033
- Figure 43: Middle East & Africa Flexible Oled Display Screen Revenue (million), by Type 2025 & 2033
- Figure 44: Middle East & Africa Flexible Oled Display Screen Volume (K), by Type 2025 & 2033
- Figure 45: Middle East & Africa Flexible Oled Display Screen Revenue Share (%), by Type 2025 & 2033
- Figure 46: Middle East & Africa Flexible Oled Display Screen Volume Share (%), by Type 2025 & 2033
- Figure 47: Middle East & Africa Flexible Oled Display Screen Revenue (million), by Country 2025 & 2033
- Figure 48: Middle East & Africa Flexible Oled Display Screen Volume (K), by Country 2025 & 2033
- Figure 49: Middle East & Africa Flexible Oled Display Screen Revenue Share (%), by Country 2025 & 2033
- Figure 50: Middle East & Africa Flexible Oled Display Screen Volume Share (%), by Country 2025 & 2033
- Figure 51: Asia Pacific Flexible Oled Display Screen Revenue (million), by Application 2025 & 2033
- Figure 52: Asia Pacific Flexible Oled Display Screen Volume (K), by Application 2025 & 2033
- Figure 53: Asia Pacific Flexible Oled Display Screen Revenue Share (%), by Application 2025 & 2033
- Figure 54: Asia Pacific Flexible Oled Display Screen Volume Share (%), by Application 2025 & 2033
- Figure 55: Asia Pacific Flexible Oled Display Screen Revenue (million), by Type 2025 & 2033
- Figure 56: Asia Pacific Flexible Oled Display Screen Volume (K), by Type 2025 & 2033
- Figure 57: Asia Pacific Flexible Oled Display Screen Revenue Share (%), by Type 2025 & 2033
- Figure 58: Asia Pacific Flexible Oled Display Screen Volume Share (%), by Type 2025 & 2033
- Figure 59: Asia Pacific Flexible Oled Display Screen Revenue (million), by Country 2025 & 2033
- Figure 60: Asia Pacific Flexible Oled Display Screen Volume (K), by Country 2025 & 2033
- Figure 61: Asia Pacific Flexible Oled Display Screen Revenue Share (%), by Country 2025 & 2033
- Figure 62: Asia Pacific Flexible Oled Display Screen Volume Share (%), by Country 2025 & 2033
List of Tables
- Table 1: Global Flexible Oled Display Screen Revenue million Forecast, by Application 2020 & 2033
- Table 2: Global Flexible Oled Display Screen Volume K Forecast, by Application 2020 & 2033
- Table 3: Global Flexible Oled Display Screen Revenue million Forecast, by Type 2020 & 2033
- Table 4: Global Flexible Oled Display Screen Volume K Forecast, by Type 2020 & 2033
- Table 5: Global Flexible Oled Display Screen Revenue million Forecast, by Region 2020 & 2033
- Table 6: Global Flexible Oled Display Screen Volume K Forecast, by Region 2020 & 2033
- Table 7: Global Flexible Oled Display Screen Revenue million Forecast, by Application 2020 & 2033
- Table 8: Global Flexible Oled Display Screen Volume K Forecast, by Application 2020 & 2033
- Table 9: Global Flexible Oled Display Screen Revenue million Forecast, by Type 2020 & 2033
- Table 10: Global Flexible Oled Display Screen Volume K Forecast, by Type 2020 & 2033
- Table 11: Global Flexible Oled Display Screen Revenue million Forecast, by Country 2020 & 2033
- Table 12: Global Flexible Oled Display Screen Volume K Forecast, by Country 2020 & 2033
- Table 13: United States Flexible Oled Display Screen Revenue (million) Forecast, by Application 2020 & 2033
- Table 14: United States Flexible Oled Display Screen Volume (K) Forecast, by Application 2020 & 2033
- Table 15: Canada Flexible Oled Display Screen Revenue (million) Forecast, by Application 2020 & 2033
- Table 16: Canada Flexible Oled Display Screen Volume (K) Forecast, by Application 2020 & 2033
- Table 17: Mexico Flexible Oled Display Screen Revenue (million) Forecast, by Application 2020 & 2033
- Table 18: Mexico Flexible Oled Display Screen Volume (K) Forecast, by Application 2020 & 2033
- Table 19: Global Flexible Oled Display Screen Revenue million Forecast, by Application 2020 & 2033
- Table 20: Global Flexible Oled Display Screen Volume K Forecast, by Application 2020 & 2033
- Table 21: Global Flexible Oled Display Screen Revenue million Forecast, by Type 2020 & 2033
- Table 22: Global Flexible Oled Display Screen Volume K Forecast, by Type 2020 & 2033
- Table 23: Global Flexible Oled Display Screen Revenue million Forecast, by Country 2020 & 2033
- Table 24: Global Flexible Oled Display Screen Volume K Forecast, by Country 2020 & 2033
- Table 25: Brazil Flexible Oled Display Screen Revenue (million) Forecast, by Application 2020 & 2033
- Table 26: Brazil Flexible Oled Display Screen Volume (K) Forecast, by Application 2020 & 2033
- Table 27: Argentina Flexible Oled Display Screen Revenue (million) Forecast, by Application 2020 & 2033
- Table 28: Argentina Flexible Oled Display Screen Volume (K) Forecast, by Application 2020 & 2033
- Table 29: Rest of South America Flexible Oled Display Screen Revenue (million) Forecast, by Application 2020 & 2033
- Table 30: Rest of South America Flexible Oled Display Screen Volume (K) Forecast, by Application 2020 & 2033
- Table 31: Global Flexible Oled Display Screen Revenue million Forecast, by Application 2020 & 2033
- Table 32: Global Flexible Oled Display Screen Volume K Forecast, by Application 2020 & 2033
- Table 33: Global Flexible Oled Display Screen Revenue million Forecast, by Type 2020 & 2033
- Table 34: Global Flexible Oled Display Screen Volume K Forecast, by Type 2020 & 2033
- Table 35: Global Flexible Oled Display Screen Revenue million Forecast, by Country 2020 & 2033
- Table 36: Global Flexible Oled Display Screen Volume K Forecast, by Country 2020 & 2033
- Table 37: United Kingdom Flexible Oled Display Screen Revenue (million) Forecast, by Application 2020 & 2033
- Table 38: United Kingdom Flexible Oled Display Screen Volume (K) Forecast, by Application 2020 & 2033
- Table 39: Germany Flexible Oled Display Screen Revenue (million) Forecast, by Application 2020 & 2033
- Table 40: Germany Flexible Oled Display Screen Volume (K) Forecast, by Application 2020 & 2033
- Table 41: France Flexible Oled Display Screen Revenue (million) Forecast, by Application 2020 & 2033
- Table 42: France Flexible Oled Display Screen Volume (K) Forecast, by Application 2020 & 2033
- Table 43: Italy Flexible Oled Display Screen Revenue (million) Forecast, by Application 2020 & 2033
- Table 44: Italy Flexible Oled Display Screen Volume (K) Forecast, by Application 2020 & 2033
- Table 45: Spain Flexible Oled Display Screen Revenue (million) Forecast, by Application 2020 & 2033
- Table 46: Spain Flexible Oled Display Screen Volume (K) Forecast, by Application 2020 & 2033
- Table 47: Russia Flexible Oled Display Screen Revenue (million) Forecast, by Application 2020 & 2033
- Table 48: Russia Flexible Oled Display Screen Volume (K) Forecast, by Application 2020 & 2033
- Table 49: Benelux Flexible Oled Display Screen Revenue (million) Forecast, by Application 2020 & 2033
- Table 50: Benelux Flexible Oled Display Screen Volume (K) Forecast, by Application 2020 & 2033
- Table 51: Nordics Flexible Oled Display Screen Revenue (million) Forecast, by Application 2020 & 2033
- Table 52: Nordics Flexible Oled Display Screen Volume (K) Forecast, by Application 2020 & 2033
- Table 53: Rest of Europe Flexible Oled Display Screen Revenue (million) Forecast, by Application 2020 & 2033
- Table 54: Rest of Europe Flexible Oled Display Screen Volume (K) Forecast, by Application 2020 & 2033
- Table 55: Global Flexible Oled Display Screen Revenue million Forecast, by Application 2020 & 2033
- Table 56: Global Flexible Oled Display Screen Volume K Forecast, by Application 2020 & 2033
- Table 57: Global Flexible Oled Display Screen Revenue million Forecast, by Type 2020 & 2033
- Table 58: Global Flexible Oled Display Screen Volume K Forecast, by Type 2020 & 2033
- Table 59: Global Flexible Oled Display Screen Revenue million Forecast, by Country 2020 & 2033
- Table 60: Global Flexible Oled Display Screen Volume K Forecast, by Country 2020 & 2033
- Table 61: Turkey Flexible Oled Display Screen Revenue (million) Forecast, by Application 2020 & 2033
- Table 62: Turkey Flexible Oled Display Screen Volume (K) Forecast, by Application 2020 & 2033
- Table 63: Israel Flexible Oled Display Screen Revenue (million) Forecast, by Application 2020 & 2033
- Table 64: Israel Flexible Oled Display Screen Volume (K) Forecast, by Application 2020 & 2033
- Table 65: GCC Flexible Oled Display Screen Revenue (million) Forecast, by Application 2020 & 2033
- Table 66: GCC Flexible Oled Display Screen Volume (K) Forecast, by Application 2020 & 2033
- Table 67: North Africa Flexible Oled Display Screen Revenue (million) Forecast, by Application 2020 & 2033
- Table 68: North Africa Flexible Oled Display Screen Volume (K) Forecast, by Application 2020 & 2033
- Table 69: South Africa Flexible Oled Display Screen Revenue (million) Forecast, by Application 2020 & 2033
- Table 70: South Africa Flexible Oled Display Screen Volume (K) Forecast, by Application 2020 & 2033
- Table 71: Rest of Middle East & Africa Flexible Oled Display Screen Revenue (million) Forecast, by Application 2020 & 2033
- Table 72: Rest of Middle East & Africa Flexible Oled Display Screen Volume (K) Forecast, by Application 2020 & 2033
- Table 73: Global Flexible Oled Display Screen Revenue million Forecast, by Application 2020 & 2033
- Table 74: Global Flexible Oled Display Screen Volume K Forecast, by Application 2020 & 2033
- Table 75: Global Flexible Oled Display Screen Revenue million Forecast, by Type 2020 & 2033
- Table 76: Global Flexible Oled Display Screen Volume K Forecast, by Type 2020 & 2033
- Table 77: Global Flexible Oled Display Screen Revenue million Forecast, by Country 2020 & 2033
- Table 78: Global Flexible Oled Display Screen Volume K Forecast, by Country 2020 & 2033
- Table 79: China Flexible Oled Display Screen Revenue (million) Forecast, by Application 2020 & 2033
- Table 80: China Flexible Oled Display Screen Volume (K) Forecast, by Application 2020 & 2033
- Table 81: India Flexible Oled Display Screen Revenue (million) Forecast, by Application 2020 & 2033
- Table 82: India Flexible Oled Display Screen Volume (K) Forecast, by Application 2020 & 2033
- Table 83: Japan Flexible Oled Display Screen Revenue (million) Forecast, by Application 2020 & 2033
- Table 84: Japan Flexible Oled Display Screen Volume (K) Forecast, by Application 2020 & 2033
- Table 85: South Korea Flexible Oled Display Screen Revenue (million) Forecast, by Application 2020 & 2033
- Table 86: South Korea Flexible Oled Display Screen Volume (K) Forecast, by Application 2020 & 2033
- Table 87: ASEAN Flexible Oled Display Screen Revenue (million) Forecast, by Application 2020 & 2033
- Table 88: ASEAN Flexible Oled Display Screen Volume (K) Forecast, by Application 2020 & 2033
- Table 89: Oceania Flexible Oled Display Screen Revenue (million) Forecast, by Application 2020 & 2033
- Table 90: Oceania Flexible Oled Display Screen Volume (K) Forecast, by Application 2020 & 2033
- Table 91: Rest of Asia Pacific Flexible Oled Display Screen Revenue (million) Forecast, by Application 2020 & 2033
- Table 92: Rest of Asia Pacific Flexible Oled Display Screen Volume (K) Forecast, by Application 2020 & 2033
Frequently Asked Questions
1. What is the projected Compound Annual Growth Rate (CAGR) of the Flexible Oled Display Screen?
The projected CAGR is approximately XXX%.
2. Which companies are prominent players in the Flexible Oled Display Screen?
Key companies in the market include LG Display, Samsung Display, Visionox, Boe Technology, TCL China Star Optoelectronics Technology, Tianma Microelectronics, Royole Corporation, EverDisplay Optronics.
3. What are the main segments of the Flexible Oled Display Screen?
The market segments include Application, Type.
4. Can you provide details about the market size?
The market size is estimated to be USD XXX million as of 2022.
5. What are some drivers contributing to market growth?
N/A
6. What are the notable trends driving market growth?
N/A
7. Are there any restraints impacting market growth?
N/A
8. Can you provide examples of recent developments in the market?
N/A
9. What pricing options are available for accessing the report?
Pricing options include single-user, multi-user, and enterprise licenses priced at USD 3950.00, USD 5925.00, and USD 7900.00 respectively.
10. Is the market size provided in terms of value or volume?
The market size is provided in terms of value, measured in million and volume, measured in K.
11. Are there any specific market keywords associated with the report?
Yes, the market keyword associated with the report is "Flexible Oled Display Screen," which aids in identifying and referencing the specific market segment covered.
12. How do I determine which pricing option suits my needs best?
The pricing options vary based on user requirements and access needs. Individual users may opt for single-user licenses, while businesses requiring broader access may choose multi-user or enterprise licenses for cost-effective access to the report.
13. Are there any additional resources or data provided in the Flexible Oled Display Screen report?
While the report offers comprehensive insights, it's advisable to review the specific contents or supplementary materials provided to ascertain if additional resources or data are available.
14. How can I stay updated on further developments or reports in the Flexible Oled Display Screen?
To stay informed about further developments, trends, and reports in the Flexible Oled Display Screen, consider subscribing to industry newsletters, following relevant companies and organizations, or regularly checking reputable industry news sources and publications.
Methodology
Step 1 - Identification of Relevant Samples Size from Population Database


Step 2 - Approaches for Defining Global Market Size (Value, Volume* & Price*)

Note*: In applicable scenarios
Step 3 - Data Sources
Primary Research
- Web Analytics
- Survey Reports
- Research Institute
- Latest Research Reports
- Opinion Leaders
Secondary Research
- Annual Reports
- White Paper
- Latest Press Release
- Industry Association
- Paid Database
- Investor Presentations

Step 4 - Data Triangulation
Involves using different sources of information in order to increase the validity of a study
These sources are likely to be stakeholders in a program - participants, other researchers, program staff, other community members, and so on.
Then we put all data in single framework & apply various statistical tools to find out the dynamic on the market.
During the analysis stage, feedback from the stakeholder groups would be compared to determine areas of agreement as well as areas of divergence