

Key Insights
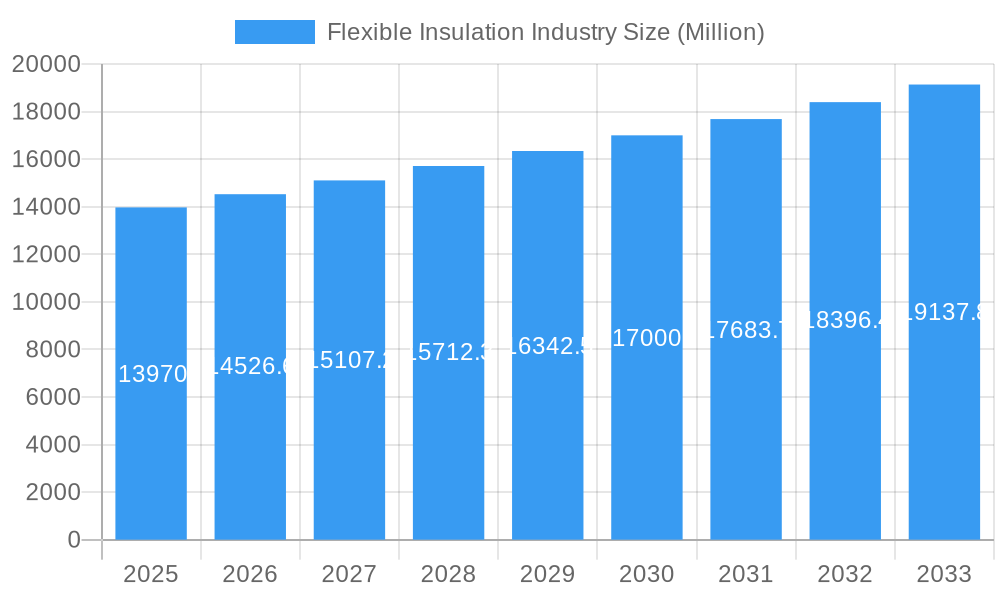
The flexible insulation market, valued at $13.97 billion in 2025, is projected to experience robust growth, driven by a Compound Annual Growth Rate (CAGR) of 3.84% from 2025 to 2033. This expansion is fueled by several key factors. The increasing demand for energy-efficient buildings across residential and commercial sectors is a major catalyst, pushing the adoption of flexible insulation materials in construction projects worldwide. Furthermore, stringent government regulations aimed at reducing carbon emissions are incentivizing the use of high-performance insulation solutions. The rising awareness of the benefits of acoustic and thermal insulation for improved comfort and reduced noise pollution also contributes significantly to market growth. Technological advancements leading to the development of innovative materials like aerogel and cross-linked polyethylene, offering superior insulation properties and durability, are further accelerating market expansion. The segmentation by material (aerogel, cross-linked polyethylene, elastomer, fiberglass, other materials) and insulation type (acoustic, electrical, thermal) reveals diverse application opportunities, influencing market dynamics across different regions.
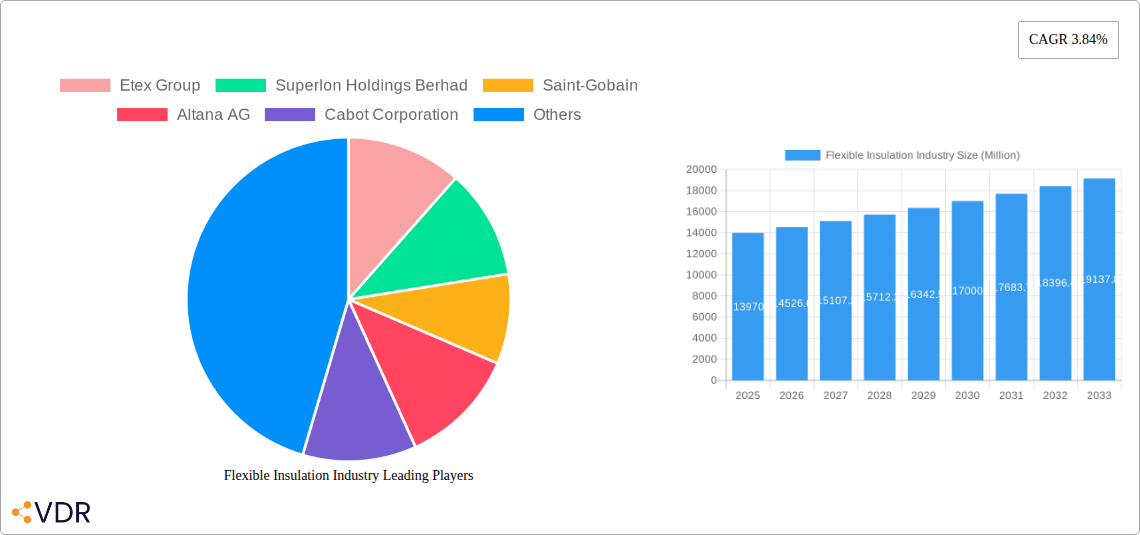
Flexible Insulation Industry Market Size (In Billion)
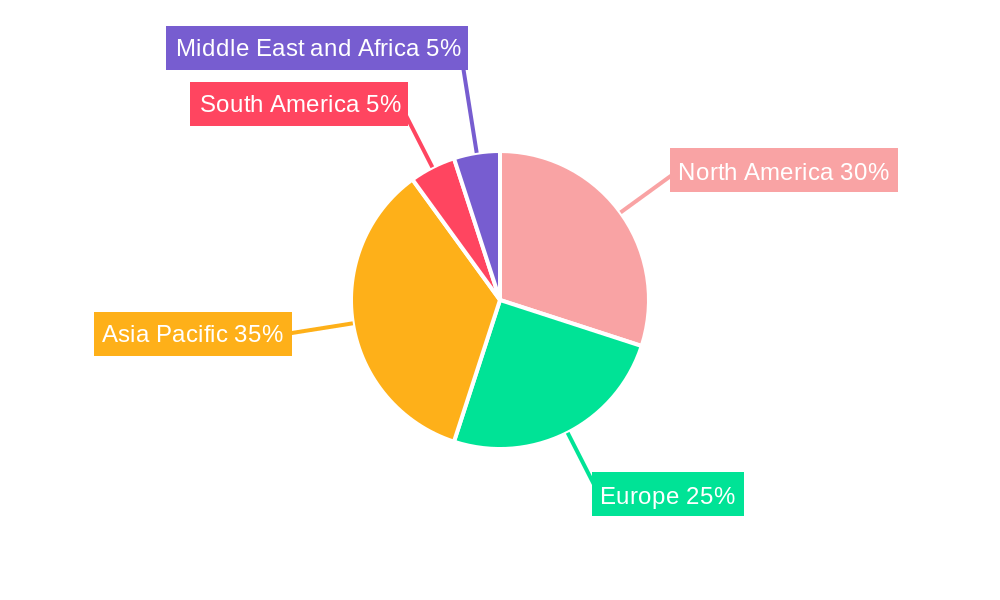
Growth is expected to be particularly strong in regions experiencing rapid urbanization and industrialization, such as Asia-Pacific, with significant contributions from major economies like China and India. North America and Europe, while mature markets, will continue to see steady growth, driven by renovation projects and the implementation of sustainable building codes. However, factors like fluctuating raw material prices and the potential impact of economic downturns represent potential restraints to market growth. Nevertheless, the overall outlook for the flexible insulation market remains positive, with continued expansion anticipated throughout the forecast period (2025-2033), driven by ongoing trends in energy efficiency, sustainability, and comfort enhancement within the built environment. Competition among established players like Etex Group, Saint-Gobain, and Armacell, alongside emerging players, will further shape market dynamics and innovation in the coming years.
Flexible Insulation Industry Company Market Share
This comprehensive report provides a detailed analysis of the flexible insulation market, covering market dynamics, growth trends, regional insights, product landscape, and key players. The study period spans from 2019 to 2033, with 2025 as the base and estimated year. The report utilizes data from 2019-2024 as the historical period and forecasts market trends from 2025-2033. This in-depth analysis is crucial for industry professionals, investors, and strategic decision-makers seeking to understand and capitalize on opportunities within this dynamic market. The total market size in 2025 is estimated at xx Million units.
Flexible Insulation Industry Market Dynamics & Structure
The flexible insulation market is characterized by moderate concentration, with key players like Saint-Gobain, Owens Corning, and Kingspan Group holding significant market share. Technological innovation, particularly in materials science and manufacturing processes, is a major driver. Stringent environmental regulations regarding energy efficiency and carbon emissions are shaping product development and adoption. Competitive pressures from substitute materials, such as spray foam insulation, exist but are mitigated by the flexibility and ease of installation of flexible insulation. End-user demographics are diverse, spanning construction, industrial, and transportation sectors. The market has witnessed a moderate level of M&A activity in recent years, with xx deals recorded between 2019 and 2024, primarily focused on expanding product portfolios and geographic reach.
- Market Concentration: Moderately concentrated, with top 5 players holding approximately xx% market share in 2025.
- Technological Innovation: Driven by advancements in materials like aerogel and cross-linked polyethylene, improving performance and efficiency.
- Regulatory Framework: Stringent energy efficiency standards and environmental regulations are key growth drivers.
- Competitive Substitutes: Spray foam and rigid insulation pose some competition, but flexible insulation maintains its advantage in specific applications.
- End-User Demographics: Diverse, including building & construction (xx%), industrial (xx%), and transportation (xx%).
- M&A Trends: Moderate activity with xx deals between 2019-2024, focusing on expansion and diversification.
Flexible Insulation Industry Growth Trends & Insights
The flexible insulation market exhibited a CAGR of xx% during the historical period (2019-2024), driven by robust growth in the construction and industrial sectors. Market penetration is high in developed regions but remains significant growth potential in emerging economies. Technological disruptions, such as the introduction of innovative materials with enhanced thermal performance and sustainability features, are driving adoption rates. Consumer behavior shifts towards energy-efficient and eco-friendly building materials are further propelling market expansion. The forecast period (2025-2033) projects a CAGR of xx%, reaching an estimated market size of xx Million units by 2033. Increased investments in infrastructure projects and government initiatives promoting energy efficiency are expected to further stimulate growth.
Dominant Regions, Countries, or Segments in Flexible Insulation Industry
North America and Europe currently dominate the flexible insulation market, driven by stringent building codes and high energy costs. Within materials, fiberglass holds the largest market share (xx%), followed by cross-linked polyethylene (xx%) and elastomer (xx%). Within insulation types, thermal insulation accounts for the largest segment (xx%), followed by acoustic (xx%) and electrical insulation (xx%). Key growth drivers vary regionally: North America benefits from robust construction activity and energy efficiency programs, while Asia-Pacific’s growth is fueled by rapid urbanization and industrialization.
- North America: Strong growth driven by high construction activity and energy efficiency regulations.
- Europe: High market penetration, but continued growth expected due to renovation projects and stricter environmental norms.
- Asia-Pacific: Rapid expansion fueled by infrastructure development and rising industrial output.
- Fiberglass: Largest market share due to its cost-effectiveness and versatility.
- Cross-linked Polyethylene: Growing segment due to its superior performance characteristics in specific applications.
- Thermal Insulation: Largest insulation type segment, driven by demand for energy-efficient buildings.
Flexible Insulation Industry Product Landscape
Recent innovations focus on improving thermal performance, reducing environmental impact, and enhancing ease of installation. Products now incorporate advanced materials such as aerogel for superior insulation properties and recycled content for sustainability. Key applications include building insulation, industrial equipment, and transportation vehicles. Unique selling propositions include improved energy efficiency, enhanced durability, and reduced installation time.
Key Drivers, Barriers & Challenges in Flexible Insulation Industry
Key Drivers:
- Growing demand for energy-efficient buildings and infrastructure.
- Increasing awareness of energy costs and environmental concerns.
- Stringent government regulations and incentives promoting energy conservation.
- Technological advancements leading to improved insulation materials and manufacturing processes.
Key Barriers & Challenges:
- Fluctuations in raw material prices impacting production costs.
- Competition from substitute materials with different price points and characteristics.
- Supply chain disruptions impacting availability and timely delivery of products.
- Regulatory hurdles and compliance requirements varying across different regions.
Emerging Opportunities in Flexible Insulation Industry
- Expansion into untapped markets in developing economies.
- Development of innovative applications in emerging sectors like renewable energy and smart buildings.
- Growing demand for sustainable and eco-friendly insulation materials.
- Increased adoption of advanced technologies such as IoT sensors for monitoring insulation performance.
Growth Accelerators in the Flexible Insulation Industry Industry
Long-term growth is expected to be driven by technological advancements in material science and manufacturing leading to more efficient and sustainable insulation solutions. Strategic partnerships between insulation manufacturers and construction companies will facilitate market penetration and adoption. Government policies promoting energy efficiency and green building standards will significantly impact market demand. Expansion into new applications, particularly in emerging sectors, will create new growth avenues.
Key Players Shaping the Flexible Insulation Industry Market
Notable Milestones in Flexible Insulation Industry Sector
- 2021: Saint-Gobain launched a new line of eco-friendly flexible insulation.
- 2022: Kingspan acquired a smaller insulation manufacturer, expanding its market reach.
- 2023: Owens Corning invested in R&D to develop new aerogel-based insulation materials.
- 2024: Several companies announced initiatives to increase the use of recycled content in their insulation products. (Further details on specific developments from the study period will be provided within the full report)
In-Depth Flexible Insulation Industry Market Outlook
The flexible insulation market is poised for robust growth over the forecast period, driven by several factors, including continued urbanization, rising energy costs, and increased awareness of environmental sustainability. Strategic opportunities exist in developing innovative products with enhanced performance characteristics, expanding into untapped markets, and forging strategic partnerships to strengthen market presence. Companies that successfully adapt to evolving market trends and consumer preferences are well-positioned to capture significant market share in the years to come.
Flexible Insulation Industry Segmentation
-
1. Material
- 1.1. Aerogel
- 1.2. Cross-Linked Polyethylene
- 1.3. Elastomer
- 1.4. Fiberglass
- 1.5. Other Materials
-
2. Insulation Type
- 2.1. Acoustic Insulation
- 2.2. Electrical Insulation
- 2.3. Thermal Insulation
Flexible Insulation Industry Segmentation By Geography
-
1. Asia Pacific
- 1.1. China
- 1.2. India
- 1.3. Japan
- 1.4. South Korea
- 1.5. Rest of Asia Pacific
-
2. North America
- 2.1. United States
- 2.2. Canada
- 2.3. Mexico
-
3. Europe
- 3.1. Germany
- 3.2. United Kingdom
- 3.3. France
- 3.4. Italy
- 3.5. Rest of Europe
-
4. South America
- 4.1. Brazil
- 4.2. Argentina
- 4.3. Rest of South America
-
5. Middle East and Africa
- 5.1. Saudi Arabia
- 5.2. South Africa
- 5.3. Rest of Middle East and Africa
Flexible Insulation Industry Regional Market Share
Geographic Coverage of Flexible Insulation Industry
Flexible Insulation Industry REPORT HIGHLIGHTS
| Aspects | Details |
|---|---|
| Study Period | 2020-2034 |
| Base Year | 2025 |
| Estimated Year | 2026 |
| Forecast Period | 2026-2034 |
| Historical Period | 2020-2025 |
| Growth Rate | CAGR of 3.84% from 2020-2034 |
| Segmentation |
|
Table of Contents
- 1. Introduction
- 1.1. Research Scope
- 1.2. Market Segmentation
- 1.3. Research Objective
- 1.4. Definitions and Assumptions
- 2. Executive Summary
- 2.1. Market Snapshot
- 3. Market Dynamics
- 3.1. Market Drivers
- 3.2. Market Restrains
- 3.3. Market Trends
- 3.4. Market Opportunities
- 4. Market Factor Analysis
- 4.1. Porters Five Forces
- 4.1.1. Bargaining Power of Suppliers
- 4.1.2. Bargaining Power of Buyers
- 4.1.3. Threat of New Entrants
- 4.1.4. Threat of Substitutes
- 4.1.5. Competitive Rivalry
- 4.2. PESTEL analysis
- 4.3. BCG Analysis
- 4.3.1. Stars (High Growth, High Market Share)
- 4.3.2. Cash Cows (Low Growth, High Market Share)
- 4.3.3. Question Mark (High Growth, Low Market Share)
- 4.3.4. Dogs (Low Growth, Low Market Share)
- 4.4. Ansoff Matrix Analysis
- 4.5. Supply Chain Analysis
- 4.6. Regulatory Landscape
- 4.7. Current Market Potential and Opportunity Assessment (TAM–SAM–SOM Framework)
- 4.8. VDR Analyst Note
- 4.1. Porters Five Forces
- 5. Market Analysis, Insights and Forecast 2021-2033
- 5.1. Market Analysis, Insights and Forecast - by Material
- 5.1.1. Aerogel
- 5.1.2. Cross-Linked Polyethylene
- 5.1.3. Elastomer
- 5.1.4. Fiberglass
- 5.1.5. Other Materials
- 5.2. Market Analysis, Insights and Forecast - by Insulation Type
- 5.2.1. Acoustic Insulation
- 5.2.2. Electrical Insulation
- 5.2.3. Thermal Insulation
- 5.3. Market Analysis, Insights and Forecast - by Region
- 5.3.1. Asia Pacific
- 5.3.2. North America
- 5.3.3. Europe
- 5.3.4. South America
- 5.3.5. Middle East and Africa
- 5.1. Market Analysis, Insights and Forecast - by Material
- 6. Global Flexible Insulation Industry Analysis, Insights and Forecast, 2021-2033
- 6.1. Market Analysis, Insights and Forecast - by Material
- 6.1.1. Aerogel
- 6.1.2. Cross-Linked Polyethylene
- 6.1.3. Elastomer
- 6.1.4. Fiberglass
- 6.1.5. Other Materials
- 6.2. Market Analysis, Insights and Forecast - by Insulation Type
- 6.2.1. Acoustic Insulation
- 6.2.2. Electrical Insulation
- 6.2.3. Thermal Insulation
- 6.1. Market Analysis, Insights and Forecast - by Material
- 7. Asia Pacific Flexible Insulation Industry Analysis, Insights and Forecast, 2021-2033
- 7.1. Market Analysis, Insights and Forecast - by Material
- 7.1.1. Aerogel
- 7.1.2. Cross-Linked Polyethylene
- 7.1.3. Elastomer
- 7.1.4. Fiberglass
- 7.1.5. Other Materials
- 7.2. Market Analysis, Insights and Forecast - by Insulation Type
- 7.2.1. Acoustic Insulation
- 7.2.2. Electrical Insulation
- 7.2.3. Thermal Insulation
- 7.1. Market Analysis, Insights and Forecast - by Material
- 8. North America Flexible Insulation Industry Analysis, Insights and Forecast, 2021-2033
- 8.1. Market Analysis, Insights and Forecast - by Material
- 8.1.1. Aerogel
- 8.1.2. Cross-Linked Polyethylene
- 8.1.3. Elastomer
- 8.1.4. Fiberglass
- 8.1.5. Other Materials
- 8.2. Market Analysis, Insights and Forecast - by Insulation Type
- 8.2.1. Acoustic Insulation
- 8.2.2. Electrical Insulation
- 8.2.3. Thermal Insulation
- 8.1. Market Analysis, Insights and Forecast - by Material
- 9. Europe Flexible Insulation Industry Analysis, Insights and Forecast, 2021-2033
- 9.1. Market Analysis, Insights and Forecast - by Material
- 9.1.1. Aerogel
- 9.1.2. Cross-Linked Polyethylene
- 9.1.3. Elastomer
- 9.1.4. Fiberglass
- 9.1.5. Other Materials
- 9.2. Market Analysis, Insights and Forecast - by Insulation Type
- 9.2.1. Acoustic Insulation
- 9.2.2. Electrical Insulation
- 9.2.3. Thermal Insulation
- 9.1. Market Analysis, Insights and Forecast - by Material
- 10. South America Flexible Insulation Industry Analysis, Insights and Forecast, 2021-2033
- 10.1. Market Analysis, Insights and Forecast - by Material
- 10.1.1. Aerogel
- 10.1.2. Cross-Linked Polyethylene
- 10.1.3. Elastomer
- 10.1.4. Fiberglass
- 10.1.5. Other Materials
- 10.2. Market Analysis, Insights and Forecast - by Insulation Type
- 10.2.1. Acoustic Insulation
- 10.2.2. Electrical Insulation
- 10.2.3. Thermal Insulation
- 10.1. Market Analysis, Insights and Forecast - by Material
- 11. Middle East and Africa Flexible Insulation Industry Analysis, Insights and Forecast, 2021-2033
- 11.1. Market Analysis, Insights and Forecast - by Material
- 11.1.1. Aerogel
- 11.1.2. Cross-Linked Polyethylene
- 11.1.3. Elastomer
- 11.1.4. Fiberglass
- 11.1.5. Other Materials
- 11.2. Market Analysis, Insights and Forecast - by Insulation Type
- 11.2.1. Acoustic Insulation
- 11.2.2. Electrical Insulation
- 11.2.3. Thermal Insulation
- 11.1. Market Analysis, Insights and Forecast - by Material
- 12. Competitive Analysis
- 12.1. Company Profiles
- 12.1.1 Etex Group
- 12.1.1.1. Company Overview
- 12.1.1.2. Products
- 12.1.1.3. Company Financials
- 12.1.1.4. SWOT Analysis
- 12.1.2 Superlon Holdings Berhad
- 12.1.2.1. Company Overview
- 12.1.2.2. Products
- 12.1.2.3. Company Financials
- 12.1.2.4. SWOT Analysis
- 12.1.3 Saint-Gobain
- 12.1.3.1. Company Overview
- 12.1.3.2. Products
- 12.1.3.3. Company Financials
- 12.1.3.4. SWOT Analysis
- 12.1.4 Altana AG
- 12.1.4.1. Company Overview
- 12.1.4.2. Products
- 12.1.4.3. Company Financials
- 12.1.4.4. SWOT Analysis
- 12.1.5 Cabot Corporation
- 12.1.5.1. Company Overview
- 12.1.5.2. Products
- 12.1.5.3. Company Financials
- 12.1.5.4. SWOT Analysis
- 12.1.6 Armacell
- 12.1.6.1. Company Overview
- 12.1.6.2. Products
- 12.1.6.3. Company Financials
- 12.1.6.4. SWOT Analysis
- 12.1.7 Fletcher Insulation
- 12.1.7.1. Company Overview
- 12.1.7.2. Products
- 12.1.7.3. Company Financials
- 12.1.7.4. SWOT Analysis
- 12.1.8 Thermaxx Jackets
- 12.1.8.1. Company Overview
- 12.1.8.2. Products
- 12.1.8.3. Company Financials
- 12.1.8.4. SWOT Analysis
- 12.1.9 Owens Corning
- 12.1.9.1. Company Overview
- 12.1.9.2. Products
- 12.1.9.3. Company Financials
- 12.1.9.4. SWOT Analysis
- 12.1.10 Kingspan Group
- 12.1.10.1. Company Overview
- 12.1.10.2. Products
- 12.1.10.3. Company Financials
- 12.1.10.4. SWOT Analysis
- 12.1.11 Knauf Insulation
- 12.1.11.1. Company Overview
- 12.1.11.2. Products
- 12.1.11.3. Company Financials
- 12.1.11.4. SWOT Analysis
- 12.1.12 Johns Manville
- 12.1.12.1. Company Overview
- 12.1.12.2. Products
- 12.1.12.3. Company Financials
- 12.1.12.4. SWOT Analysis
- 12.1.1 Etex Group
- 12.2. Market Entropy
- 12.2.1 Company's Key Areas Served
- 12.2.2 Recent Developments
- 12.3. Company Market Share Analysis 2025
- 12.3.1 Top 5 Companies Market Share Analysis
- 12.3.2 Top 3 Companies Market Share Analysis
- 12.4. List of Potential Customers
- 13. Research Methodology
List of Figures
- Figure 1: Global Flexible Insulation Industry Revenue Breakdown (Million, %) by Region 2025 & 2033
- Figure 2: Global Flexible Insulation Industry Volume Breakdown (K Tons, %) by Region 2025 & 2033
- Figure 3: Asia Pacific Flexible Insulation Industry Revenue (Million), by Material 2025 & 2033
- Figure 4: Asia Pacific Flexible Insulation Industry Volume (K Tons), by Material 2025 & 2033
- Figure 5: Asia Pacific Flexible Insulation Industry Revenue Share (%), by Material 2025 & 2033
- Figure 6: Asia Pacific Flexible Insulation Industry Volume Share (%), by Material 2025 & 2033
- Figure 7: Asia Pacific Flexible Insulation Industry Revenue (Million), by Insulation Type 2025 & 2033
- Figure 8: Asia Pacific Flexible Insulation Industry Volume (K Tons), by Insulation Type 2025 & 2033
- Figure 9: Asia Pacific Flexible Insulation Industry Revenue Share (%), by Insulation Type 2025 & 2033
- Figure 10: Asia Pacific Flexible Insulation Industry Volume Share (%), by Insulation Type 2025 & 2033
- Figure 11: Asia Pacific Flexible Insulation Industry Revenue (Million), by Country 2025 & 2033
- Figure 12: Asia Pacific Flexible Insulation Industry Volume (K Tons), by Country 2025 & 2033
- Figure 13: Asia Pacific Flexible Insulation Industry Revenue Share (%), by Country 2025 & 2033
- Figure 14: Asia Pacific Flexible Insulation Industry Volume Share (%), by Country 2025 & 2033
- Figure 15: North America Flexible Insulation Industry Revenue (Million), by Material 2025 & 2033
- Figure 16: North America Flexible Insulation Industry Volume (K Tons), by Material 2025 & 2033
- Figure 17: North America Flexible Insulation Industry Revenue Share (%), by Material 2025 & 2033
- Figure 18: North America Flexible Insulation Industry Volume Share (%), by Material 2025 & 2033
- Figure 19: North America Flexible Insulation Industry Revenue (Million), by Insulation Type 2025 & 2033
- Figure 20: North America Flexible Insulation Industry Volume (K Tons), by Insulation Type 2025 & 2033
- Figure 21: North America Flexible Insulation Industry Revenue Share (%), by Insulation Type 2025 & 2033
- Figure 22: North America Flexible Insulation Industry Volume Share (%), by Insulation Type 2025 & 2033
- Figure 23: North America Flexible Insulation Industry Revenue (Million), by Country 2025 & 2033
- Figure 24: North America Flexible Insulation Industry Volume (K Tons), by Country 2025 & 2033
- Figure 25: North America Flexible Insulation Industry Revenue Share (%), by Country 2025 & 2033
- Figure 26: North America Flexible Insulation Industry Volume Share (%), by Country 2025 & 2033
- Figure 27: Europe Flexible Insulation Industry Revenue (Million), by Material 2025 & 2033
- Figure 28: Europe Flexible Insulation Industry Volume (K Tons), by Material 2025 & 2033
- Figure 29: Europe Flexible Insulation Industry Revenue Share (%), by Material 2025 & 2033
- Figure 30: Europe Flexible Insulation Industry Volume Share (%), by Material 2025 & 2033
- Figure 31: Europe Flexible Insulation Industry Revenue (Million), by Insulation Type 2025 & 2033
- Figure 32: Europe Flexible Insulation Industry Volume (K Tons), by Insulation Type 2025 & 2033
- Figure 33: Europe Flexible Insulation Industry Revenue Share (%), by Insulation Type 2025 & 2033
- Figure 34: Europe Flexible Insulation Industry Volume Share (%), by Insulation Type 2025 & 2033
- Figure 35: Europe Flexible Insulation Industry Revenue (Million), by Country 2025 & 2033
- Figure 36: Europe Flexible Insulation Industry Volume (K Tons), by Country 2025 & 2033
- Figure 37: Europe Flexible Insulation Industry Revenue Share (%), by Country 2025 & 2033
- Figure 38: Europe Flexible Insulation Industry Volume Share (%), by Country 2025 & 2033
- Figure 39: South America Flexible Insulation Industry Revenue (Million), by Material 2025 & 2033
- Figure 40: South America Flexible Insulation Industry Volume (K Tons), by Material 2025 & 2033
- Figure 41: South America Flexible Insulation Industry Revenue Share (%), by Material 2025 & 2033
- Figure 42: South America Flexible Insulation Industry Volume Share (%), by Material 2025 & 2033
- Figure 43: South America Flexible Insulation Industry Revenue (Million), by Insulation Type 2025 & 2033
- Figure 44: South America Flexible Insulation Industry Volume (K Tons), by Insulation Type 2025 & 2033
- Figure 45: South America Flexible Insulation Industry Revenue Share (%), by Insulation Type 2025 & 2033
- Figure 46: South America Flexible Insulation Industry Volume Share (%), by Insulation Type 2025 & 2033
- Figure 47: South America Flexible Insulation Industry Revenue (Million), by Country 2025 & 2033
- Figure 48: South America Flexible Insulation Industry Volume (K Tons), by Country 2025 & 2033
- Figure 49: South America Flexible Insulation Industry Revenue Share (%), by Country 2025 & 2033
- Figure 50: South America Flexible Insulation Industry Volume Share (%), by Country 2025 & 2033
- Figure 51: Middle East and Africa Flexible Insulation Industry Revenue (Million), by Material 2025 & 2033
- Figure 52: Middle East and Africa Flexible Insulation Industry Volume (K Tons), by Material 2025 & 2033
- Figure 53: Middle East and Africa Flexible Insulation Industry Revenue Share (%), by Material 2025 & 2033
- Figure 54: Middle East and Africa Flexible Insulation Industry Volume Share (%), by Material 2025 & 2033
- Figure 55: Middle East and Africa Flexible Insulation Industry Revenue (Million), by Insulation Type 2025 & 2033
- Figure 56: Middle East and Africa Flexible Insulation Industry Volume (K Tons), by Insulation Type 2025 & 2033
- Figure 57: Middle East and Africa Flexible Insulation Industry Revenue Share (%), by Insulation Type 2025 & 2033
- Figure 58: Middle East and Africa Flexible Insulation Industry Volume Share (%), by Insulation Type 2025 & 2033
- Figure 59: Middle East and Africa Flexible Insulation Industry Revenue (Million), by Country 2025 & 2033
- Figure 60: Middle East and Africa Flexible Insulation Industry Volume (K Tons), by Country 2025 & 2033
- Figure 61: Middle East and Africa Flexible Insulation Industry Revenue Share (%), by Country 2025 & 2033
- Figure 62: Middle East and Africa Flexible Insulation Industry Volume Share (%), by Country 2025 & 2033
List of Tables
- Table 1: Global Flexible Insulation Industry Revenue Million Forecast, by Material 2020 & 2033
- Table 2: Global Flexible Insulation Industry Volume K Tons Forecast, by Material 2020 & 2033
- Table 3: Global Flexible Insulation Industry Revenue Million Forecast, by Insulation Type 2020 & 2033
- Table 4: Global Flexible Insulation Industry Volume K Tons Forecast, by Insulation Type 2020 & 2033
- Table 5: Global Flexible Insulation Industry Revenue Million Forecast, by Region 2020 & 2033
- Table 6: Global Flexible Insulation Industry Volume K Tons Forecast, by Region 2020 & 2033
- Table 7: Global Flexible Insulation Industry Revenue Million Forecast, by Material 2020 & 2033
- Table 8: Global Flexible Insulation Industry Volume K Tons Forecast, by Material 2020 & 2033
- Table 9: Global Flexible Insulation Industry Revenue Million Forecast, by Insulation Type 2020 & 2033
- Table 10: Global Flexible Insulation Industry Volume K Tons Forecast, by Insulation Type 2020 & 2033
- Table 11: Global Flexible Insulation Industry Revenue Million Forecast, by Country 2020 & 2033
- Table 12: Global Flexible Insulation Industry Volume K Tons Forecast, by Country 2020 & 2033
- Table 13: China Flexible Insulation Industry Revenue (Million) Forecast, by Application 2020 & 2033
- Table 14: China Flexible Insulation Industry Volume (K Tons) Forecast, by Application 2020 & 2033
- Table 15: India Flexible Insulation Industry Revenue (Million) Forecast, by Application 2020 & 2033
- Table 16: India Flexible Insulation Industry Volume (K Tons) Forecast, by Application 2020 & 2033
- Table 17: Japan Flexible Insulation Industry Revenue (Million) Forecast, by Application 2020 & 2033
- Table 18: Japan Flexible Insulation Industry Volume (K Tons) Forecast, by Application 2020 & 2033
- Table 19: South Korea Flexible Insulation Industry Revenue (Million) Forecast, by Application 2020 & 2033
- Table 20: South Korea Flexible Insulation Industry Volume (K Tons) Forecast, by Application 2020 & 2033
- Table 21: Rest of Asia Pacific Flexible Insulation Industry Revenue (Million) Forecast, by Application 2020 & 2033
- Table 22: Rest of Asia Pacific Flexible Insulation Industry Volume (K Tons) Forecast, by Application 2020 & 2033
- Table 23: Global Flexible Insulation Industry Revenue Million Forecast, by Material 2020 & 2033
- Table 24: Global Flexible Insulation Industry Volume K Tons Forecast, by Material 2020 & 2033
- Table 25: Global Flexible Insulation Industry Revenue Million Forecast, by Insulation Type 2020 & 2033
- Table 26: Global Flexible Insulation Industry Volume K Tons Forecast, by Insulation Type 2020 & 2033
- Table 27: Global Flexible Insulation Industry Revenue Million Forecast, by Country 2020 & 2033
- Table 28: Global Flexible Insulation Industry Volume K Tons Forecast, by Country 2020 & 2033
- Table 29: United States Flexible Insulation Industry Revenue (Million) Forecast, by Application 2020 & 2033
- Table 30: United States Flexible Insulation Industry Volume (K Tons) Forecast, by Application 2020 & 2033
- Table 31: Canada Flexible Insulation Industry Revenue (Million) Forecast, by Application 2020 & 2033
- Table 32: Canada Flexible Insulation Industry Volume (K Tons) Forecast, by Application 2020 & 2033
- Table 33: Mexico Flexible Insulation Industry Revenue (Million) Forecast, by Application 2020 & 2033
- Table 34: Mexico Flexible Insulation Industry Volume (K Tons) Forecast, by Application 2020 & 2033
- Table 35: Global Flexible Insulation Industry Revenue Million Forecast, by Material 2020 & 2033
- Table 36: Global Flexible Insulation Industry Volume K Tons Forecast, by Material 2020 & 2033
- Table 37: Global Flexible Insulation Industry Revenue Million Forecast, by Insulation Type 2020 & 2033
- Table 38: Global Flexible Insulation Industry Volume K Tons Forecast, by Insulation Type 2020 & 2033
- Table 39: Global Flexible Insulation Industry Revenue Million Forecast, by Country 2020 & 2033
- Table 40: Global Flexible Insulation Industry Volume K Tons Forecast, by Country 2020 & 2033
- Table 41: Germany Flexible Insulation Industry Revenue (Million) Forecast, by Application 2020 & 2033
- Table 42: Germany Flexible Insulation Industry Volume (K Tons) Forecast, by Application 2020 & 2033
- Table 43: United Kingdom Flexible Insulation Industry Revenue (Million) Forecast, by Application 2020 & 2033
- Table 44: United Kingdom Flexible Insulation Industry Volume (K Tons) Forecast, by Application 2020 & 2033
- Table 45: France Flexible Insulation Industry Revenue (Million) Forecast, by Application 2020 & 2033
- Table 46: France Flexible Insulation Industry Volume (K Tons) Forecast, by Application 2020 & 2033
- Table 47: Italy Flexible Insulation Industry Revenue (Million) Forecast, by Application 2020 & 2033
- Table 48: Italy Flexible Insulation Industry Volume (K Tons) Forecast, by Application 2020 & 2033
- Table 49: Rest of Europe Flexible Insulation Industry Revenue (Million) Forecast, by Application 2020 & 2033
- Table 50: Rest of Europe Flexible Insulation Industry Volume (K Tons) Forecast, by Application 2020 & 2033
- Table 51: Global Flexible Insulation Industry Revenue Million Forecast, by Material 2020 & 2033
- Table 52: Global Flexible Insulation Industry Volume K Tons Forecast, by Material 2020 & 2033
- Table 53: Global Flexible Insulation Industry Revenue Million Forecast, by Insulation Type 2020 & 2033
- Table 54: Global Flexible Insulation Industry Volume K Tons Forecast, by Insulation Type 2020 & 2033
- Table 55: Global Flexible Insulation Industry Revenue Million Forecast, by Country 2020 & 2033
- Table 56: Global Flexible Insulation Industry Volume K Tons Forecast, by Country 2020 & 2033
- Table 57: Brazil Flexible Insulation Industry Revenue (Million) Forecast, by Application 2020 & 2033
- Table 58: Brazil Flexible Insulation Industry Volume (K Tons) Forecast, by Application 2020 & 2033
- Table 59: Argentina Flexible Insulation Industry Revenue (Million) Forecast, by Application 2020 & 2033
- Table 60: Argentina Flexible Insulation Industry Volume (K Tons) Forecast, by Application 2020 & 2033
- Table 61: Rest of South America Flexible Insulation Industry Revenue (Million) Forecast, by Application 2020 & 2033
- Table 62: Rest of South America Flexible Insulation Industry Volume (K Tons) Forecast, by Application 2020 & 2033
- Table 63: Global Flexible Insulation Industry Revenue Million Forecast, by Material 2020 & 2033
- Table 64: Global Flexible Insulation Industry Volume K Tons Forecast, by Material 2020 & 2033
- Table 65: Global Flexible Insulation Industry Revenue Million Forecast, by Insulation Type 2020 & 2033
- Table 66: Global Flexible Insulation Industry Volume K Tons Forecast, by Insulation Type 2020 & 2033
- Table 67: Global Flexible Insulation Industry Revenue Million Forecast, by Country 2020 & 2033
- Table 68: Global Flexible Insulation Industry Volume K Tons Forecast, by Country 2020 & 2033
- Table 69: Saudi Arabia Flexible Insulation Industry Revenue (Million) Forecast, by Application 2020 & 2033
- Table 70: Saudi Arabia Flexible Insulation Industry Volume (K Tons) Forecast, by Application 2020 & 2033
- Table 71: South Africa Flexible Insulation Industry Revenue (Million) Forecast, by Application 2020 & 2033
- Table 72: South Africa Flexible Insulation Industry Volume (K Tons) Forecast, by Application 2020 & 2033
- Table 73: Rest of Middle East and Africa Flexible Insulation Industry Revenue (Million) Forecast, by Application 2020 & 2033
- Table 74: Rest of Middle East and Africa Flexible Insulation Industry Volume (K Tons) Forecast, by Application 2020 & 2033
Frequently Asked Questions
1. What is the projected Compound Annual Growth Rate (CAGR) of the Flexible Insulation Industry?
The projected CAGR is approximately 3.84%.
2. Which companies are prominent players in the Flexible Insulation Industry?
Key companies in the market include Etex Group, Superlon Holdings Berhad, Saint-Gobain, Altana AG, Cabot Corporation, Armacell, Fletcher Insulation, Thermaxx Jackets, Owens Corning, Kingspan Group, Knauf Insulation, Johns Manville.
3. What are the main segments of the Flexible Insulation Industry?
The market segments include Material, Insulation Type.
4. Can you provide details about the market size?
The market size is estimated to be USD 13.97 Million as of 2022.
5. What are some drivers contributing to market growth?
Increasing Demand for Energy Efficiency from the Construction Industry; Increasing Application of Flexible Piping Insulation; Other Drivers.
6. What are the notable trends driving market growth?
Rising Demand for Fiberglass Insulation.
7. Are there any restraints impacting market growth?
Availability of Alternatives; Other Restraints.
8. Can you provide examples of recent developments in the market?
The recent developments pertaining to the major players in the market are covered in the complete study.
9. What pricing options are available for accessing the report?
Pricing options include single-user, multi-user, and enterprise licenses priced at USD 4750, USD 5250, and USD 8750 respectively.
10. Is the market size provided in terms of value or volume?
The market size is provided in terms of value, measured in Million and volume, measured in K Tons.
11. Are there any specific market keywords associated with the report?
Yes, the market keyword associated with the report is "Flexible Insulation Industry," which aids in identifying and referencing the specific market segment covered.
12. How do I determine which pricing option suits my needs best?
The pricing options vary based on user requirements and access needs. Individual users may opt for single-user licenses, while businesses requiring broader access may choose multi-user or enterprise licenses for cost-effective access to the report.
13. Are there any additional resources or data provided in the Flexible Insulation Industry report?
While the report offers comprehensive insights, it's advisable to review the specific contents or supplementary materials provided to ascertain if additional resources or data are available.
14. How can I stay updated on further developments or reports in the Flexible Insulation Industry?
To stay informed about further developments, trends, and reports in the Flexible Insulation Industry, consider subscribing to industry newsletters, following relevant companies and organizations, or regularly checking reputable industry news sources and publications.
Methodology
Step 1 - Identification of Relevant Samples Size from Population Database


Step 2 - Approaches for Defining Global Market Size (Value, Volume* & Price*)

Note*: In applicable scenarios
Step 3 - Data Sources
Primary Research
- Web Analytics
- Survey Reports
- Research Institute
- Latest Research Reports
- Opinion Leaders
Secondary Research
- Annual Reports
- White Paper
- Latest Press Release
- Industry Association
- Paid Database
- Investor Presentations

Step 4 - Data Triangulation
Involves using different sources of information in order to increase the validity of a study
These sources are likely to be stakeholders in a program - participants, other researchers, program staff, other community members, and so on.
Then we put all data in single framework & apply various statistical tools to find out the dynamic on the market.
During the analysis stage, feedback from the stakeholder groups would be compared to determine areas of agreement as well as areas of divergence