

Key Insights
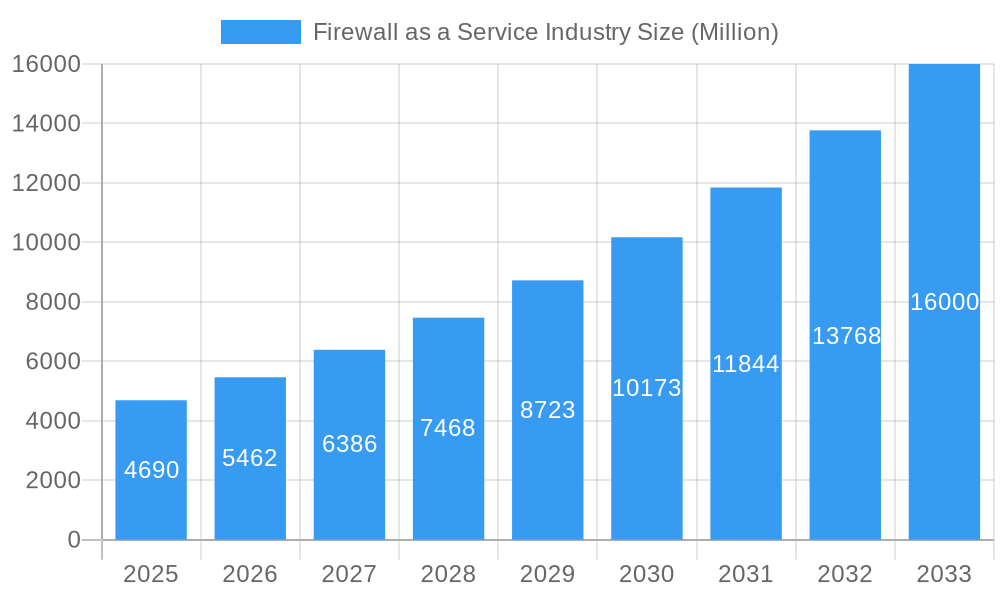
The Firewall as a Service (FWaaS) market is experiencing robust growth, projected to reach a market size of $4.69 billion in 2025 and maintain a Compound Annual Growth Rate (CAGR) of 16.47% from 2025 to 2033. This expansion is fueled by several key drivers. The increasing adoption of cloud computing and the shift towards remote work models necessitate robust and scalable security solutions, making FWaaS an attractive option for businesses of all sizes. Furthermore, the rising prevalence of sophisticated cyber threats and data breaches necessitates advanced security measures, which FWaaS effectively addresses. The inherent flexibility and cost-effectiveness of FWaaS compared to traditional on-premises firewalls are also contributing significantly to market growth. Segmentation reveals that large enterprises are currently the largest consumer segment, followed closely by SMEs, demonstrating broad market appeal across different organizational structures. The BFSI, IT & Telecom, and Healthcare sectors are leading the industry verticals in adoption, reflecting higher security concerns and regulatory compliance needs. The SaaS service model dominates the market, highlighting the ease of deployment and management that users prefer. Finally, while the hybrid deployment model is growing, public cloud deployments represent a significant portion of the FWaaS market.
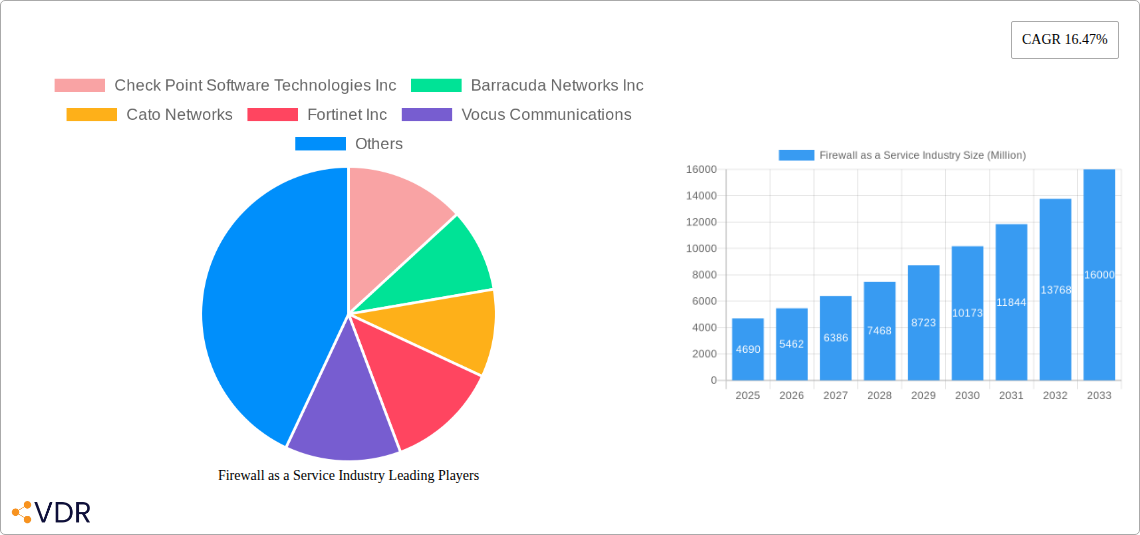
Firewall as a Service Industry Market Size (In Billion)
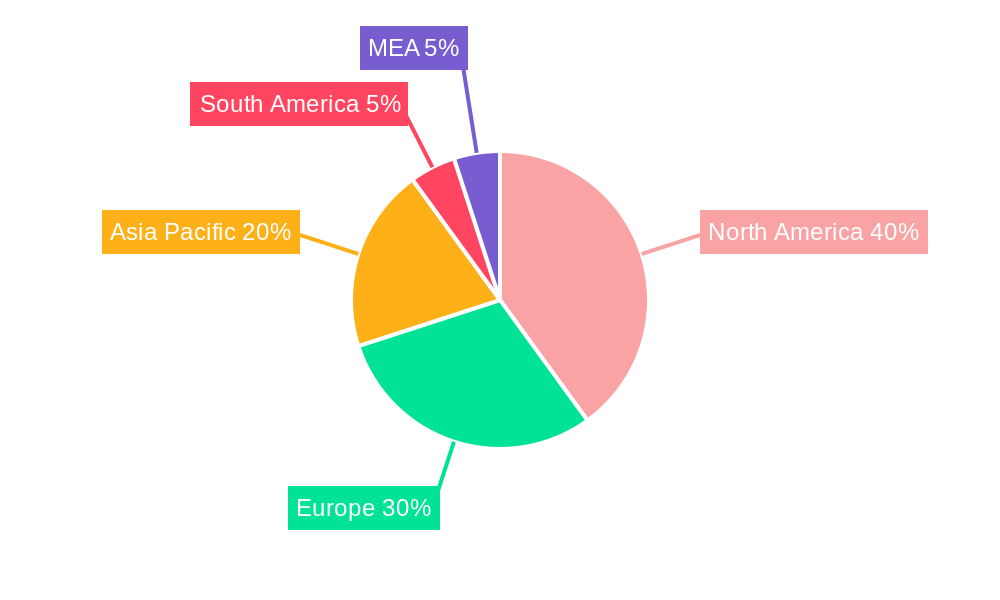
The geographical distribution shows strong growth across North America and Europe, driven by early adoption and strong regulatory frameworks. However, the Asia-Pacific region is poised for significant growth fueled by increased digitalization and a burgeoning cloud computing market. While several factors may restrain market growth, such as initial implementation costs and concerns about vendor lock-in, the overall market trajectory remains strongly positive. The competitive landscape includes established players like Check Point, Fortinet, and Cisco, alongside emerging innovative companies. This competitive environment will likely further accelerate technological innovation and drive down prices, benefiting end-users. The continued focus on enhanced security features, integration with other cloud security services, and improvements in manageability will be key factors shaping the FWaaS landscape in the coming years. The market's trajectory suggests continued strong growth, driven by the increasing need for secure and scalable network protection in an increasingly digital world.
Firewall as a Service Industry Company Market Share
Firewall as a Service (FWaaS) Industry Market Report: 2019-2033
This comprehensive report provides an in-depth analysis of the Firewall as a Service (FWaaS) industry, encompassing market dynamics, growth trends, regional dominance, product landscape, key players, and future outlook. The study period covers 2019-2033, with 2025 as the base and estimated year. The report segments the market by user type (Large Enterprises, SMEs), industry vertical (BFSI, IT & Telecom, Healthcare, Retail, Aerospace & Defence, Other), service model (SaaS, IaaS, PaaS), and deployment model (Private, Public, Hybrid). Key players analyzed include Check Point Software Technologies Inc, Barracuda Networks Inc, Cato Networks, Fortinet Inc, Vocus Communications, IntraSystems, Cisco Systems Inc, Microsoft Corporation, Juniper Networks Inc, Zscaler Inc, Sprout Technologies Ltd, and Forcepoint. The report projects a xx Million units market size by 2033.
Firewall as a Service Industry Market Dynamics & Structure
The FWaaS market is characterized by moderate concentration, with a few major players holding significant market share, but also with significant room for smaller, more specialized providers. Technological innovation, particularly in AI-driven security and cloud-native architectures, is a key driver. Regulatory frameworks, such as GDPR and CCPA, influence security practices and drive adoption. Competitive substitutes include traditional on-premise firewalls, but the ease of management and scalability of FWaaS are significant advantages. The market is largely driven by large enterprises, but SMEs are increasingly adopting FWaaS due to cost-effectiveness and ease of use. M&A activity in the sector has been relatively low in recent years, but xx deals were recorded between 2019 and 2024, mostly focused on smaller companies being acquired by larger players to enhance capabilities or expand product lines.
- Market Concentration: Moderately concentrated, with top 5 players holding approximately xx% market share in 2024.
- Technological Innovation: AI-driven threat detection, automated security policy updates are major drivers.
- Regulatory Frameworks: GDPR, CCPA, and other regulations are driving demand for robust security solutions.
- Competitive Substitutes: Traditional on-premise firewalls; FWaaS offers superior scalability and manageability.
- End-User Demographics: Large enterprises are the primary adopters, but SME adoption is growing rapidly.
- M&A Trends: xx M&A deals between 2019-2024; consolidation expected to continue.
Firewall as a Service Industry Growth Trends & Insights
The FWaaS market experienced significant growth between 2019 and 2024, driven by increasing cloud adoption, remote work trends, and the rise of sophisticated cyber threats. The market is expected to grow at a CAGR of xx% during the forecast period (2025-2033), reaching xx Million units by 2033. This growth is fueled by factors such as increasing adoption of cloud-based services, rising concerns over data breaches, and the growing need for secure access to corporate networks from remote locations. The shift towards SaaS-based security solutions, coupled with the growing popularity of SASE architectures, is also driving market growth. Consumer behavior shifts towards subscription-based services further accelerate the adoption of FWaaS. Technological disruptions in AI, machine learning, and automation are continuously improving threat detection and response capabilities, enhancing the value proposition of FWaaS.
Dominant Regions, Countries, or Segments in Firewall as a Service Industry
North America holds the largest market share in the FWaaS market, driven by high cloud adoption rates, a strong technological ecosystem, and the presence of major technology companies. Within this region, the United States dominates due to its mature technological infrastructure and high digital adoption rates. Large enterprises are the primary consumers of FWaaS due to their complex security requirements, followed by the BFSI and IT & Telecom industry verticals, which have significant data security concerns. The SaaS service model is the most dominant, followed by the hybrid deployment model as it offers a blend of flexibility and security.
- Key Drivers for North America Dominance: High cloud adoption, mature tech ecosystem, presence of major vendors.
- Large Enterprises: High security requirements and budgets drive adoption.
- BFSI & IT & Telecom Verticals: Highest data security concerns.
- SaaS Service Model: Ease of use, scalability, and cost-effectiveness.
- Hybrid Deployment: Balances on-premise control with cloud flexibility.
Firewall as a Service Industry Product Landscape
FWaaS solutions are increasingly incorporating advanced features such as AI-powered threat detection, automated security policy updates, and advanced malware protection. Products are evolving to incorporate features aligned with SASE (Secure Access Service Edge) architectures, integrating FWaaS with other security functions like secure web gateways and zero-trust network access. Key performance indicators include uptime, latency, threat detection accuracy, and ease of management. The focus is on user-friendly interfaces and simplified administration, allowing even smaller organizations to easily manage their security postures.
Key Drivers, Barriers & Challenges in Firewall as a Service Industry
Key Drivers: Increased cloud adoption, the growth of remote work, rising cyber threats, and the need for scalable and cost-effective security solutions. Government regulations promoting cybersecurity best practices also contribute.
Challenges: Integration complexity with existing infrastructure, dependence on internet connectivity, potential latency issues, and concerns about vendor lock-in. Competition among providers is intense, impacting pricing. The high initial investment for some larger deployments can also deter smaller companies.
Emerging Opportunities in Firewall as a Service Industry
Expansion into untapped markets, particularly in developing economies with growing internet penetration, presents significant opportunities. Integration with IoT devices and the increasing adoption of edge computing also create new avenues for FWaaS providers. The development of more sophisticated threat detection capabilities using AI and machine learning represents a key opportunity. Personalized security policies tailored to specific industries and business needs is another growing opportunity.
Growth Accelerators in the Firewall as a Service Industry Industry
Technological advancements, including AI and machine learning in threat detection and response, are central to market expansion. Strategic partnerships between FWaaS providers and cloud platforms extend market reach and integration capabilities. Market expansion strategies focusing on diverse industry verticals and geographic regions will significantly impact market growth.
Key Players Shaping the Firewall as a Service Industry Market
- Check Point Software Technologies Inc
- Barracuda Networks Inc
- Cato Networks
- Fortinet Inc
- Vocus Communications
- IntraSystems
- Cisco Systems Inc
- Microsoft Corporation
- Juniper Networks Inc
- Zscaler Inc
- Sprout Technologies Ltd
- Forcepoint
Notable Milestones in Firewall as a Service Industry Sector
- February 2023: WatchGuard Technologies introduced new Firebox tabletop firewall appliances, enhancing security for remote and distributed businesses.
- March 2022: Palo Alto Networks partnered with AWS to launch a managed NGFW service, simplifying AWS security deployments.
- February 2022: Juniper Networks unveiled Juniper Secure Edge, a FWaaS component of its SASE design, securing remote workforces.
In-Depth Firewall as a Service Industry Market Outlook
The FWaaS market is poised for continued strong growth, driven by technological advancements, strategic partnerships, and increasing demand for secure cloud-based solutions. The convergence of FWaaS with other security functions within SASE architectures will further fuel adoption. The expansion into emerging markets and the development of AI-powered solutions will create significant opportunities for innovation and growth in the coming years.
Firewall as a Service Industry Segmentation
-
1. Service Model
- 1.1. SaaS
- 1.2. IaaS
- 1.3. PaaS
-
2. Deployment Model
- 2.1. Private
- 2.2. Public
- 2.3. Hybrid
-
3. User Type
- 3.1. Large Enterprises
- 3.2. SMEs
-
4. Industry Vertical
- 4.1. BFSI
- 4.2. IT & Telecom
- 4.3. Healthcare
- 4.4. Retail
- 4.5. Aerospace & Defence
- 4.6. Other Industry Verticals
Firewall as a Service Industry Segmentation By Geography
-
1. North America
- 1.1. United States
- 1.2. Canada
-
2. Europe
- 2.1. United Kingdom
- 2.2. Germany
- 2.3. France
- 2.4. Rest of Europe
-
3. Asia Pacific
- 3.1. China
- 3.2. Japan
- 3.3. Australia
- 3.4. Rest of Asia Pacific
-
4. Latin America
- 4.1. Mexico
- 4.2. Brazil
- 4.3. Rest of Latin America
- 5. Middle East
Firewall as a Service Industry Regional Market Share
Geographic Coverage of Firewall as a Service Industry
Firewall as a Service Industry REPORT HIGHLIGHTS
| Aspects | Details |
|---|---|
| Study Period | 2020-2034 |
| Base Year | 2025 |
| Estimated Year | 2026 |
| Forecast Period | 2026-2034 |
| Historical Period | 2020-2025 |
| Growth Rate | CAGR of 16.47% from 2020-2034 |
| Segmentation |
|
Table of Contents
- 1. Introduction
- 1.1. Research Scope
- 1.2. Market Segmentation
- 1.3. Research Methodology
- 1.4. Definitions and Assumptions
- 2. Executive Summary
- 2.1. Introduction
- 3. Market Dynamics
- 3.1. Introduction
- 3.2. Market Drivers
- 3.2.1. Enormous Growth in Cloud Based Applications; Surge in Data Breaches on Public Cloud Environment; Everchanging Firewall Protocols for Business Organisations
- 3.3. Market Restrains
- 3.3.1. Complexity in Integrating Hosted Firewalls with On-premise Firewalls
- 3.4. Market Trends
- 3.4.1. Public Cloud Deployment Model is Expected to Hold Significant Market Share
- 4. Market Factor Analysis
- 4.1. Porters Five Forces
- 4.2. Supply/Value Chain
- 4.3. PESTEL analysis
- 4.4. Market Entropy
- 4.5. Patent/Trademark Analysis
- 5. Global Firewall as a Service Industry Analysis, Insights and Forecast, 2020-2032
- 5.1. Market Analysis, Insights and Forecast - by Service Model
- 5.1.1. SaaS
- 5.1.2. IaaS
- 5.1.3. PaaS
- 5.2. Market Analysis, Insights and Forecast - by Deployment Model
- 5.2.1. Private
- 5.2.2. Public
- 5.2.3. Hybrid
- 5.3. Market Analysis, Insights and Forecast - by User Type
- 5.3.1. Large Enterprises
- 5.3.2. SMEs
- 5.4. Market Analysis, Insights and Forecast - by Industry Vertical
- 5.4.1. BFSI
- 5.4.2. IT & Telecom
- 5.4.3. Healthcare
- 5.4.4. Retail
- 5.4.5. Aerospace & Defence
- 5.4.6. Other Industry Verticals
- 5.5. Market Analysis, Insights and Forecast - by Region
- 5.5.1. North America
- 5.5.2. Europe
- 5.5.3. Asia Pacific
- 5.5.4. Latin America
- 5.5.5. Middle East
- 5.1. Market Analysis, Insights and Forecast - by Service Model
- 6. North America Firewall as a Service Industry Analysis, Insights and Forecast, 2020-2032
- 6.1. Market Analysis, Insights and Forecast - by Service Model
- 6.1.1. SaaS
- 6.1.2. IaaS
- 6.1.3. PaaS
- 6.2. Market Analysis, Insights and Forecast - by Deployment Model
- 6.2.1. Private
- 6.2.2. Public
- 6.2.3. Hybrid
- 6.3. Market Analysis, Insights and Forecast - by User Type
- 6.3.1. Large Enterprises
- 6.3.2. SMEs
- 6.4. Market Analysis, Insights and Forecast - by Industry Vertical
- 6.4.1. BFSI
- 6.4.2. IT & Telecom
- 6.4.3. Healthcare
- 6.4.4. Retail
- 6.4.5. Aerospace & Defence
- 6.4.6. Other Industry Verticals
- 6.1. Market Analysis, Insights and Forecast - by Service Model
- 7. Europe Firewall as a Service Industry Analysis, Insights and Forecast, 2020-2032
- 7.1. Market Analysis, Insights and Forecast - by Service Model
- 7.1.1. SaaS
- 7.1.2. IaaS
- 7.1.3. PaaS
- 7.2. Market Analysis, Insights and Forecast - by Deployment Model
- 7.2.1. Private
- 7.2.2. Public
- 7.2.3. Hybrid
- 7.3. Market Analysis, Insights and Forecast - by User Type
- 7.3.1. Large Enterprises
- 7.3.2. SMEs
- 7.4. Market Analysis, Insights and Forecast - by Industry Vertical
- 7.4.1. BFSI
- 7.4.2. IT & Telecom
- 7.4.3. Healthcare
- 7.4.4. Retail
- 7.4.5. Aerospace & Defence
- 7.4.6. Other Industry Verticals
- 7.1. Market Analysis, Insights and Forecast - by Service Model
- 8. Asia Pacific Firewall as a Service Industry Analysis, Insights and Forecast, 2020-2032
- 8.1. Market Analysis, Insights and Forecast - by Service Model
- 8.1.1. SaaS
- 8.1.2. IaaS
- 8.1.3. PaaS
- 8.2. Market Analysis, Insights and Forecast - by Deployment Model
- 8.2.1. Private
- 8.2.2. Public
- 8.2.3. Hybrid
- 8.3. Market Analysis, Insights and Forecast - by User Type
- 8.3.1. Large Enterprises
- 8.3.2. SMEs
- 8.4. Market Analysis, Insights and Forecast - by Industry Vertical
- 8.4.1. BFSI
- 8.4.2. IT & Telecom
- 8.4.3. Healthcare
- 8.4.4. Retail
- 8.4.5. Aerospace & Defence
- 8.4.6. Other Industry Verticals
- 8.1. Market Analysis, Insights and Forecast - by Service Model
- 9. Latin America Firewall as a Service Industry Analysis, Insights and Forecast, 2020-2032
- 9.1. Market Analysis, Insights and Forecast - by Service Model
- 9.1.1. SaaS
- 9.1.2. IaaS
- 9.1.3. PaaS
- 9.2. Market Analysis, Insights and Forecast - by Deployment Model
- 9.2.1. Private
- 9.2.2. Public
- 9.2.3. Hybrid
- 9.3. Market Analysis, Insights and Forecast - by User Type
- 9.3.1. Large Enterprises
- 9.3.2. SMEs
- 9.4. Market Analysis, Insights and Forecast - by Industry Vertical
- 9.4.1. BFSI
- 9.4.2. IT & Telecom
- 9.4.3. Healthcare
- 9.4.4. Retail
- 9.4.5. Aerospace & Defence
- 9.4.6. Other Industry Verticals
- 9.1. Market Analysis, Insights and Forecast - by Service Model
- 10. Middle East Firewall as a Service Industry Analysis, Insights and Forecast, 2020-2032
- 10.1. Market Analysis, Insights and Forecast - by Service Model
- 10.1.1. SaaS
- 10.1.2. IaaS
- 10.1.3. PaaS
- 10.2. Market Analysis, Insights and Forecast - by Deployment Model
- 10.2.1. Private
- 10.2.2. Public
- 10.2.3. Hybrid
- 10.3. Market Analysis, Insights and Forecast - by User Type
- 10.3.1. Large Enterprises
- 10.3.2. SMEs
- 10.4. Market Analysis, Insights and Forecast - by Industry Vertical
- 10.4.1. BFSI
- 10.4.2. IT & Telecom
- 10.4.3. Healthcare
- 10.4.4. Retail
- 10.4.5. Aerospace & Defence
- 10.4.6. Other Industry Verticals
- 10.1. Market Analysis, Insights and Forecast - by Service Model
- 11. Competitive Analysis
- 11.1. Global Market Share Analysis 2025
- 11.2. Company Profiles
- 11.2.1 Check Point Software Technologies Inc
- 11.2.1.1. Overview
- 11.2.1.2. Products
- 11.2.1.3. SWOT Analysis
- 11.2.1.4. Recent Developments
- 11.2.1.5. Financials (Based on Availability)
- 11.2.2 Barracuda Networks Inc
- 11.2.2.1. Overview
- 11.2.2.2. Products
- 11.2.2.3. SWOT Analysis
- 11.2.2.4. Recent Developments
- 11.2.2.5. Financials (Based on Availability)
- 11.2.3 Cato Networks
- 11.2.3.1. Overview
- 11.2.3.2. Products
- 11.2.3.3. SWOT Analysis
- 11.2.3.4. Recent Developments
- 11.2.3.5. Financials (Based on Availability)
- 11.2.4 Fortinet Inc
- 11.2.4.1. Overview
- 11.2.4.2. Products
- 11.2.4.3. SWOT Analysis
- 11.2.4.4. Recent Developments
- 11.2.4.5. Financials (Based on Availability)
- 11.2.5 Vocus Communications
- 11.2.5.1. Overview
- 11.2.5.2. Products
- 11.2.5.3. SWOT Analysis
- 11.2.5.4. Recent Developments
- 11.2.5.5. Financials (Based on Availability)
- 11.2.6 IntraSystems
- 11.2.6.1. Overview
- 11.2.6.2. Products
- 11.2.6.3. SWOT Analysis
- 11.2.6.4. Recent Developments
- 11.2.6.5. Financials (Based on Availability)
- 11.2.7 Cisco Systems Inc
- 11.2.7.1. Overview
- 11.2.7.2. Products
- 11.2.7.3. SWOT Analysis
- 11.2.7.4. Recent Developments
- 11.2.7.5. Financials (Based on Availability)
- 11.2.8 Microsoft Corporation
- 11.2.8.1. Overview
- 11.2.8.2. Products
- 11.2.8.3. SWOT Analysis
- 11.2.8.4. Recent Developments
- 11.2.8.5. Financials (Based on Availability)
- 11.2.9 Juniper Networks Inc
- 11.2.9.1. Overview
- 11.2.9.2. Products
- 11.2.9.3. SWOT Analysis
- 11.2.9.4. Recent Developments
- 11.2.9.5. Financials (Based on Availability)
- 11.2.10 Zscaler Inc
- 11.2.10.1. Overview
- 11.2.10.2. Products
- 11.2.10.3. SWOT Analysis
- 11.2.10.4. Recent Developments
- 11.2.10.5. Financials (Based on Availability)
- 11.2.11 Sprout Technologies Ltd
- 11.2.11.1. Overview
- 11.2.11.2. Products
- 11.2.11.3. SWOT Analysis
- 11.2.11.4. Recent Developments
- 11.2.11.5. Financials (Based on Availability)
- 11.2.12 Forcepoint
- 11.2.12.1. Overview
- 11.2.12.2. Products
- 11.2.12.3. SWOT Analysis
- 11.2.12.4. Recent Developments
- 11.2.12.5. Financials (Based on Availability)
- 11.2.1 Check Point Software Technologies Inc
List of Figures
- Figure 1: Global Firewall as a Service Industry Revenue Breakdown (Million, %) by Region 2025 & 2033
- Figure 2: North America Firewall as a Service Industry Revenue (Million), by Service Model 2025 & 2033
- Figure 3: North America Firewall as a Service Industry Revenue Share (%), by Service Model 2025 & 2033
- Figure 4: North America Firewall as a Service Industry Revenue (Million), by Deployment Model 2025 & 2033
- Figure 5: North America Firewall as a Service Industry Revenue Share (%), by Deployment Model 2025 & 2033
- Figure 6: North America Firewall as a Service Industry Revenue (Million), by User Type 2025 & 2033
- Figure 7: North America Firewall as a Service Industry Revenue Share (%), by User Type 2025 & 2033
- Figure 8: North America Firewall as a Service Industry Revenue (Million), by Industry Vertical 2025 & 2033
- Figure 9: North America Firewall as a Service Industry Revenue Share (%), by Industry Vertical 2025 & 2033
- Figure 10: North America Firewall as a Service Industry Revenue (Million), by Country 2025 & 2033
- Figure 11: North America Firewall as a Service Industry Revenue Share (%), by Country 2025 & 2033
- Figure 12: Europe Firewall as a Service Industry Revenue (Million), by Service Model 2025 & 2033
- Figure 13: Europe Firewall as a Service Industry Revenue Share (%), by Service Model 2025 & 2033
- Figure 14: Europe Firewall as a Service Industry Revenue (Million), by Deployment Model 2025 & 2033
- Figure 15: Europe Firewall as a Service Industry Revenue Share (%), by Deployment Model 2025 & 2033
- Figure 16: Europe Firewall as a Service Industry Revenue (Million), by User Type 2025 & 2033
- Figure 17: Europe Firewall as a Service Industry Revenue Share (%), by User Type 2025 & 2033
- Figure 18: Europe Firewall as a Service Industry Revenue (Million), by Industry Vertical 2025 & 2033
- Figure 19: Europe Firewall as a Service Industry Revenue Share (%), by Industry Vertical 2025 & 2033
- Figure 20: Europe Firewall as a Service Industry Revenue (Million), by Country 2025 & 2033
- Figure 21: Europe Firewall as a Service Industry Revenue Share (%), by Country 2025 & 2033
- Figure 22: Asia Pacific Firewall as a Service Industry Revenue (Million), by Service Model 2025 & 2033
- Figure 23: Asia Pacific Firewall as a Service Industry Revenue Share (%), by Service Model 2025 & 2033
- Figure 24: Asia Pacific Firewall as a Service Industry Revenue (Million), by Deployment Model 2025 & 2033
- Figure 25: Asia Pacific Firewall as a Service Industry Revenue Share (%), by Deployment Model 2025 & 2033
- Figure 26: Asia Pacific Firewall as a Service Industry Revenue (Million), by User Type 2025 & 2033
- Figure 27: Asia Pacific Firewall as a Service Industry Revenue Share (%), by User Type 2025 & 2033
- Figure 28: Asia Pacific Firewall as a Service Industry Revenue (Million), by Industry Vertical 2025 & 2033
- Figure 29: Asia Pacific Firewall as a Service Industry Revenue Share (%), by Industry Vertical 2025 & 2033
- Figure 30: Asia Pacific Firewall as a Service Industry Revenue (Million), by Country 2025 & 2033
- Figure 31: Asia Pacific Firewall as a Service Industry Revenue Share (%), by Country 2025 & 2033
- Figure 32: Latin America Firewall as a Service Industry Revenue (Million), by Service Model 2025 & 2033
- Figure 33: Latin America Firewall as a Service Industry Revenue Share (%), by Service Model 2025 & 2033
- Figure 34: Latin America Firewall as a Service Industry Revenue (Million), by Deployment Model 2025 & 2033
- Figure 35: Latin America Firewall as a Service Industry Revenue Share (%), by Deployment Model 2025 & 2033
- Figure 36: Latin America Firewall as a Service Industry Revenue (Million), by User Type 2025 & 2033
- Figure 37: Latin America Firewall as a Service Industry Revenue Share (%), by User Type 2025 & 2033
- Figure 38: Latin America Firewall as a Service Industry Revenue (Million), by Industry Vertical 2025 & 2033
- Figure 39: Latin America Firewall as a Service Industry Revenue Share (%), by Industry Vertical 2025 & 2033
- Figure 40: Latin America Firewall as a Service Industry Revenue (Million), by Country 2025 & 2033
- Figure 41: Latin America Firewall as a Service Industry Revenue Share (%), by Country 2025 & 2033
- Figure 42: Middle East Firewall as a Service Industry Revenue (Million), by Service Model 2025 & 2033
- Figure 43: Middle East Firewall as a Service Industry Revenue Share (%), by Service Model 2025 & 2033
- Figure 44: Middle East Firewall as a Service Industry Revenue (Million), by Deployment Model 2025 & 2033
- Figure 45: Middle East Firewall as a Service Industry Revenue Share (%), by Deployment Model 2025 & 2033
- Figure 46: Middle East Firewall as a Service Industry Revenue (Million), by User Type 2025 & 2033
- Figure 47: Middle East Firewall as a Service Industry Revenue Share (%), by User Type 2025 & 2033
- Figure 48: Middle East Firewall as a Service Industry Revenue (Million), by Industry Vertical 2025 & 2033
- Figure 49: Middle East Firewall as a Service Industry Revenue Share (%), by Industry Vertical 2025 & 2033
- Figure 50: Middle East Firewall as a Service Industry Revenue (Million), by Country 2025 & 2033
- Figure 51: Middle East Firewall as a Service Industry Revenue Share (%), by Country 2025 & 2033
List of Tables
- Table 1: Global Firewall as a Service Industry Revenue Million Forecast, by Service Model 2020 & 2033
- Table 2: Global Firewall as a Service Industry Revenue Million Forecast, by Deployment Model 2020 & 2033
- Table 3: Global Firewall as a Service Industry Revenue Million Forecast, by User Type 2020 & 2033
- Table 4: Global Firewall as a Service Industry Revenue Million Forecast, by Industry Vertical 2020 & 2033
- Table 5: Global Firewall as a Service Industry Revenue Million Forecast, by Region 2020 & 2033
- Table 6: Global Firewall as a Service Industry Revenue Million Forecast, by Service Model 2020 & 2033
- Table 7: Global Firewall as a Service Industry Revenue Million Forecast, by Deployment Model 2020 & 2033
- Table 8: Global Firewall as a Service Industry Revenue Million Forecast, by User Type 2020 & 2033
- Table 9: Global Firewall as a Service Industry Revenue Million Forecast, by Industry Vertical 2020 & 2033
- Table 10: Global Firewall as a Service Industry Revenue Million Forecast, by Country 2020 & 2033
- Table 11: United States Firewall as a Service Industry Revenue (Million) Forecast, by Application 2020 & 2033
- Table 12: Canada Firewall as a Service Industry Revenue (Million) Forecast, by Application 2020 & 2033
- Table 13: Global Firewall as a Service Industry Revenue Million Forecast, by Service Model 2020 & 2033
- Table 14: Global Firewall as a Service Industry Revenue Million Forecast, by Deployment Model 2020 & 2033
- Table 15: Global Firewall as a Service Industry Revenue Million Forecast, by User Type 2020 & 2033
- Table 16: Global Firewall as a Service Industry Revenue Million Forecast, by Industry Vertical 2020 & 2033
- Table 17: Global Firewall as a Service Industry Revenue Million Forecast, by Country 2020 & 2033
- Table 18: United Kingdom Firewall as a Service Industry Revenue (Million) Forecast, by Application 2020 & 2033
- Table 19: Germany Firewall as a Service Industry Revenue (Million) Forecast, by Application 2020 & 2033
- Table 20: France Firewall as a Service Industry Revenue (Million) Forecast, by Application 2020 & 2033
- Table 21: Rest of Europe Firewall as a Service Industry Revenue (Million) Forecast, by Application 2020 & 2033
- Table 22: Global Firewall as a Service Industry Revenue Million Forecast, by Service Model 2020 & 2033
- Table 23: Global Firewall as a Service Industry Revenue Million Forecast, by Deployment Model 2020 & 2033
- Table 24: Global Firewall as a Service Industry Revenue Million Forecast, by User Type 2020 & 2033
- Table 25: Global Firewall as a Service Industry Revenue Million Forecast, by Industry Vertical 2020 & 2033
- Table 26: Global Firewall as a Service Industry Revenue Million Forecast, by Country 2020 & 2033
- Table 27: China Firewall as a Service Industry Revenue (Million) Forecast, by Application 2020 & 2033
- Table 28: Japan Firewall as a Service Industry Revenue (Million) Forecast, by Application 2020 & 2033
- Table 29: Australia Firewall as a Service Industry Revenue (Million) Forecast, by Application 2020 & 2033
- Table 30: Rest of Asia Pacific Firewall as a Service Industry Revenue (Million) Forecast, by Application 2020 & 2033
- Table 31: Global Firewall as a Service Industry Revenue Million Forecast, by Service Model 2020 & 2033
- Table 32: Global Firewall as a Service Industry Revenue Million Forecast, by Deployment Model 2020 & 2033
- Table 33: Global Firewall as a Service Industry Revenue Million Forecast, by User Type 2020 & 2033
- Table 34: Global Firewall as a Service Industry Revenue Million Forecast, by Industry Vertical 2020 & 2033
- Table 35: Global Firewall as a Service Industry Revenue Million Forecast, by Country 2020 & 2033
- Table 36: Mexico Firewall as a Service Industry Revenue (Million) Forecast, by Application 2020 & 2033
- Table 37: Brazil Firewall as a Service Industry Revenue (Million) Forecast, by Application 2020 & 2033
- Table 38: Rest of Latin America Firewall as a Service Industry Revenue (Million) Forecast, by Application 2020 & 2033
- Table 39: Global Firewall as a Service Industry Revenue Million Forecast, by Service Model 2020 & 2033
- Table 40: Global Firewall as a Service Industry Revenue Million Forecast, by Deployment Model 2020 & 2033
- Table 41: Global Firewall as a Service Industry Revenue Million Forecast, by User Type 2020 & 2033
- Table 42: Global Firewall as a Service Industry Revenue Million Forecast, by Industry Vertical 2020 & 2033
- Table 43: Global Firewall as a Service Industry Revenue Million Forecast, by Country 2020 & 2033
Frequently Asked Questions
1. What is the projected Compound Annual Growth Rate (CAGR) of the Firewall as a Service Industry?
The projected CAGR is approximately 16.47%.
2. Which companies are prominent players in the Firewall as a Service Industry?
Key companies in the market include Check Point Software Technologies Inc, Barracuda Networks Inc, Cato Networks, Fortinet Inc, Vocus Communications, IntraSystems, Cisco Systems Inc, Microsoft Corporation, Juniper Networks Inc, Zscaler Inc , Sprout Technologies Ltd, Forcepoint.
3. What are the main segments of the Firewall as a Service Industry?
The market segments include Service Model, Deployment Model, User Type, Industry Vertical.
4. Can you provide details about the market size?
The market size is estimated to be USD 4.69 Million as of 2022.
5. What are some drivers contributing to market growth?
Enormous Growth in Cloud Based Applications; Surge in Data Breaches on Public Cloud Environment; Everchanging Firewall Protocols for Business Organisations.
6. What are the notable trends driving market growth?
Public Cloud Deployment Model is Expected to Hold Significant Market Share.
7. Are there any restraints impacting market growth?
Complexity in Integrating Hosted Firewalls with On-premise Firewalls.
8. Can you provide examples of recent developments in the market?
February 2023, WatchGuard Technologies introduced the Firebox T25/T25-W, T45/T45-POE/T45-W-POE, and T85-POE tabletop firewall appliances. These new firewalls, powered by WatchGuard's Unified Security Platform architecture that offers advanced security and easy management via WatchGuard Cloud, are designed to offer the remote and distributed business environments required for better protection against network security threats.
9. What pricing options are available for accessing the report?
Pricing options include single-user, multi-user, and enterprise licenses priced at USD 4750, USD 5250, and USD 8750 respectively.
10. Is the market size provided in terms of value or volume?
The market size is provided in terms of value, measured in Million.
11. Are there any specific market keywords associated with the report?
Yes, the market keyword associated with the report is "Firewall as a Service Industry," which aids in identifying and referencing the specific market segment covered.
12. How do I determine which pricing option suits my needs best?
The pricing options vary based on user requirements and access needs. Individual users may opt for single-user licenses, while businesses requiring broader access may choose multi-user or enterprise licenses for cost-effective access to the report.
13. Are there any additional resources or data provided in the Firewall as a Service Industry report?
While the report offers comprehensive insights, it's advisable to review the specific contents or supplementary materials provided to ascertain if additional resources or data are available.
14. How can I stay updated on further developments or reports in the Firewall as a Service Industry?
To stay informed about further developments, trends, and reports in the Firewall as a Service Industry, consider subscribing to industry newsletters, following relevant companies and organizations, or regularly checking reputable industry news sources and publications.
Methodology
Step 1 - Identification of Relevant Samples Size from Population Database


Step 2 - Approaches for Defining Global Market Size (Value, Volume* & Price*)

Note*: In applicable scenarios
Step 3 - Data Sources
Primary Research
- Web Analytics
- Survey Reports
- Research Institute
- Latest Research Reports
- Opinion Leaders
Secondary Research
- Annual Reports
- White Paper
- Latest Press Release
- Industry Association
- Paid Database
- Investor Presentations

Step 4 - Data Triangulation
Involves using different sources of information in order to increase the validity of a study
These sources are likely to be stakeholders in a program - participants, other researchers, program staff, other community members, and so on.
Then we put all data in single framework & apply various statistical tools to find out the dynamic on the market.
During the analysis stage, feedback from the stakeholder groups would be compared to determine areas of agreement as well as areas of divergence