
Key Insights
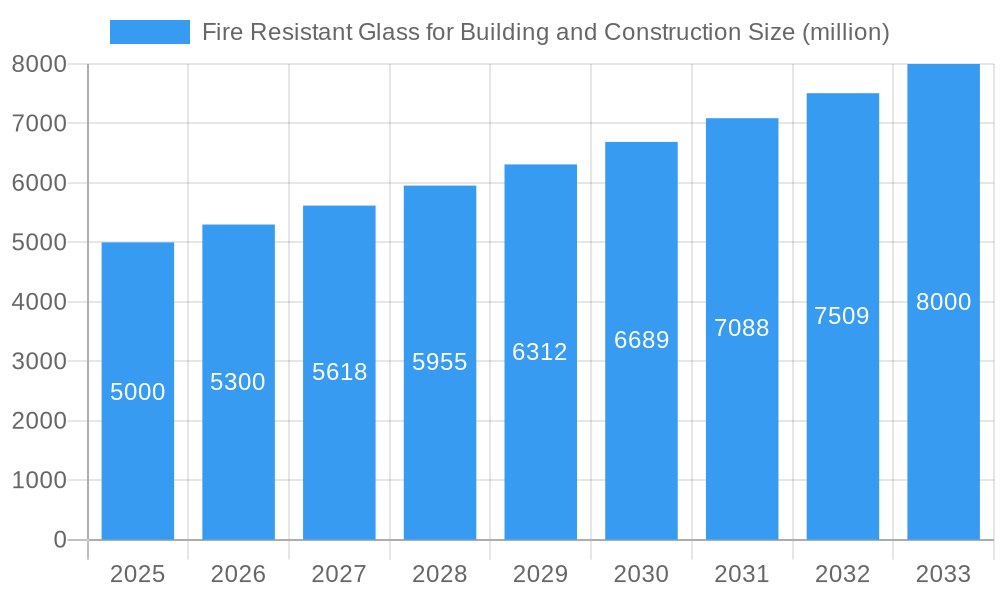
The global fire-resistant glass market for building and construction is experiencing robust growth, driven by increasing construction activities worldwide, stringent building codes emphasizing fire safety, and rising awareness about fire prevention. The market, estimated at $5 billion in 2025, is projected to witness a Compound Annual Growth Rate (CAGR) of 6% from 2025 to 2033, reaching approximately $8 billion by 2033. Key growth drivers include the expanding adoption of high-rise buildings and commercial structures, coupled with government regulations mandating enhanced fire safety measures. Furthermore, advancements in glass technology, such as the development of thinner, lighter, and more aesthetically pleasing fire-resistant glass solutions, are fueling market expansion. Major players like Saint-Gobain, SCHOTT, AGC, Pilkington, and Nippon Electric Glass are actively contributing to innovation and market penetration through strategic partnerships, acquisitions, and product diversification. The segment is further segmented based on type (wired glass, laminated glass, etc.) and application (windows, doors, walls, etc.), with the laminated glass segment holding a significant market share due to its superior performance characteristics.

Fire Resistant Glass for Building and Construction Market Size (In Billion)

However, the market faces certain restraints, including the relatively high cost of fire-resistant glass compared to conventional glass, and potential supply chain disruptions impacting material availability. Despite these challenges, the long-term outlook remains positive, fueled by sustained growth in the construction industry and ongoing technological advancements in the sector. This makes fire-resistant glass an increasingly attractive investment opportunity for manufacturers and stakeholders throughout the value chain. The regional market is diversified, with North America and Europe currently holding dominant positions. However, emerging economies in Asia-Pacific are exhibiting significant growth potential due to rapid urbanization and infrastructural development.
Fire Resistant Glass for Building and Construction Company Market Share
Fire Resistant Glass for Building and Construction Market Report: 2019-2033
This comprehensive report provides a detailed analysis of the Fire Resistant Glass for Building and Construction market, offering invaluable insights for industry professionals, investors, and strategic decision-makers. With a study period spanning 2019-2033, a base year of 2025, and a forecast period of 2025-2033, this report leverages extensive research and data analysis to paint a clear picture of current market dynamics and future growth trajectories. The report meticulously examines market segments, key players, technological advancements, and regional variations to provide a 360-degree view of this vital sector. The total market size is projected to reach xx million units by 2033.
Fire Resistant Glass for Building and Construction Market Dynamics & Structure
The fire resistant glass market is characterized by a moderately concentrated landscape, with key players such as Saint-Gobain, SCHOTT, AGC, Pilkington, Nippon Electric Glass, Promat, Safti First, and Tecfire holding significant market share. Technological innovation, driven by advancements in material science and manufacturing processes, is a major driver of growth. Stringent building codes and regulations, particularly in developed economies, mandate the use of fire-resistant materials, further bolstering market demand. The market faces competition from alternative materials, such as fire-resistant curtain walls and specialized coatings. End-user demographics are primarily focused on commercial and residential construction sectors, with significant demand also emerging from infrastructure projects. M&A activity in the industry has been relatively moderate in recent years, with xx major deals recorded between 2019 and 2024.
- Market Concentration: Moderately concentrated, with top 8 players holding approximately xx% market share in 2024.
- Technological Innovation: Focus on improving thermal performance, enhancing transparency, and reducing weight.
- Regulatory Frameworks: Stringent building codes driving adoption in developed regions.
- Competitive Substitutes: Fire-resistant curtain walls and specialized coatings pose competitive challenges.
- End-User Demographics: Primarily commercial and residential construction, with growing infrastructure sector demand.
- M&A Trends: xx major M&A deals between 2019 and 2024, indicating consolidation potential.
Fire Resistant Glass for Building and Construction Growth Trends & Insights
The fire-resistant glass market experienced steady growth during the historical period (2019-2024), with a CAGR of xx%. This growth is attributed to increasing construction activity globally, particularly in emerging economies, coupled with a rising awareness of fire safety regulations. Technological advancements, such as the development of laminated and insulated fire-resistant glass, have broadened the applications of this product. Consumer behavior shifts toward prioritizing safety and sustainability in building designs are also driving demand. The market is projected to maintain a robust growth trajectory during the forecast period (2025-2033), with a forecasted CAGR of xx%, driven by factors such as increasing urbanization, infrastructural development, and stringent fire safety norms. Market penetration in emerging markets remains relatively low, offering significant untapped potential.
Dominant Regions, Countries, or Segments in Fire Resistant Glass for Building and Construction
North America and Europe currently dominate the fire-resistant glass market, driven by stringent building codes and a high level of construction activity. However, Asia-Pacific is projected to experience the fastest growth in the coming years, fueled by rapid urbanization and significant infrastructural investments in countries like China and India. The commercial segment holds the largest market share due to the high concentration of high-rise buildings and other large-scale commercial structures that necessitate the use of fire-resistant glass.
- Key Drivers in North America & Europe: Stringent building codes, high construction activity, advanced technological adoption.
- Key Drivers in Asia-Pacific: Rapid urbanization, robust infrastructure development, increasing disposable incomes.
- Market Share: North America holds approximately xx% market share in 2024, followed by Europe with xx%. Asia Pacific is projected to surpass Europe by 2033.
- Growth Potential: Asia-Pacific region demonstrates significant untapped potential due to its rapid economic growth and infrastructural development.
Fire Resistant Glass for Building and Construction Product Landscape
The fire-resistant glass market encompasses a range of products, including wired glass, laminated glass, insulated glass units (IGUs), and specialty glass formulations designed to meet specific performance requirements. Innovations focus on enhanced transparency, improved thermal performance, and lighter weight designs. These advancements improve aesthetics and energy efficiency, widening the applications of fire-resistant glass in diverse architectural designs. Unique selling propositions include superior fire resistance ratings, enhanced safety features, and improved aesthetic appeal compared to traditional fire-rated materials.
Key Drivers, Barriers & Challenges in Fire Resistant Glass for Building and Construction
Key Drivers: Increasing construction activity globally, stringent building codes and regulations, rising awareness of fire safety, technological advancements leading to improved performance and aesthetics.
Challenges: High manufacturing costs, competition from substitute materials, supply chain disruptions affecting raw material availability and prices. Regulatory hurdles related to certification and compliance can also hamper growth.
Emerging Opportunities in Fire Resistant Glass for Building and Construction
Emerging opportunities include the expansion into specialized applications like high-rise buildings, transportation infrastructure, and industrial facilities. Innovative applications, such as self-cleaning fire-resistant glass and integration with smart building technologies, will fuel market growth. Growing consumer preference for aesthetically pleasing and energy-efficient building materials presents significant opportunities.
Growth Accelerators in the Fire Resistant Glass for Building and Construction Industry
Technological breakthroughs, such as the development of lighter, more transparent, and energy-efficient fire-resistant glass, are key growth accelerators. Strategic partnerships between glass manufacturers and construction companies, coupled with targeted market expansion strategies focusing on emerging economies, will further propel market growth. Government initiatives promoting sustainable and green building practices will also contribute to the market's expansion.
Key Players Shaping the Fire Resistant Glass for Building and Construction Market
- Saint-Gobain
- SCHOTT
- AGC
- Pilkington
- Nippon Electric Glass
- Promat
- Safti First
- Tecfire
Notable Milestones in Fire Resistant Glass for Building and Construction Sector
- 2020: Introduction of a new generation of laminated fire-resistant glass with enhanced transparency by Saint-Gobain.
- 2022: AGC launches a new fire-resistant glass product line with improved thermal performance.
- 2023: Acquisition of a smaller fire-resistant glass manufacturer by SCHOTT, expanding its market reach. (Further details require specific data)
In-Depth Fire Resistant Glass for Building and Construction Market Outlook
The future of the fire-resistant glass market looks promising, driven by a confluence of factors including increasing urbanization, infrastructure development, and stringent fire safety regulations. Strategic investments in R&D, coupled with expansion into emerging markets and the adoption of innovative manufacturing processes, will further propel market growth. The continued focus on sustainability and energy efficiency will shape product development and create lucrative opportunities for key players.
Fire Resistant Glass for Building and Construction Segmentation
-
1. Application
- 1.1. Commercial
- 1.2. Residential
-
2. Types
- 2.1. Laminated Fire Resistant Glass
- 2.2. Wired Fire Resistant Glass
- 2.3. Tempered Fire Resistant Glass
- 2.4. Ceramic Fire Resistant Glass
- 2.5. Others
Fire Resistant Glass for Building and Construction Segmentation By Geography
-
1. North America
- 1.1. United States
- 1.2. Canada
- 1.3. Mexico
-
2. South America
- 2.1. Brazil
- 2.2. Argentina
- 2.3. Rest of South America
-
3. Europe
- 3.1. United Kingdom
- 3.2. Germany
- 3.3. France
- 3.4. Italy
- 3.5. Spain
- 3.6. Russia
- 3.7. Benelux
- 3.8. Nordics
- 3.9. Rest of Europe
-
4. Middle East & Africa
- 4.1. Turkey
- 4.2. Israel
- 4.3. GCC
- 4.4. North Africa
- 4.5. South Africa
- 4.6. Rest of Middle East & Africa
-
5. Asia Pacific
- 5.1. China
- 5.2. India
- 5.3. Japan
- 5.4. South Korea
- 5.5. ASEAN
- 5.6. Oceania
- 5.7. Rest of Asia Pacific

Fire Resistant Glass for Building and Construction Regional Market Share
Geographic Coverage of Fire Resistant Glass for Building and Construction
Fire Resistant Glass for Building and Construction REPORT HIGHLIGHTS
| Aspects | Details |
|---|---|
| Study Period | 2020-2034 |
| Base Year | 2025 |
| Estimated Year | 2026 |
| Forecast Period | 2026-2034 |
| Historical Period | 2020-2025 |
| Growth Rate | CAGR of XX% from 2020-2034 |
| Segmentation |
|
Table of Contents
- 1. Introduction
- 1.1. Research Scope
- 1.2. Market Segmentation
- 1.3. Research Methodology
- 1.4. Definitions and Assumptions
- 2. Executive Summary
- 2.1. Introduction
- 3. Market Dynamics
- 3.1. Introduction
- 3.2. Market Drivers
- 3.3. Market Restrains
- 3.4. Market Trends
- 4. Market Factor Analysis
- 4.1. Porters Five Forces
- 4.2. Supply/Value Chain
- 4.3. PESTEL analysis
- 4.4. Market Entropy
- 4.5. Patent/Trademark Analysis
- 5. Global Fire Resistant Glass for Building and Construction Analysis, Insights and Forecast, 2020-2032
- 5.1. Market Analysis, Insights and Forecast - by Application
- 5.1.1. Commercial
- 5.1.2. Residential
- 5.2. Market Analysis, Insights and Forecast - by Types
- 5.2.1. Laminated Fire Resistant Glass
- 5.2.2. Wired Fire Resistant Glass
- 5.2.3. Tempered Fire Resistant Glass
- 5.2.4. Ceramic Fire Resistant Glass
- 5.2.5. Others
- 5.3. Market Analysis, Insights and Forecast - by Region
- 5.3.1. North America
- 5.3.2. South America
- 5.3.3. Europe
- 5.3.4. Middle East & Africa
- 5.3.5. Asia Pacific
- 5.1. Market Analysis, Insights and Forecast - by Application
- 6. North America Fire Resistant Glass for Building and Construction Analysis, Insights and Forecast, 2020-2032
- 6.1. Market Analysis, Insights and Forecast - by Application
- 6.1.1. Commercial
- 6.1.2. Residential
- 6.2. Market Analysis, Insights and Forecast - by Types
- 6.2.1. Laminated Fire Resistant Glass
- 6.2.2. Wired Fire Resistant Glass
- 6.2.3. Tempered Fire Resistant Glass
- 6.2.4. Ceramic Fire Resistant Glass
- 6.2.5. Others
- 6.1. Market Analysis, Insights and Forecast - by Application
- 7. South America Fire Resistant Glass for Building and Construction Analysis, Insights and Forecast, 2020-2032
- 7.1. Market Analysis, Insights and Forecast - by Application
- 7.1.1. Commercial
- 7.1.2. Residential
- 7.2. Market Analysis, Insights and Forecast - by Types
- 7.2.1. Laminated Fire Resistant Glass
- 7.2.2. Wired Fire Resistant Glass
- 7.2.3. Tempered Fire Resistant Glass
- 7.2.4. Ceramic Fire Resistant Glass
- 7.2.5. Others
- 7.1. Market Analysis, Insights and Forecast - by Application
- 8. Europe Fire Resistant Glass for Building and Construction Analysis, Insights and Forecast, 2020-2032
- 8.1. Market Analysis, Insights and Forecast - by Application
- 8.1.1. Commercial
- 8.1.2. Residential
- 8.2. Market Analysis, Insights and Forecast - by Types
- 8.2.1. Laminated Fire Resistant Glass
- 8.2.2. Wired Fire Resistant Glass
- 8.2.3. Tempered Fire Resistant Glass
- 8.2.4. Ceramic Fire Resistant Glass
- 8.2.5. Others
- 8.1. Market Analysis, Insights and Forecast - by Application
- 9. Middle East & Africa Fire Resistant Glass for Building and Construction Analysis, Insights and Forecast, 2020-2032
- 9.1. Market Analysis, Insights and Forecast - by Application
- 9.1.1. Commercial
- 9.1.2. Residential
- 9.2. Market Analysis, Insights and Forecast - by Types
- 9.2.1. Laminated Fire Resistant Glass
- 9.2.2. Wired Fire Resistant Glass
- 9.2.3. Tempered Fire Resistant Glass
- 9.2.4. Ceramic Fire Resistant Glass
- 9.2.5. Others
- 9.1. Market Analysis, Insights and Forecast - by Application
- 10. Asia Pacific Fire Resistant Glass for Building and Construction Analysis, Insights and Forecast, 2020-2032
- 10.1. Market Analysis, Insights and Forecast - by Application
- 10.1.1. Commercial
- 10.1.2. Residential
- 10.2. Market Analysis, Insights and Forecast - by Types
- 10.2.1. Laminated Fire Resistant Glass
- 10.2.2. Wired Fire Resistant Glass
- 10.2.3. Tempered Fire Resistant Glass
- 10.2.4. Ceramic Fire Resistant Glass
- 10.2.5. Others
- 10.1. Market Analysis, Insights and Forecast - by Application
- 11. Competitive Analysis
- 11.1. Global Market Share Analysis 2025
- 11.2. Company Profiles
- 11.2.1 Saint-Gobain
- 11.2.1.1. Overview
- 11.2.1.2. Products
- 11.2.1.3. SWOT Analysis
- 11.2.1.4. Recent Developments
- 11.2.1.5. Financials (Based on Availability)
- 11.2.2 SCHOTT
- 11.2.2.1. Overview
- 11.2.2.2. Products
- 11.2.2.3. SWOT Analysis
- 11.2.2.4. Recent Developments
- 11.2.2.5. Financials (Based on Availability)
- 11.2.3 AGC
- 11.2.3.1. Overview
- 11.2.3.2. Products
- 11.2.3.3. SWOT Analysis
- 11.2.3.4. Recent Developments
- 11.2.3.5. Financials (Based on Availability)
- 11.2.4 Pilkington
- 11.2.4.1. Overview
- 11.2.4.2. Products
- 11.2.4.3. SWOT Analysis
- 11.2.4.4. Recent Developments
- 11.2.4.5. Financials (Based on Availability)
- 11.2.5 Nippon Electric Glass
- 11.2.5.1. Overview
- 11.2.5.2. Products
- 11.2.5.3. SWOT Analysis
- 11.2.5.4. Recent Developments
- 11.2.5.5. Financials (Based on Availability)
- 11.2.6 Promat
- 11.2.6.1. Overview
- 11.2.6.2. Products
- 11.2.6.3. SWOT Analysis
- 11.2.6.4. Recent Developments
- 11.2.6.5. Financials (Based on Availability)
- 11.2.7 Safti First
- 11.2.7.1. Overview
- 11.2.7.2. Products
- 11.2.7.3. SWOT Analysis
- 11.2.7.4. Recent Developments
- 11.2.7.5. Financials (Based on Availability)
- 11.2.8 Tecfire
- 11.2.8.1. Overview
- 11.2.8.2. Products
- 11.2.8.3. SWOT Analysis
- 11.2.8.4. Recent Developments
- 11.2.8.5. Financials (Based on Availability)
- 11.2.1 Saint-Gobain
List of Figures
- Figure 1: Global Fire Resistant Glass for Building and Construction Revenue Breakdown (million, %) by Region 2025 & 2033
- Figure 2: Global Fire Resistant Glass for Building and Construction Volume Breakdown (K, %) by Region 2025 & 2033
- Figure 3: North America Fire Resistant Glass for Building and Construction Revenue (million), by Application 2025 & 2033
- Figure 4: North America Fire Resistant Glass for Building and Construction Volume (K), by Application 2025 & 2033
- Figure 5: North America Fire Resistant Glass for Building and Construction Revenue Share (%), by Application 2025 & 2033
- Figure 6: North America Fire Resistant Glass for Building and Construction Volume Share (%), by Application 2025 & 2033
- Figure 7: North America Fire Resistant Glass for Building and Construction Revenue (million), by Types 2025 & 2033
- Figure 8: North America Fire Resistant Glass for Building and Construction Volume (K), by Types 2025 & 2033
- Figure 9: North America Fire Resistant Glass for Building and Construction Revenue Share (%), by Types 2025 & 2033
- Figure 10: North America Fire Resistant Glass for Building and Construction Volume Share (%), by Types 2025 & 2033
- Figure 11: North America Fire Resistant Glass for Building and Construction Revenue (million), by Country 2025 & 2033
- Figure 12: North America Fire Resistant Glass for Building and Construction Volume (K), by Country 2025 & 2033
- Figure 13: North America Fire Resistant Glass for Building and Construction Revenue Share (%), by Country 2025 & 2033
- Figure 14: North America Fire Resistant Glass for Building and Construction Volume Share (%), by Country 2025 & 2033
- Figure 15: South America Fire Resistant Glass for Building and Construction Revenue (million), by Application 2025 & 2033
- Figure 16: South America Fire Resistant Glass for Building and Construction Volume (K), by Application 2025 & 2033
- Figure 17: South America Fire Resistant Glass for Building and Construction Revenue Share (%), by Application 2025 & 2033
- Figure 18: South America Fire Resistant Glass for Building and Construction Volume Share (%), by Application 2025 & 2033
- Figure 19: South America Fire Resistant Glass for Building and Construction Revenue (million), by Types 2025 & 2033
- Figure 20: South America Fire Resistant Glass for Building and Construction Volume (K), by Types 2025 & 2033
- Figure 21: South America Fire Resistant Glass for Building and Construction Revenue Share (%), by Types 2025 & 2033
- Figure 22: South America Fire Resistant Glass for Building and Construction Volume Share (%), by Types 2025 & 2033
- Figure 23: South America Fire Resistant Glass for Building and Construction Revenue (million), by Country 2025 & 2033
- Figure 24: South America Fire Resistant Glass for Building and Construction Volume (K), by Country 2025 & 2033
- Figure 25: South America Fire Resistant Glass for Building and Construction Revenue Share (%), by Country 2025 & 2033
- Figure 26: South America Fire Resistant Glass for Building and Construction Volume Share (%), by Country 2025 & 2033
- Figure 27: Europe Fire Resistant Glass for Building and Construction Revenue (million), by Application 2025 & 2033
- Figure 28: Europe Fire Resistant Glass for Building and Construction Volume (K), by Application 2025 & 2033
- Figure 29: Europe Fire Resistant Glass for Building and Construction Revenue Share (%), by Application 2025 & 2033
- Figure 30: Europe Fire Resistant Glass for Building and Construction Volume Share (%), by Application 2025 & 2033
- Figure 31: Europe Fire Resistant Glass for Building and Construction Revenue (million), by Types 2025 & 2033
- Figure 32: Europe Fire Resistant Glass for Building and Construction Volume (K), by Types 2025 & 2033
- Figure 33: Europe Fire Resistant Glass for Building and Construction Revenue Share (%), by Types 2025 & 2033
- Figure 34: Europe Fire Resistant Glass for Building and Construction Volume Share (%), by Types 2025 & 2033
- Figure 35: Europe Fire Resistant Glass for Building and Construction Revenue (million), by Country 2025 & 2033
- Figure 36: Europe Fire Resistant Glass for Building and Construction Volume (K), by Country 2025 & 2033
- Figure 37: Europe Fire Resistant Glass for Building and Construction Revenue Share (%), by Country 2025 & 2033
- Figure 38: Europe Fire Resistant Glass for Building and Construction Volume Share (%), by Country 2025 & 2033
- Figure 39: Middle East & Africa Fire Resistant Glass for Building and Construction Revenue (million), by Application 2025 & 2033
- Figure 40: Middle East & Africa Fire Resistant Glass for Building and Construction Volume (K), by Application 2025 & 2033
- Figure 41: Middle East & Africa Fire Resistant Glass for Building and Construction Revenue Share (%), by Application 2025 & 2033
- Figure 42: Middle East & Africa Fire Resistant Glass for Building and Construction Volume Share (%), by Application 2025 & 2033
- Figure 43: Middle East & Africa Fire Resistant Glass for Building and Construction Revenue (million), by Types 2025 & 2033
- Figure 44: Middle East & Africa Fire Resistant Glass for Building and Construction Volume (K), by Types 2025 & 2033
- Figure 45: Middle East & Africa Fire Resistant Glass for Building and Construction Revenue Share (%), by Types 2025 & 2033
- Figure 46: Middle East & Africa Fire Resistant Glass for Building and Construction Volume Share (%), by Types 2025 & 2033
- Figure 47: Middle East & Africa Fire Resistant Glass for Building and Construction Revenue (million), by Country 2025 & 2033
- Figure 48: Middle East & Africa Fire Resistant Glass for Building and Construction Volume (K), by Country 2025 & 2033
- Figure 49: Middle East & Africa Fire Resistant Glass for Building and Construction Revenue Share (%), by Country 2025 & 2033
- Figure 50: Middle East & Africa Fire Resistant Glass for Building and Construction Volume Share (%), by Country 2025 & 2033
- Figure 51: Asia Pacific Fire Resistant Glass for Building and Construction Revenue (million), by Application 2025 & 2033
- Figure 52: Asia Pacific Fire Resistant Glass for Building and Construction Volume (K), by Application 2025 & 2033
- Figure 53: Asia Pacific Fire Resistant Glass for Building and Construction Revenue Share (%), by Application 2025 & 2033
- Figure 54: Asia Pacific Fire Resistant Glass for Building and Construction Volume Share (%), by Application 2025 & 2033
- Figure 55: Asia Pacific Fire Resistant Glass for Building and Construction Revenue (million), by Types 2025 & 2033
- Figure 56: Asia Pacific Fire Resistant Glass for Building and Construction Volume (K), by Types 2025 & 2033
- Figure 57: Asia Pacific Fire Resistant Glass for Building and Construction Revenue Share (%), by Types 2025 & 2033
- Figure 58: Asia Pacific Fire Resistant Glass for Building and Construction Volume Share (%), by Types 2025 & 2033
- Figure 59: Asia Pacific Fire Resistant Glass for Building and Construction Revenue (million), by Country 2025 & 2033
- Figure 60: Asia Pacific Fire Resistant Glass for Building and Construction Volume (K), by Country 2025 & 2033
- Figure 61: Asia Pacific Fire Resistant Glass for Building and Construction Revenue Share (%), by Country 2025 & 2033
- Figure 62: Asia Pacific Fire Resistant Glass for Building and Construction Volume Share (%), by Country 2025 & 2033
List of Tables
- Table 1: Global Fire Resistant Glass for Building and Construction Revenue million Forecast, by Application 2020 & 2033
- Table 2: Global Fire Resistant Glass for Building and Construction Volume K Forecast, by Application 2020 & 2033
- Table 3: Global Fire Resistant Glass for Building and Construction Revenue million Forecast, by Types 2020 & 2033
- Table 4: Global Fire Resistant Glass for Building and Construction Volume K Forecast, by Types 2020 & 2033
- Table 5: Global Fire Resistant Glass for Building and Construction Revenue million Forecast, by Region 2020 & 2033
- Table 6: Global Fire Resistant Glass for Building and Construction Volume K Forecast, by Region 2020 & 2033
- Table 7: Global Fire Resistant Glass for Building and Construction Revenue million Forecast, by Application 2020 & 2033
- Table 8: Global Fire Resistant Glass for Building and Construction Volume K Forecast, by Application 2020 & 2033
- Table 9: Global Fire Resistant Glass for Building and Construction Revenue million Forecast, by Types 2020 & 2033
- Table 10: Global Fire Resistant Glass for Building and Construction Volume K Forecast, by Types 2020 & 2033
- Table 11: Global Fire Resistant Glass for Building and Construction Revenue million Forecast, by Country 2020 & 2033
- Table 12: Global Fire Resistant Glass for Building and Construction Volume K Forecast, by Country 2020 & 2033
- Table 13: United States Fire Resistant Glass for Building and Construction Revenue (million) Forecast, by Application 2020 & 2033
- Table 14: United States Fire Resistant Glass for Building and Construction Volume (K) Forecast, by Application 2020 & 2033
- Table 15: Canada Fire Resistant Glass for Building and Construction Revenue (million) Forecast, by Application 2020 & 2033
- Table 16: Canada Fire Resistant Glass for Building and Construction Volume (K) Forecast, by Application 2020 & 2033
- Table 17: Mexico Fire Resistant Glass for Building and Construction Revenue (million) Forecast, by Application 2020 & 2033
- Table 18: Mexico Fire Resistant Glass for Building and Construction Volume (K) Forecast, by Application 2020 & 2033
- Table 19: Global Fire Resistant Glass for Building and Construction Revenue million Forecast, by Application 2020 & 2033
- Table 20: Global Fire Resistant Glass for Building and Construction Volume K Forecast, by Application 2020 & 2033
- Table 21: Global Fire Resistant Glass for Building and Construction Revenue million Forecast, by Types 2020 & 2033
- Table 22: Global Fire Resistant Glass for Building and Construction Volume K Forecast, by Types 2020 & 2033
- Table 23: Global Fire Resistant Glass for Building and Construction Revenue million Forecast, by Country 2020 & 2033
- Table 24: Global Fire Resistant Glass for Building and Construction Volume K Forecast, by Country 2020 & 2033
- Table 25: Brazil Fire Resistant Glass for Building and Construction Revenue (million) Forecast, by Application 2020 & 2033
- Table 26: Brazil Fire Resistant Glass for Building and Construction Volume (K) Forecast, by Application 2020 & 2033
- Table 27: Argentina Fire Resistant Glass for Building and Construction Revenue (million) Forecast, by Application 2020 & 2033
- Table 28: Argentina Fire Resistant Glass for Building and Construction Volume (K) Forecast, by Application 2020 & 2033
- Table 29: Rest of South America Fire Resistant Glass for Building and Construction Revenue (million) Forecast, by Application 2020 & 2033
- Table 30: Rest of South America Fire Resistant Glass for Building and Construction Volume (K) Forecast, by Application 2020 & 2033
- Table 31: Global Fire Resistant Glass for Building and Construction Revenue million Forecast, by Application 2020 & 2033
- Table 32: Global Fire Resistant Glass for Building and Construction Volume K Forecast, by Application 2020 & 2033
- Table 33: Global Fire Resistant Glass for Building and Construction Revenue million Forecast, by Types 2020 & 2033
- Table 34: Global Fire Resistant Glass for Building and Construction Volume K Forecast, by Types 2020 & 2033
- Table 35: Global Fire Resistant Glass for Building and Construction Revenue million Forecast, by Country 2020 & 2033
- Table 36: Global Fire Resistant Glass for Building and Construction Volume K Forecast, by Country 2020 & 2033
- Table 37: United Kingdom Fire Resistant Glass for Building and Construction Revenue (million) Forecast, by Application 2020 & 2033
- Table 38: United Kingdom Fire Resistant Glass for Building and Construction Volume (K) Forecast, by Application 2020 & 2033
- Table 39: Germany Fire Resistant Glass for Building and Construction Revenue (million) Forecast, by Application 2020 & 2033
- Table 40: Germany Fire Resistant Glass for Building and Construction Volume (K) Forecast, by Application 2020 & 2033
- Table 41: France Fire Resistant Glass for Building and Construction Revenue (million) Forecast, by Application 2020 & 2033
- Table 42: France Fire Resistant Glass for Building and Construction Volume (K) Forecast, by Application 2020 & 2033
- Table 43: Italy Fire Resistant Glass for Building and Construction Revenue (million) Forecast, by Application 2020 & 2033
- Table 44: Italy Fire Resistant Glass for Building and Construction Volume (K) Forecast, by Application 2020 & 2033
- Table 45: Spain Fire Resistant Glass for Building and Construction Revenue (million) Forecast, by Application 2020 & 2033
- Table 46: Spain Fire Resistant Glass for Building and Construction Volume (K) Forecast, by Application 2020 & 2033
- Table 47: Russia Fire Resistant Glass for Building and Construction Revenue (million) Forecast, by Application 2020 & 2033
- Table 48: Russia Fire Resistant Glass for Building and Construction Volume (K) Forecast, by Application 2020 & 2033
- Table 49: Benelux Fire Resistant Glass for Building and Construction Revenue (million) Forecast, by Application 2020 & 2033
- Table 50: Benelux Fire Resistant Glass for Building and Construction Volume (K) Forecast, by Application 2020 & 2033
- Table 51: Nordics Fire Resistant Glass for Building and Construction Revenue (million) Forecast, by Application 2020 & 2033
- Table 52: Nordics Fire Resistant Glass for Building and Construction Volume (K) Forecast, by Application 2020 & 2033
- Table 53: Rest of Europe Fire Resistant Glass for Building and Construction Revenue (million) Forecast, by Application 2020 & 2033
- Table 54: Rest of Europe Fire Resistant Glass for Building and Construction Volume (K) Forecast, by Application 2020 & 2033
- Table 55: Global Fire Resistant Glass for Building and Construction Revenue million Forecast, by Application 2020 & 2033
- Table 56: Global Fire Resistant Glass for Building and Construction Volume K Forecast, by Application 2020 & 2033
- Table 57: Global Fire Resistant Glass for Building and Construction Revenue million Forecast, by Types 2020 & 2033
- Table 58: Global Fire Resistant Glass for Building and Construction Volume K Forecast, by Types 2020 & 2033
- Table 59: Global Fire Resistant Glass for Building and Construction Revenue million Forecast, by Country 2020 & 2033
- Table 60: Global Fire Resistant Glass for Building and Construction Volume K Forecast, by Country 2020 & 2033
- Table 61: Turkey Fire Resistant Glass for Building and Construction Revenue (million) Forecast, by Application 2020 & 2033
- Table 62: Turkey Fire Resistant Glass for Building and Construction Volume (K) Forecast, by Application 2020 & 2033
- Table 63: Israel Fire Resistant Glass for Building and Construction Revenue (million) Forecast, by Application 2020 & 2033
- Table 64: Israel Fire Resistant Glass for Building and Construction Volume (K) Forecast, by Application 2020 & 2033
- Table 65: GCC Fire Resistant Glass for Building and Construction Revenue (million) Forecast, by Application 2020 & 2033
- Table 66: GCC Fire Resistant Glass for Building and Construction Volume (K) Forecast, by Application 2020 & 2033
- Table 67: North Africa Fire Resistant Glass for Building and Construction Revenue (million) Forecast, by Application 2020 & 2033
- Table 68: North Africa Fire Resistant Glass for Building and Construction Volume (K) Forecast, by Application 2020 & 2033
- Table 69: South Africa Fire Resistant Glass for Building and Construction Revenue (million) Forecast, by Application 2020 & 2033
- Table 70: South Africa Fire Resistant Glass for Building and Construction Volume (K) Forecast, by Application 2020 & 2033
- Table 71: Rest of Middle East & Africa Fire Resistant Glass for Building and Construction Revenue (million) Forecast, by Application 2020 & 2033
- Table 72: Rest of Middle East & Africa Fire Resistant Glass for Building and Construction Volume (K) Forecast, by Application 2020 & 2033
- Table 73: Global Fire Resistant Glass for Building and Construction Revenue million Forecast, by Application 2020 & 2033
- Table 74: Global Fire Resistant Glass for Building and Construction Volume K Forecast, by Application 2020 & 2033
- Table 75: Global Fire Resistant Glass for Building and Construction Revenue million Forecast, by Types 2020 & 2033
- Table 76: Global Fire Resistant Glass for Building and Construction Volume K Forecast, by Types 2020 & 2033
- Table 77: Global Fire Resistant Glass for Building and Construction Revenue million Forecast, by Country 2020 & 2033
- Table 78: Global Fire Resistant Glass for Building and Construction Volume K Forecast, by Country 2020 & 2033
- Table 79: China Fire Resistant Glass for Building and Construction Revenue (million) Forecast, by Application 2020 & 2033
- Table 80: China Fire Resistant Glass for Building and Construction Volume (K) Forecast, by Application 2020 & 2033
- Table 81: India Fire Resistant Glass for Building and Construction Revenue (million) Forecast, by Application 2020 & 2033
- Table 82: India Fire Resistant Glass for Building and Construction Volume (K) Forecast, by Application 2020 & 2033
- Table 83: Japan Fire Resistant Glass for Building and Construction Revenue (million) Forecast, by Application 2020 & 2033
- Table 84: Japan Fire Resistant Glass for Building and Construction Volume (K) Forecast, by Application 2020 & 2033
- Table 85: South Korea Fire Resistant Glass for Building and Construction Revenue (million) Forecast, by Application 2020 & 2033
- Table 86: South Korea Fire Resistant Glass for Building and Construction Volume (K) Forecast, by Application 2020 & 2033
- Table 87: ASEAN Fire Resistant Glass for Building and Construction Revenue (million) Forecast, by Application 2020 & 2033
- Table 88: ASEAN Fire Resistant Glass for Building and Construction Volume (K) Forecast, by Application 2020 & 2033
- Table 89: Oceania Fire Resistant Glass for Building and Construction Revenue (million) Forecast, by Application 2020 & 2033
- Table 90: Oceania Fire Resistant Glass for Building and Construction Volume (K) Forecast, by Application 2020 & 2033
- Table 91: Rest of Asia Pacific Fire Resistant Glass for Building and Construction Revenue (million) Forecast, by Application 2020 & 2033
- Table 92: Rest of Asia Pacific Fire Resistant Glass for Building and Construction Volume (K) Forecast, by Application 2020 & 2033
Frequently Asked Questions
1. What is the projected Compound Annual Growth Rate (CAGR) of the Fire Resistant Glass for Building and Construction?
The projected CAGR is approximately XX%.
2. Which companies are prominent players in the Fire Resistant Glass for Building and Construction?
Key companies in the market include Saint-Gobain, SCHOTT, AGC, Pilkington, Nippon Electric Glass, Promat, Safti First, Tecfire.
3. What are the main segments of the Fire Resistant Glass for Building and Construction?
The market segments include Application, Types.
4. Can you provide details about the market size?
The market size is estimated to be USD XXX million as of 2022.
5. What are some drivers contributing to market growth?
N/A
6. What are the notable trends driving market growth?
N/A
7. Are there any restraints impacting market growth?
N/A
8. Can you provide examples of recent developments in the market?
N/A
9. What pricing options are available for accessing the report?
Pricing options include single-user, multi-user, and enterprise licenses priced at USD 4350.00, USD 6525.00, and USD 8700.00 respectively.
10. Is the market size provided in terms of value or volume?
The market size is provided in terms of value, measured in million and volume, measured in K.
11. Are there any specific market keywords associated with the report?
Yes, the market keyword associated with the report is "Fire Resistant Glass for Building and Construction," which aids in identifying and referencing the specific market segment covered.
12. How do I determine which pricing option suits my needs best?
The pricing options vary based on user requirements and access needs. Individual users may opt for single-user licenses, while businesses requiring broader access may choose multi-user or enterprise licenses for cost-effective access to the report.
13. Are there any additional resources or data provided in the Fire Resistant Glass for Building and Construction report?
While the report offers comprehensive insights, it's advisable to review the specific contents or supplementary materials provided to ascertain if additional resources or data are available.
14. How can I stay updated on further developments or reports in the Fire Resistant Glass for Building and Construction?
To stay informed about further developments, trends, and reports in the Fire Resistant Glass for Building and Construction, consider subscribing to industry newsletters, following relevant companies and organizations, or regularly checking reputable industry news sources and publications.
Methodology
Step 1 - Identification of Relevant Samples Size from Population Database


Step 2 - Approaches for Defining Global Market Size (Value, Volume* & Price*)

Note*: In applicable scenarios
Step 3 - Data Sources
Primary Research
- Web Analytics
- Survey Reports
- Research Institute
- Latest Research Reports
- Opinion Leaders
Secondary Research
- Annual Reports
- White Paper
- Latest Press Release
- Industry Association
- Paid Database
- Investor Presentations

Step 4 - Data Triangulation
Involves using different sources of information in order to increase the validity of a study
These sources are likely to be stakeholders in a program - participants, other researchers, program staff, other community members, and so on.
Then we put all data in single framework & apply various statistical tools to find out the dynamic on the market.
During the analysis stage, feedback from the stakeholder groups would be compared to determine areas of agreement as well as areas of divergence

